Free Statistics

of Irreproducible Research!

Author's title

Author*Unverified author*
R Software Modulerwasp_smp.wasp
Title produced by softwareStandard Deviation-Mean Plot
Date of computationFri, 02 Aug 2013 03:42:40 -0400
Cite this page as followsStatistical Computations at FreeStatistics.org, Office for Research Development and Education, URL https://freestatistics.org/blog/index.php?v=date/2013/Aug/02/t13754293811aet4mxwqihk0mi.htm/, Retrieved Fri, 03 May 2024 01:50:35 +0000
Statistical Computations at FreeStatistics.org, Office for Research Development and Education, URL https://freestatistics.org/blog/index.php?pk=210894, Retrieved Fri, 03 May 2024 01:50:35 +0000
QR Codes:

Original text written by user:
IsPrivate?No (this computation is public)
User-defined keywordsVan Camp Stef
Estimated Impact194
Family? (F = Feedback message, R = changed R code, M = changed R Module, P = changed Parameters, D = changed Data)
-       [Standard Deviation-Mean Plot] [] [2013-08-02 07:42:40] [941d89646656d1688f5e273fb31a8e6b] [Current]
Feedback Forum

Post a new message
Dataseries X:
940
1070
1060
1070
1070
1040
950
1120
1150
1040
1040
1120
1000
960
1060
1060
1110
1030
960
1130
1150
1030
1040
1030
1070
1000
1020
1100
1080
990
1000
1110
1170
1030
1100
1020
1090
990
1060
1120
1030
1050
1030
1130
1140
980
1150
990
1020
1060
1080
1180
980
960
1020
1170
1150
950
1160
1120
1010
1010
1060
1130
1000
1000
1070
1150
1080
980
1210
1020
980
1030
1050
1190
970
950
1070
1170
1050
960
1300
1080
1030
1030
1070
1260
990
950
1080
1190
1050
950
1250
1140
1080
1020
1140
1320
1100
1040
1090
1280
1030
930
1280
1020


Summary of computational transaction
Raw Inputview raw input (R code)
Raw Outputview raw output of R engine
Computing time2 seconds
R Server'George Udny Yule' @ yule.wessa.net

\begin{tabular}{lllllllll}
\hline
Summary of computational transaction \tabularnewline
Raw Input & view raw input (R code)  \tabularnewline
Raw Output & view raw output of R engine  \tabularnewline
Computing time & 2 seconds \tabularnewline
R Server & 'George Udny Yule' @ yule.wessa.net \tabularnewline
\hline
\end{tabular}
%Source: https://freestatistics.org/blog/index.php?pk=210894&T=0

[TABLE]
[ROW][C]Summary of computational transaction[/C][/ROW]
[ROW][C]Raw Input[/C][C]view raw input (R code) [/C][/ROW]
[ROW][C]Raw Output[/C][C]view raw output of R engine [/C][/ROW]
[ROW][C]Computing time[/C][C]2 seconds[/C][/ROW]
[ROW][C]R Server[/C][C]'George Udny Yule' @ yule.wessa.net[/C][/ROW]
[/TABLE]
Source: https://freestatistics.org/blog/index.php?pk=210894&T=0

Globally Unique Identifier (entire table): ba.freestatistics.org/blog/index.php?pk=210894&T=0

As an alternative you can also use a QR Code:  

The GUIDs for individual cells are displayed in the table below:

Summary of computational transaction
Raw Inputview raw input (R code)
Raw Outputview raw output of R engine
Computing time2 seconds
R Server'George Udny Yule' @ yule.wessa.net


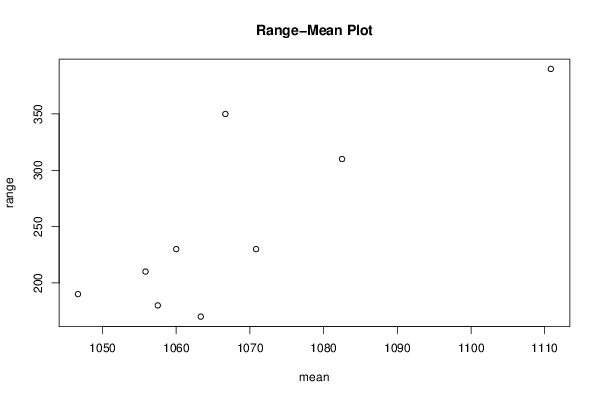
Standard Deviation-Mean Plot
SectionMeanStandard DeviationRange
11055.8333333333362.5893301004592210
21046.6666666666760.3524998854583190
31057.555.9423404457255180
41063.3333333333361.6932784512268170
51070.8333333333384.6874825282326230
6106071.4779050412847230
71066.66666666667106.287203825153350
81082.5106.525711791695310
91110.83333333333122.13690778149390

\begin{tabular}{lllllllll}
\hline
Standard Deviation-Mean Plot \tabularnewline
Section & Mean & Standard Deviation & Range \tabularnewline
1 & 1055.83333333333 & 62.5893301004592 & 210 \tabularnewline
2 & 1046.66666666667 & 60.3524998854583 & 190 \tabularnewline
3 & 1057.5 & 55.9423404457255 & 180 \tabularnewline
4 & 1063.33333333333 & 61.6932784512268 & 170 \tabularnewline
5 & 1070.83333333333 & 84.6874825282326 & 230 \tabularnewline
6 & 1060 & 71.4779050412847 & 230 \tabularnewline
7 & 1066.66666666667 & 106.287203825153 & 350 \tabularnewline
8 & 1082.5 & 106.525711791695 & 310 \tabularnewline
9 & 1110.83333333333 & 122.13690778149 & 390 \tabularnewline
\hline
\end{tabular}
%Source: https://freestatistics.org/blog/index.php?pk=210894&T=1

[TABLE]
[ROW][C]Standard Deviation-Mean Plot[/C][/ROW]
[ROW][C]Section[/C][C]Mean[/C][C]Standard Deviation[/C][C]Range[/C][/ROW]
[ROW][C]1[/C][C]1055.83333333333[/C][C]62.5893301004592[/C][C]210[/C][/ROW]
[ROW][C]2[/C][C]1046.66666666667[/C][C]60.3524998854583[/C][C]190[/C][/ROW]
[ROW][C]3[/C][C]1057.5[/C][C]55.9423404457255[/C][C]180[/C][/ROW]
[ROW][C]4[/C][C]1063.33333333333[/C][C]61.6932784512268[/C][C]170[/C][/ROW]
[ROW][C]5[/C][C]1070.83333333333[/C][C]84.6874825282326[/C][C]230[/C][/ROW]
[ROW][C]6[/C][C]1060[/C][C]71.4779050412847[/C][C]230[/C][/ROW]
[ROW][C]7[/C][C]1066.66666666667[/C][C]106.287203825153[/C][C]350[/C][/ROW]
[ROW][C]8[/C][C]1082.5[/C][C]106.525711791695[/C][C]310[/C][/ROW]
[ROW][C]9[/C][C]1110.83333333333[/C][C]122.13690778149[/C][C]390[/C][/ROW]
[/TABLE]
Source: https://freestatistics.org/blog/index.php?pk=210894&T=1

Globally Unique Identifier (entire table): ba.freestatistics.org/blog/index.php?pk=210894&T=1

As an alternative you can also use a QR Code:  

The GUIDs for individual cells are displayed in the table below:

Standard Deviation-Mean Plot
SectionMeanStandard DeviationRange
11055.8333333333362.5893301004592210
21046.6666666666760.3524998854583190
31057.555.9423404457255180
41063.3333333333361.6932784512268170
51070.8333333333384.6874825282326230
6106071.4779050412847230
71066.66666666667106.287203825153350
81082.5106.525711791695310
91110.83333333333122.13690778149390


Regression: S.E.(k) = alpha + beta * Mean(k)
alpha-1117.48575378624
beta1.12220484811582
S.D.0.251084510493947
T-STAT4.46943081398435
p-value0.00290292240852199

\begin{tabular}{lllllllll}
\hline
Regression: S.E.(k) = alpha + beta * Mean(k) \tabularnewline
alpha & -1117.48575378624 \tabularnewline
beta & 1.12220484811582 \tabularnewline
S.D. & 0.251084510493947 \tabularnewline
T-STAT & 4.46943081398435 \tabularnewline
p-value & 0.00290292240852199 \tabularnewline
\hline
\end{tabular}
%Source: https://freestatistics.org/blog/index.php?pk=210894&T=2

[TABLE]
[ROW][C]Regression: S.E.(k) = alpha + beta * Mean(k)[/C][/ROW]
[ROW][C]alpha[/C][C]-1117.48575378624[/C][/ROW]
[ROW][C]beta[/C][C]1.12220484811582[/C][/ROW]
[ROW][C]S.D.[/C][C]0.251084510493947[/C][/ROW]
[ROW][C]T-STAT[/C][C]4.46943081398435[/C][/ROW]
[ROW][C]p-value[/C][C]0.00290292240852199[/C][/ROW]
[/TABLE]
Source: https://freestatistics.org/blog/index.php?pk=210894&T=2

Globally Unique Identifier (entire table): ba.freestatistics.org/blog/index.php?pk=210894&T=2

As an alternative you can also use a QR Code:  

The GUIDs for individual cells are displayed in the table below:

Regression: S.E.(k) = alpha + beta * Mean(k)
alpha-1117.48575378624
beta1.12220484811582
S.D.0.251084510493947
T-STAT4.46943081398435
p-value0.00290292240852199


Regression: ln S.E.(k) = alpha + beta * ln Mean(k)
alpha-93.4265929625929
beta14.0221963118377
S.D.3.47249356362333
T-STAT4.03807697693941
p-value0.00494490238094185
Lambda-13.0221963118377

\begin{tabular}{lllllllll}
\hline
Regression: ln S.E.(k) = alpha + beta * ln Mean(k) \tabularnewline
alpha & -93.4265929625929 \tabularnewline
beta & 14.0221963118377 \tabularnewline
S.D. & 3.47249356362333 \tabularnewline
T-STAT & 4.03807697693941 \tabularnewline
p-value & 0.00494490238094185 \tabularnewline
Lambda & -13.0221963118377 \tabularnewline
\hline
\end{tabular}
%Source: https://freestatistics.org/blog/index.php?pk=210894&T=3

[TABLE]
[ROW][C]Regression: ln S.E.(k) = alpha + beta * ln Mean(k)[/C][/ROW]
[ROW][C]alpha[/C][C]-93.4265929625929[/C][/ROW]
[ROW][C]beta[/C][C]14.0221963118377[/C][/ROW]
[ROW][C]S.D.[/C][C]3.47249356362333[/C][/ROW]
[ROW][C]T-STAT[/C][C]4.03807697693941[/C][/ROW]
[ROW][C]p-value[/C][C]0.00494490238094185[/C][/ROW]
[ROW][C]Lambda[/C][C]-13.0221963118377[/C][/ROW]
[/TABLE]
Source: https://freestatistics.org/blog/index.php?pk=210894&T=3

Globally Unique Identifier (entire table): ba.freestatistics.org/blog/index.php?pk=210894&T=3

As an alternative you can also use a QR Code:  

The GUIDs for individual cells are displayed in the table below:

Regression: ln S.E.(k) = alpha + beta * ln Mean(k)
alpha-93.4265929625929
beta14.0221963118377
S.D.3.47249356362333
T-STAT4.03807697693941
p-value0.00494490238094185
Lambda-13.0221963118377


Parameters (Session):
par1 = 12 ;
Parameters (R input):
par1 = 12 ;
R code (references can be found in the software module):
par1 <- as.numeric(par1)
(n <- length(x))
(np <- floor(n / par1))
arr <- array(NA,dim=c(par1,np))
j <- 0
k <- 1
for (i in 1:(np*par1))
{
j = j + 1
arr[j,k] <- x[i]
if (j == par1) {
j = 0
k=k+1
}
}
arr
arr.mean <- array(NA,dim=np)
arr.sd <- array(NA,dim=np)
arr.range <- array(NA,dim=np)
for (j in 1:np)
{
arr.mean[j] <- mean(arr[,j],na.rm=TRUE)
arr.sd[j] <- sd(arr[,j],na.rm=TRUE)
arr.range[j] <- max(arr[,j],na.rm=TRUE) - min(arr[,j],na.rm=TRUE)
}
arr.mean
arr.sd
arr.range
(lm1 <- lm(arr.sd~arr.mean))
(lnlm1 <- lm(log(arr.sd)~log(arr.mean)))
(lm2 <- lm(arr.range~arr.mean))
bitmap(file='test1.png')
plot(arr.mean,arr.sd,main='Standard Deviation-Mean Plot',xlab='mean',ylab='standard deviation')
dev.off()
bitmap(file='test2.png')
plot(arr.mean,arr.range,main='Range-Mean Plot',xlab='mean',ylab='range')
dev.off()
load(file='createtable')
a<-table.start()
a<-table.row.start(a)
a<-table.element(a,'Standard Deviation-Mean Plot',4,TRUE)
a<-table.row.end(a)
a<-table.row.start(a)
a<-table.element(a,'Section',header=TRUE)
a<-table.element(a,'Mean',header=TRUE)
a<-table.element(a,'Standard Deviation',header=TRUE)
a<-table.element(a,'Range',header=TRUE)
a<-table.row.end(a)
for (j in 1:np) {
a<-table.row.start(a)
a<-table.element(a,j,header=TRUE)
a<-table.element(a,arr.mean[j])
a<-table.element(a,arr.sd[j] )
a<-table.element(a,arr.range[j] )
a<-table.row.end(a)
}
a<-table.end(a)
table.save(a,file='mytable.tab')
a<-table.start()
a<-table.row.start(a)
a<-table.element(a,'Regression: S.E.(k) = alpha + beta * Mean(k)',2,TRUE)
a<-table.row.end(a)
a<-table.row.start(a)
a<-table.element(a,'alpha',header=TRUE)
a<-table.element(a,lm1$coefficients[[1]])
a<-table.row.end(a)
a<-table.row.start(a)
a<-table.element(a,'beta',header=TRUE)
a<-table.element(a,lm1$coefficients[[2]])
a<-table.row.end(a)
a<-table.row.start(a)
a<-table.element(a,'S.D.',header=TRUE)
a<-table.element(a,summary(lm1)$coefficients[2,2])
a<-table.row.end(a)
a<-table.row.start(a)
a<-table.element(a,'T-STAT',header=TRUE)
a<-table.element(a,summary(lm1)$coefficients[2,3])
a<-table.row.end(a)
a<-table.row.start(a)
a<-table.element(a,'p-value',header=TRUE)
a<-table.element(a,summary(lm1)$coefficients[2,4])
a<-table.row.end(a)
a<-table.end(a)
table.save(a,file='mytable1.tab')
a<-table.start()
a<-table.row.start(a)
a<-table.element(a,'Regression: ln S.E.(k) = alpha + beta * ln Mean(k)',2,TRUE)
a<-table.row.end(a)
a<-table.row.start(a)
a<-table.element(a,'alpha',header=TRUE)
a<-table.element(a,lnlm1$coefficients[[1]])
a<-table.row.end(a)
a<-table.row.start(a)
a<-table.element(a,'beta',header=TRUE)
a<-table.element(a,lnlm1$coefficients[[2]])
a<-table.row.end(a)
a<-table.row.start(a)
a<-table.element(a,'S.D.',header=TRUE)
a<-table.element(a,summary(lnlm1)$coefficients[2,2])
a<-table.row.end(a)
a<-table.row.start(a)
a<-table.element(a,'T-STAT',header=TRUE)
a<-table.element(a,summary(lnlm1)$coefficients[2,3])
a<-table.row.end(a)
a<-table.row.start(a)
a<-table.element(a,'p-value',header=TRUE)
a<-table.element(a,summary(lnlm1)$coefficients[2,4])
a<-table.row.end(a)
a<-table.row.start(a)
a<-table.element(a,'Lambda',header=TRUE)
a<-table.element(a,1-lnlm1$coefficients[[2]])
a<-table.row.end(a)
a<-table.end(a)
table.save(a,file='mytable2.tab')