Free Statistics

of Irreproducible Research!

Author's title

Author*Unverified author*
R Software Modulerwasp_autocorrelation.wasp
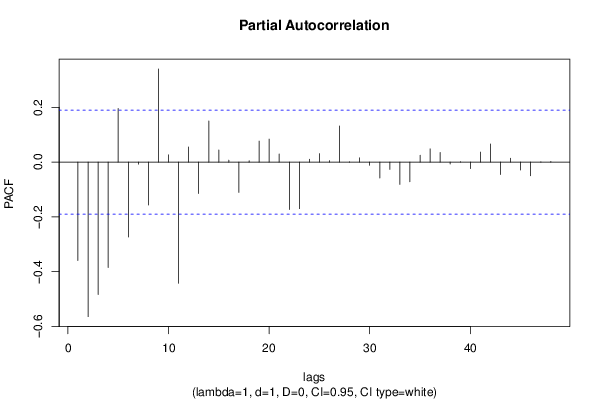
Title produced by software(Partial) Autocorrelation Function
Date of computationFri, 02 Aug 2013 03:27:04 -0400
Cite this page as followsStatistical Computations at FreeStatistics.org, Office for Research Development and Education, URL https://freestatistics.org/blog/index.php?v=date/2013/Aug/02/t1375428456tpo949g03peezk7.htm/, Retrieved Thu, 02 May 2024 23:58:18 +0000
Statistical Computations at FreeStatistics.org, Office for Research Development and Education, URL https://freestatistics.org/blog/index.php?pk=210891, Retrieved Thu, 02 May 2024 23:58:18 +0000
QR Codes:

Original text written by user:
IsPrivate?No (this computation is public)
User-defined keywordsVan Camp Stef
Estimated Impact173
Family? (F = Feedback message, R = changed R code, M = changed R Module, P = changed Parameters, D = changed Data)
-       [(Partial) Autocorrelation Function] [] [2013-08-02 07:27:04] [941d89646656d1688f5e273fb31a8e6b] [Current]
Feedback Forum

Post a new message
Dataseries X:
940
1070
1060
1070
1070
1040
950
1120
1150
1040
1040
1120
1000
960
1060
1060
1110
1030
960
1130
1150
1030
1040
1030
1070
1000
1020
1100
1080
990
1000
1110
1170
1030
1100
1020
1090
990
1060
1120
1030
1050
1030
1130
1140
980
1150
990
1020
1060
1080
1180
980
960
1020
1170
1150
950
1160
1120
1010
1010
1060
1130
1000
1000
1070
1150
1080
980
1210
1020
980
1030
1050
1190
970
950
1070
1170
1050
960
1300
1080
1030
1030
1070
1260
990
950
1080
1190
1050
950
1250
1140
1080
1020
1140
1320
1100
1040
1090
1280
1030
930
1280
1020


Summary of computational transaction
Raw Inputview raw input (R code)
Raw Outputview raw output of R engine
Computing time3 seconds
R Server'Gwilym Jenkins' @ jenkins.wessa.net

\begin{tabular}{lllllllll}
\hline
Summary of computational transaction \tabularnewline
Raw Input & view raw input (R code)  \tabularnewline
Raw Output & view raw output of R engine  \tabularnewline
Computing time & 3 seconds \tabularnewline
R Server & 'Gwilym Jenkins' @ jenkins.wessa.net \tabularnewline
\hline
\end{tabular}
%Source: https://freestatistics.org/blog/index.php?pk=210891&T=0

[TABLE]
[ROW][C]Summary of computational transaction[/C][/ROW]
[ROW][C]Raw Input[/C][C]view raw input (R code) [/C][/ROW]
[ROW][C]Raw Output[/C][C]view raw output of R engine [/C][/ROW]
[ROW][C]Computing time[/C][C]3 seconds[/C][/ROW]
[ROW][C]R Server[/C][C]'Gwilym Jenkins' @ jenkins.wessa.net[/C][/ROW]
[/TABLE]
Source: https://freestatistics.org/blog/index.php?pk=210891&T=0

Globally Unique Identifier (entire table): ba.freestatistics.org/blog/index.php?pk=210891&T=0

As an alternative you can also use a QR Code:  

The GUIDs for individual cells are displayed in the table below:

Summary of computational transaction
Raw Inputview raw input (R code)
Raw Outputview raw output of R engine
Computing time3 seconds
R Server'Gwilym Jenkins' @ jenkins.wessa.net


Autocorrelation Function
Time lag kACF(k)T-STATP-value
1-0.358863-3.71210.000164
2-0.362627-3.7510.000143
30.1187281.22810.111046
40.202472.09440.019294
50.1616251.67190.048736
6-0.528851-5.47050
70.2166022.24050.013561
80.190421.96970.025728
90.0363970.37650.353646
10-0.288992-2.98940.001734
11-0.238571-2.46780.00759
120.7185667.43290
13-0.278109-2.87680.002425
14-0.240806-2.49090.007139
150.0626630.64820.259127
160.1651611.70840.045228
170.1289731.33410.092501
18-0.429149-4.43911.1e-05
190.213592.20940.014639
200.1233091.27550.102444
210.0103260.10680.457567
22-0.239507-2.47750.007398
23-0.135257-1.39910.082336
240.5638945.8330
25-0.276035-2.85530.002582
26-0.165552-1.71250.044852
270.104821.08430.140343
280.0862560.89220.187132
290.0653120.67560.250379
30-0.318632-3.2960.000666
310.2092372.16440.01633
320.093760.96990.167151
33-0.048779-0.50460.307448
34-0.172962-1.78910.038212
35-0.038278-0.39590.346467
360.4006844.14473.4e-05
37-0.263629-2.7270.003735
38-0.103129-1.06680.144238
390.1298641.34330.091005
400.0413390.42760.334895
410.0204970.2120.416246
42-0.225171-2.32920.010864
430.1748641.80880.036644
440.0904010.93510.175918
45-0.092117-0.95290.171402
46-0.143654-1.4860.070114
470.0385650.39890.345374
480.2935913.03690.001501

\begin{tabular}{lllllllll}
\hline
Autocorrelation Function \tabularnewline
Time lag k & ACF(k) & T-STAT & P-value \tabularnewline
1 & -0.358863 & -3.7121 & 0.000164 \tabularnewline
2 & -0.362627 & -3.751 & 0.000143 \tabularnewline
3 & 0.118728 & 1.2281 & 0.111046 \tabularnewline
4 & 0.20247 & 2.0944 & 0.019294 \tabularnewline
5 & 0.161625 & 1.6719 & 0.048736 \tabularnewline
6 & -0.528851 & -5.4705 & 0 \tabularnewline
7 & 0.216602 & 2.2405 & 0.013561 \tabularnewline
8 & 0.19042 & 1.9697 & 0.025728 \tabularnewline
9 & 0.036397 & 0.3765 & 0.353646 \tabularnewline
10 & -0.288992 & -2.9894 & 0.001734 \tabularnewline
11 & -0.238571 & -2.4678 & 0.00759 \tabularnewline
12 & 0.718566 & 7.4329 & 0 \tabularnewline
13 & -0.278109 & -2.8768 & 0.002425 \tabularnewline
14 & -0.240806 & -2.4909 & 0.007139 \tabularnewline
15 & 0.062663 & 0.6482 & 0.259127 \tabularnewline
16 & 0.165161 & 1.7084 & 0.045228 \tabularnewline
17 & 0.128973 & 1.3341 & 0.092501 \tabularnewline
18 & -0.429149 & -4.4391 & 1.1e-05 \tabularnewline
19 & 0.21359 & 2.2094 & 0.014639 \tabularnewline
20 & 0.123309 & 1.2755 & 0.102444 \tabularnewline
21 & 0.010326 & 0.1068 & 0.457567 \tabularnewline
22 & -0.239507 & -2.4775 & 0.007398 \tabularnewline
23 & -0.135257 & -1.3991 & 0.082336 \tabularnewline
24 & 0.563894 & 5.833 & 0 \tabularnewline
25 & -0.276035 & -2.8553 & 0.002582 \tabularnewline
26 & -0.165552 & -1.7125 & 0.044852 \tabularnewline
27 & 0.10482 & 1.0843 & 0.140343 \tabularnewline
28 & 0.086256 & 0.8922 & 0.187132 \tabularnewline
29 & 0.065312 & 0.6756 & 0.250379 \tabularnewline
30 & -0.318632 & -3.296 & 0.000666 \tabularnewline
31 & 0.209237 & 2.1644 & 0.01633 \tabularnewline
32 & 0.09376 & 0.9699 & 0.167151 \tabularnewline
33 & -0.048779 & -0.5046 & 0.307448 \tabularnewline
34 & -0.172962 & -1.7891 & 0.038212 \tabularnewline
35 & -0.038278 & -0.3959 & 0.346467 \tabularnewline
36 & 0.400684 & 4.1447 & 3.4e-05 \tabularnewline
37 & -0.263629 & -2.727 & 0.003735 \tabularnewline
38 & -0.103129 & -1.0668 & 0.144238 \tabularnewline
39 & 0.129864 & 1.3433 & 0.091005 \tabularnewline
40 & 0.041339 & 0.4276 & 0.334895 \tabularnewline
41 & 0.020497 & 0.212 & 0.416246 \tabularnewline
42 & -0.225171 & -2.3292 & 0.010864 \tabularnewline
43 & 0.174864 & 1.8088 & 0.036644 \tabularnewline
44 & 0.090401 & 0.9351 & 0.175918 \tabularnewline
45 & -0.092117 & -0.9529 & 0.171402 \tabularnewline
46 & -0.143654 & -1.486 & 0.070114 \tabularnewline
47 & 0.038565 & 0.3989 & 0.345374 \tabularnewline
48 & 0.293591 & 3.0369 & 0.001501 \tabularnewline
\hline
\end{tabular}
%Source: https://freestatistics.org/blog/index.php?pk=210891&T=1

[TABLE]
[ROW][C]Autocorrelation Function[/C][/ROW]
[ROW][C]Time lag k[/C][C]ACF(k)[/C][C]T-STAT[/C][C]P-value[/C][/ROW]
[ROW][C]1[/C][C]-0.358863[/C][C]-3.7121[/C][C]0.000164[/C][/ROW]
[ROW][C]2[/C][C]-0.362627[/C][C]-3.751[/C][C]0.000143[/C][/ROW]
[ROW][C]3[/C][C]0.118728[/C][C]1.2281[/C][C]0.111046[/C][/ROW]
[ROW][C]4[/C][C]0.20247[/C][C]2.0944[/C][C]0.019294[/C][/ROW]
[ROW][C]5[/C][C]0.161625[/C][C]1.6719[/C][C]0.048736[/C][/ROW]
[ROW][C]6[/C][C]-0.528851[/C][C]-5.4705[/C][C]0[/C][/ROW]
[ROW][C]7[/C][C]0.216602[/C][C]2.2405[/C][C]0.013561[/C][/ROW]
[ROW][C]8[/C][C]0.19042[/C][C]1.9697[/C][C]0.025728[/C][/ROW]
[ROW][C]9[/C][C]0.036397[/C][C]0.3765[/C][C]0.353646[/C][/ROW]
[ROW][C]10[/C][C]-0.288992[/C][C]-2.9894[/C][C]0.001734[/C][/ROW]
[ROW][C]11[/C][C]-0.238571[/C][C]-2.4678[/C][C]0.00759[/C][/ROW]
[ROW][C]12[/C][C]0.718566[/C][C]7.4329[/C][C]0[/C][/ROW]
[ROW][C]13[/C][C]-0.278109[/C][C]-2.8768[/C][C]0.002425[/C][/ROW]
[ROW][C]14[/C][C]-0.240806[/C][C]-2.4909[/C][C]0.007139[/C][/ROW]
[ROW][C]15[/C][C]0.062663[/C][C]0.6482[/C][C]0.259127[/C][/ROW]
[ROW][C]16[/C][C]0.165161[/C][C]1.7084[/C][C]0.045228[/C][/ROW]
[ROW][C]17[/C][C]0.128973[/C][C]1.3341[/C][C]0.092501[/C][/ROW]
[ROW][C]18[/C][C]-0.429149[/C][C]-4.4391[/C][C]1.1e-05[/C][/ROW]
[ROW][C]19[/C][C]0.21359[/C][C]2.2094[/C][C]0.014639[/C][/ROW]
[ROW][C]20[/C][C]0.123309[/C][C]1.2755[/C][C]0.102444[/C][/ROW]
[ROW][C]21[/C][C]0.010326[/C][C]0.1068[/C][C]0.457567[/C][/ROW]
[ROW][C]22[/C][C]-0.239507[/C][C]-2.4775[/C][C]0.007398[/C][/ROW]
[ROW][C]23[/C][C]-0.135257[/C][C]-1.3991[/C][C]0.082336[/C][/ROW]
[ROW][C]24[/C][C]0.563894[/C][C]5.833[/C][C]0[/C][/ROW]
[ROW][C]25[/C][C]-0.276035[/C][C]-2.8553[/C][C]0.002582[/C][/ROW]
[ROW][C]26[/C][C]-0.165552[/C][C]-1.7125[/C][C]0.044852[/C][/ROW]
[ROW][C]27[/C][C]0.10482[/C][C]1.0843[/C][C]0.140343[/C][/ROW]
[ROW][C]28[/C][C]0.086256[/C][C]0.8922[/C][C]0.187132[/C][/ROW]
[ROW][C]29[/C][C]0.065312[/C][C]0.6756[/C][C]0.250379[/C][/ROW]
[ROW][C]30[/C][C]-0.318632[/C][C]-3.296[/C][C]0.000666[/C][/ROW]
[ROW][C]31[/C][C]0.209237[/C][C]2.1644[/C][C]0.01633[/C][/ROW]
[ROW][C]32[/C][C]0.09376[/C][C]0.9699[/C][C]0.167151[/C][/ROW]
[ROW][C]33[/C][C]-0.048779[/C][C]-0.5046[/C][C]0.307448[/C][/ROW]
[ROW][C]34[/C][C]-0.172962[/C][C]-1.7891[/C][C]0.038212[/C][/ROW]
[ROW][C]35[/C][C]-0.038278[/C][C]-0.3959[/C][C]0.346467[/C][/ROW]
[ROW][C]36[/C][C]0.400684[/C][C]4.1447[/C][C]3.4e-05[/C][/ROW]
[ROW][C]37[/C][C]-0.263629[/C][C]-2.727[/C][C]0.003735[/C][/ROW]
[ROW][C]38[/C][C]-0.103129[/C][C]-1.0668[/C][C]0.144238[/C][/ROW]
[ROW][C]39[/C][C]0.129864[/C][C]1.3433[/C][C]0.091005[/C][/ROW]
[ROW][C]40[/C][C]0.041339[/C][C]0.4276[/C][C]0.334895[/C][/ROW]
[ROW][C]41[/C][C]0.020497[/C][C]0.212[/C][C]0.416246[/C][/ROW]
[ROW][C]42[/C][C]-0.225171[/C][C]-2.3292[/C][C]0.010864[/C][/ROW]
[ROW][C]43[/C][C]0.174864[/C][C]1.8088[/C][C]0.036644[/C][/ROW]
[ROW][C]44[/C][C]0.090401[/C][C]0.9351[/C][C]0.175918[/C][/ROW]
[ROW][C]45[/C][C]-0.092117[/C][C]-0.9529[/C][C]0.171402[/C][/ROW]
[ROW][C]46[/C][C]-0.143654[/C][C]-1.486[/C][C]0.070114[/C][/ROW]
[ROW][C]47[/C][C]0.038565[/C][C]0.3989[/C][C]0.345374[/C][/ROW]
[ROW][C]48[/C][C]0.293591[/C][C]3.0369[/C][C]0.001501[/C][/ROW]
[/TABLE]
Source: https://freestatistics.org/blog/index.php?pk=210891&T=1

Globally Unique Identifier (entire table): ba.freestatistics.org/blog/index.php?pk=210891&T=1

As an alternative you can also use a QR Code:  

The GUIDs for individual cells are displayed in the table below:

Autocorrelation Function
Time lag kACF(k)T-STATP-value
1-0.358863-3.71210.000164
2-0.362627-3.7510.000143
30.1187281.22810.111046
40.202472.09440.019294
50.1616251.67190.048736
6-0.528851-5.47050
70.2166022.24050.013561
80.190421.96970.025728
90.0363970.37650.353646
10-0.288992-2.98940.001734
11-0.238571-2.46780.00759
120.7185667.43290
13-0.278109-2.87680.002425
14-0.240806-2.49090.007139
150.0626630.64820.259127
160.1651611.70840.045228
170.1289731.33410.092501
18-0.429149-4.43911.1e-05
190.213592.20940.014639
200.1233091.27550.102444
210.0103260.10680.457567
22-0.239507-2.47750.007398
23-0.135257-1.39910.082336
240.5638945.8330
25-0.276035-2.85530.002582
26-0.165552-1.71250.044852
270.104821.08430.140343
280.0862560.89220.187132
290.0653120.67560.250379
30-0.318632-3.2960.000666
310.2092372.16440.01633
320.093760.96990.167151
33-0.048779-0.50460.307448
34-0.172962-1.78910.038212
35-0.038278-0.39590.346467
360.4006844.14473.4e-05
37-0.263629-2.7270.003735
38-0.103129-1.06680.144238
390.1298641.34330.091005
400.0413390.42760.334895
410.0204970.2120.416246
42-0.225171-2.32920.010864
430.1748641.80880.036644
440.0904010.93510.175918
45-0.092117-0.95290.171402
46-0.143654-1.4860.070114
470.0385650.39890.345374
480.2935913.03690.001501


Partial Autocorrelation Function
Time lag kPACF(k)T-STATP-value
1-0.358863-3.71210.000164
2-0.564049-5.83460
3-0.48351-5.00151e-06
4-0.384423-3.97656.4e-05
50.1956412.02370.022745
6-0.273633-2.83050.002776
7-0.007392-0.07650.469597
8-0.156703-1.6210.053986
90.3399943.51690.000321
100.0265140.27430.392206
11-0.442177-4.57396e-06
120.0552190.57120.284534
13-0.114656-1.1860.119122
140.1500531.55220.061789
150.0440870.4560.324643
160.0071190.07360.470716
17-0.110446-1.14250.127907
180.0051660.05340.47874
190.0766980.79340.214659
200.0839830.86870.193471
210.0293640.30370.380956
22-0.173179-1.79140.03803
23-0.169926-1.75770.040827
240.0106140.10980.456389
250.0309470.32010.37475
260.0053140.0550.478135
270.1315121.36040.088287
28-0.000622-0.00640.497441
290.0154950.16030.436479
30-0.011748-0.12150.451754
31-0.058288-0.60290.273914
32-0.026546-0.27460.392079
33-0.08145-0.84250.200685
34-0.07171-0.74180.229924
350.024770.25620.399137
360.0482780.49940.309263
370.0348930.36090.359428
38-0.007161-0.07410.470544
390.0012650.01310.494791
40-0.023723-0.24540.403312
410.0365520.37810.353054
420.0658310.6810.248683
43-0.045453-0.47020.319594
440.0142170.14710.441681
45-0.028944-0.29940.382608
46-0.050093-0.51820.302706
47-0.000492-0.00510.497976
480.0022020.02280.490937

\begin{tabular}{lllllllll}
\hline
Partial Autocorrelation Function \tabularnewline
Time lag k & PACF(k) & T-STAT & P-value \tabularnewline
1 & -0.358863 & -3.7121 & 0.000164 \tabularnewline
2 & -0.564049 & -5.8346 & 0 \tabularnewline
3 & -0.48351 & -5.0015 & 1e-06 \tabularnewline
4 & -0.384423 & -3.9765 & 6.4e-05 \tabularnewline
5 & 0.195641 & 2.0237 & 0.022745 \tabularnewline
6 & -0.273633 & -2.8305 & 0.002776 \tabularnewline
7 & -0.007392 & -0.0765 & 0.469597 \tabularnewline
8 & -0.156703 & -1.621 & 0.053986 \tabularnewline
9 & 0.339994 & 3.5169 & 0.000321 \tabularnewline
10 & 0.026514 & 0.2743 & 0.392206 \tabularnewline
11 & -0.442177 & -4.5739 & 6e-06 \tabularnewline
12 & 0.055219 & 0.5712 & 0.284534 \tabularnewline
13 & -0.114656 & -1.186 & 0.119122 \tabularnewline
14 & 0.150053 & 1.5522 & 0.061789 \tabularnewline
15 & 0.044087 & 0.456 & 0.324643 \tabularnewline
16 & 0.007119 & 0.0736 & 0.470716 \tabularnewline
17 & -0.110446 & -1.1425 & 0.127907 \tabularnewline
18 & 0.005166 & 0.0534 & 0.47874 \tabularnewline
19 & 0.076698 & 0.7934 & 0.214659 \tabularnewline
20 & 0.083983 & 0.8687 & 0.193471 \tabularnewline
21 & 0.029364 & 0.3037 & 0.380956 \tabularnewline
22 & -0.173179 & -1.7914 & 0.03803 \tabularnewline
23 & -0.169926 & -1.7577 & 0.040827 \tabularnewline
24 & 0.010614 & 0.1098 & 0.456389 \tabularnewline
25 & 0.030947 & 0.3201 & 0.37475 \tabularnewline
26 & 0.005314 & 0.055 & 0.478135 \tabularnewline
27 & 0.131512 & 1.3604 & 0.088287 \tabularnewline
28 & -0.000622 & -0.0064 & 0.497441 \tabularnewline
29 & 0.015495 & 0.1603 & 0.436479 \tabularnewline
30 & -0.011748 & -0.1215 & 0.451754 \tabularnewline
31 & -0.058288 & -0.6029 & 0.273914 \tabularnewline
32 & -0.026546 & -0.2746 & 0.392079 \tabularnewline
33 & -0.08145 & -0.8425 & 0.200685 \tabularnewline
34 & -0.07171 & -0.7418 & 0.229924 \tabularnewline
35 & 0.02477 & 0.2562 & 0.399137 \tabularnewline
36 & 0.048278 & 0.4994 & 0.309263 \tabularnewline
37 & 0.034893 & 0.3609 & 0.359428 \tabularnewline
38 & -0.007161 & -0.0741 & 0.470544 \tabularnewline
39 & 0.001265 & 0.0131 & 0.494791 \tabularnewline
40 & -0.023723 & -0.2454 & 0.403312 \tabularnewline
41 & 0.036552 & 0.3781 & 0.353054 \tabularnewline
42 & 0.065831 & 0.681 & 0.248683 \tabularnewline
43 & -0.045453 & -0.4702 & 0.319594 \tabularnewline
44 & 0.014217 & 0.1471 & 0.441681 \tabularnewline
45 & -0.028944 & -0.2994 & 0.382608 \tabularnewline
46 & -0.050093 & -0.5182 & 0.302706 \tabularnewline
47 & -0.000492 & -0.0051 & 0.497976 \tabularnewline
48 & 0.002202 & 0.0228 & 0.490937 \tabularnewline
\hline
\end{tabular}
%Source: https://freestatistics.org/blog/index.php?pk=210891&T=2

[TABLE]
[ROW][C]Partial Autocorrelation Function[/C][/ROW]
[ROW][C]Time lag k[/C][C]PACF(k)[/C][C]T-STAT[/C][C]P-value[/C][/ROW]
[ROW][C]1[/C][C]-0.358863[/C][C]-3.7121[/C][C]0.000164[/C][/ROW]
[ROW][C]2[/C][C]-0.564049[/C][C]-5.8346[/C][C]0[/C][/ROW]
[ROW][C]3[/C][C]-0.48351[/C][C]-5.0015[/C][C]1e-06[/C][/ROW]
[ROW][C]4[/C][C]-0.384423[/C][C]-3.9765[/C][C]6.4e-05[/C][/ROW]
[ROW][C]5[/C][C]0.195641[/C][C]2.0237[/C][C]0.022745[/C][/ROW]
[ROW][C]6[/C][C]-0.273633[/C][C]-2.8305[/C][C]0.002776[/C][/ROW]
[ROW][C]7[/C][C]-0.007392[/C][C]-0.0765[/C][C]0.469597[/C][/ROW]
[ROW][C]8[/C][C]-0.156703[/C][C]-1.621[/C][C]0.053986[/C][/ROW]
[ROW][C]9[/C][C]0.339994[/C][C]3.5169[/C][C]0.000321[/C][/ROW]
[ROW][C]10[/C][C]0.026514[/C][C]0.2743[/C][C]0.392206[/C][/ROW]
[ROW][C]11[/C][C]-0.442177[/C][C]-4.5739[/C][C]6e-06[/C][/ROW]
[ROW][C]12[/C][C]0.055219[/C][C]0.5712[/C][C]0.284534[/C][/ROW]
[ROW][C]13[/C][C]-0.114656[/C][C]-1.186[/C][C]0.119122[/C][/ROW]
[ROW][C]14[/C][C]0.150053[/C][C]1.5522[/C][C]0.061789[/C][/ROW]
[ROW][C]15[/C][C]0.044087[/C][C]0.456[/C][C]0.324643[/C][/ROW]
[ROW][C]16[/C][C]0.007119[/C][C]0.0736[/C][C]0.470716[/C][/ROW]
[ROW][C]17[/C][C]-0.110446[/C][C]-1.1425[/C][C]0.127907[/C][/ROW]
[ROW][C]18[/C][C]0.005166[/C][C]0.0534[/C][C]0.47874[/C][/ROW]
[ROW][C]19[/C][C]0.076698[/C][C]0.7934[/C][C]0.214659[/C][/ROW]
[ROW][C]20[/C][C]0.083983[/C][C]0.8687[/C][C]0.193471[/C][/ROW]
[ROW][C]21[/C][C]0.029364[/C][C]0.3037[/C][C]0.380956[/C][/ROW]
[ROW][C]22[/C][C]-0.173179[/C][C]-1.7914[/C][C]0.03803[/C][/ROW]
[ROW][C]23[/C][C]-0.169926[/C][C]-1.7577[/C][C]0.040827[/C][/ROW]
[ROW][C]24[/C][C]0.010614[/C][C]0.1098[/C][C]0.456389[/C][/ROW]
[ROW][C]25[/C][C]0.030947[/C][C]0.3201[/C][C]0.37475[/C][/ROW]
[ROW][C]26[/C][C]0.005314[/C][C]0.055[/C][C]0.478135[/C][/ROW]
[ROW][C]27[/C][C]0.131512[/C][C]1.3604[/C][C]0.088287[/C][/ROW]
[ROW][C]28[/C][C]-0.000622[/C][C]-0.0064[/C][C]0.497441[/C][/ROW]
[ROW][C]29[/C][C]0.015495[/C][C]0.1603[/C][C]0.436479[/C][/ROW]
[ROW][C]30[/C][C]-0.011748[/C][C]-0.1215[/C][C]0.451754[/C][/ROW]
[ROW][C]31[/C][C]-0.058288[/C][C]-0.6029[/C][C]0.273914[/C][/ROW]
[ROW][C]32[/C][C]-0.026546[/C][C]-0.2746[/C][C]0.392079[/C][/ROW]
[ROW][C]33[/C][C]-0.08145[/C][C]-0.8425[/C][C]0.200685[/C][/ROW]
[ROW][C]34[/C][C]-0.07171[/C][C]-0.7418[/C][C]0.229924[/C][/ROW]
[ROW][C]35[/C][C]0.02477[/C][C]0.2562[/C][C]0.399137[/C][/ROW]
[ROW][C]36[/C][C]0.048278[/C][C]0.4994[/C][C]0.309263[/C][/ROW]
[ROW][C]37[/C][C]0.034893[/C][C]0.3609[/C][C]0.359428[/C][/ROW]
[ROW][C]38[/C][C]-0.007161[/C][C]-0.0741[/C][C]0.470544[/C][/ROW]
[ROW][C]39[/C][C]0.001265[/C][C]0.0131[/C][C]0.494791[/C][/ROW]
[ROW][C]40[/C][C]-0.023723[/C][C]-0.2454[/C][C]0.403312[/C][/ROW]
[ROW][C]41[/C][C]0.036552[/C][C]0.3781[/C][C]0.353054[/C][/ROW]
[ROW][C]42[/C][C]0.065831[/C][C]0.681[/C][C]0.248683[/C][/ROW]
[ROW][C]43[/C][C]-0.045453[/C][C]-0.4702[/C][C]0.319594[/C][/ROW]
[ROW][C]44[/C][C]0.014217[/C][C]0.1471[/C][C]0.441681[/C][/ROW]
[ROW][C]45[/C][C]-0.028944[/C][C]-0.2994[/C][C]0.382608[/C][/ROW]
[ROW][C]46[/C][C]-0.050093[/C][C]-0.5182[/C][C]0.302706[/C][/ROW]
[ROW][C]47[/C][C]-0.000492[/C][C]-0.0051[/C][C]0.497976[/C][/ROW]
[ROW][C]48[/C][C]0.002202[/C][C]0.0228[/C][C]0.490937[/C][/ROW]
[/TABLE]
Source: https://freestatistics.org/blog/index.php?pk=210891&T=2

Globally Unique Identifier (entire table): ba.freestatistics.org/blog/index.php?pk=210891&T=2

As an alternative you can also use a QR Code:  

The GUIDs for individual cells are displayed in the table below:

Partial Autocorrelation Function
Time lag kPACF(k)T-STATP-value
1-0.358863-3.71210.000164
2-0.564049-5.83460
3-0.48351-5.00151e-06
4-0.384423-3.97656.4e-05
50.1956412.02370.022745
6-0.273633-2.83050.002776
7-0.007392-0.07650.469597
8-0.156703-1.6210.053986
90.3399943.51690.000321
100.0265140.27430.392206
11-0.442177-4.57396e-06
120.0552190.57120.284534
13-0.114656-1.1860.119122
140.1500531.55220.061789
150.0440870.4560.324643
160.0071190.07360.470716
17-0.110446-1.14250.127907
180.0051660.05340.47874
190.0766980.79340.214659
200.0839830.86870.193471
210.0293640.30370.380956
22-0.173179-1.79140.03803
23-0.169926-1.75770.040827
240.0106140.10980.456389
250.0309470.32010.37475
260.0053140.0550.478135
270.1315121.36040.088287
28-0.000622-0.00640.497441
290.0154950.16030.436479
30-0.011748-0.12150.451754
31-0.058288-0.60290.273914
32-0.026546-0.27460.392079
33-0.08145-0.84250.200685
34-0.07171-0.74180.229924
350.024770.25620.399137
360.0482780.49940.309263
370.0348930.36090.359428
38-0.007161-0.07410.470544
390.0012650.01310.494791
40-0.023723-0.24540.403312
410.0365520.37810.353054
420.0658310.6810.248683
43-0.045453-0.47020.319594
440.0142170.14710.441681
45-0.028944-0.29940.382608
46-0.050093-0.51820.302706
47-0.000492-0.00510.497976
480.0022020.02280.490937


Parameters (Session):
par1 = 48 ; par2 = 1 ; par3 = 1 ; par4 = 0 ; par5 = 12 ; par6 = White Noise ; par7 = 0.95 ;
Parameters (R input):
par1 = 48 ; par2 = 1 ; par3 = 1 ; par4 = 0 ; par5 = 12 ; par6 = White Noise ; par7 = 0.95 ; par8 = ;
R code (references can be found in the software module):
if (par1 == 'Default') {
par1 = 10*log10(length(x))
} else {
par1 <- as.numeric(par1)
}
par2 <- as.numeric(par2)
par3 <- as.numeric(par3)
par4 <- as.numeric(par4)
par5 <- as.numeric(par5)
if (par6 == 'White Noise') par6 <- 'white' else par6 <- 'ma'
par7 <- as.numeric(par7)
if (par8 != '') par8 <- as.numeric(par8)
ox <- x
if (par8 == '') {
if (par2 == 0) {
x <- log(x)
} else {
x <- (x ^ par2 - 1) / par2
}
} else {
x <- log(x,base=par8)
}
if (par3 > 0) x <- diff(x,lag=1,difference=par3)
if (par4 > 0) x <- diff(x,lag=par5,difference=par4)
bitmap(file='picts.png')
op <- par(mfrow=c(2,1))
plot(ox,type='l',main='Original Time Series',xlab='time',ylab='value')
if (par8=='') {
mytitle <- paste('Working Time Series (lambda=',par2,', d=',par3,', D=',par4,')',sep='')
mysub <- paste('(lambda=',par2,', d=',par3,', D=',par4,', CI=', par7, ', CI type=',par6,')',sep='')
} else {
mytitle <- paste('Working Time Series (base=',par8,', d=',par3,', D=',par4,')',sep='')
mysub <- paste('(base=',par8,', d=',par3,', D=',par4,', CI=', par7, ', CI type=',par6,')',sep='')
}
plot(x,type='l', main=mytitle,xlab='time',ylab='value')
par(op)
dev.off()
bitmap(file='pic1.png')
racf <- acf(x, par1, main='Autocorrelation', xlab='time lag', ylab='ACF', ci.type=par6, ci=par7, sub=mysub)
dev.off()
bitmap(file='pic2.png')
rpacf <- pacf(x,par1,main='Partial Autocorrelation',xlab='lags',ylab='PACF',sub=mysub)
dev.off()
(myacf <- c(racf$acf))
(mypacf <- c(rpacf$acf))
lengthx <- length(x)
sqrtn <- sqrt(lengthx)
load(file='createtable')
a<-table.start()
a<-table.row.start(a)
a<-table.element(a,'Autocorrelation Function',4,TRUE)
a<-table.row.end(a)
a<-table.row.start(a)
a<-table.element(a,'Time lag k',header=TRUE)
a<-table.element(a,hyperlink('basics.htm','ACF(k)','click here for more information about the Autocorrelation Function'),header=TRUE)
a<-table.element(a,'T-STAT',header=TRUE)
a<-table.element(a,'P-value',header=TRUE)
a<-table.row.end(a)
for (i in 2:(par1+1)) {
a<-table.row.start(a)
a<-table.element(a,i-1,header=TRUE)
a<-table.element(a,round(myacf[i],6))
mytstat <- myacf[i]*sqrtn
a<-table.element(a,round(mytstat,4))
a<-table.element(a,round(1-pt(abs(mytstat),lengthx),6))
a<-table.row.end(a)
}
a<-table.end(a)
table.save(a,file='mytable.tab')
a<-table.start()
a<-table.row.start(a)
a<-table.element(a,'Partial Autocorrelation Function',4,TRUE)
a<-table.row.end(a)
a<-table.row.start(a)
a<-table.element(a,'Time lag k',header=TRUE)
a<-table.element(a,hyperlink('basics.htm','PACF(k)','click here for more information about the Partial Autocorrelation Function'),header=TRUE)
a<-table.element(a,'T-STAT',header=TRUE)
a<-table.element(a,'P-value',header=TRUE)
a<-table.row.end(a)
for (i in 1:par1) {
a<-table.row.start(a)
a<-table.element(a,i,header=TRUE)
a<-table.element(a,round(mypacf[i],6))
mytstat <- mypacf[i]*sqrtn
a<-table.element(a,round(mytstat,4))
a<-table.element(a,round(1-pt(abs(mytstat),lengthx),6))
a<-table.row.end(a)
}
a<-table.end(a)
table.save(a,file='mytable1.tab')