Free Statistics

of Irreproducible Research!

Author's title

Author*The author of this computation has been verified*
R Software Modulerwasp_smp.wasp
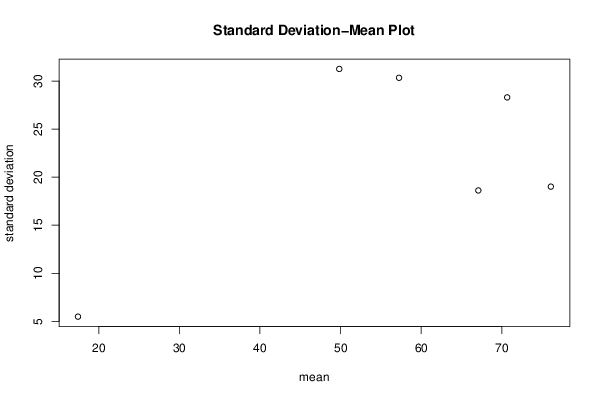
Title produced by softwareStandard Deviation-Mean Plot
Date of computationWed, 28 Nov 2012 13:20:49 -0500
Cite this page as followsStatistical Computations at FreeStatistics.org, Office for Research Development and Education, URL https://freestatistics.org/blog/index.php?v=date/2012/Nov/28/t1354126880su81j6i7rh4uf5n.htm/, Retrieved Fri, 19 Apr 2024 04:40:27 +0000
Statistical Computations at FreeStatistics.org, Office for Research Development and Education, URL https://freestatistics.org/blog/index.php?pk=194205, Retrieved Fri, 19 Apr 2024 04:40:27 +0000
QR Codes:

Original text written by user:
IsPrivate?No (this computation is public)
User-defined keywords
Estimated Impact98
Family? (F = Feedback message, R = changed R code, M = changed R Module, P = changed Parameters, D = changed Data)
-     [Univariate Explorative Data Analysis] [Monthly US soldie...] [2010-11-02 12:07:39] [b98453cac15ba1066b407e146608df68]
- RMPD  [Multiple Regression] [Soldiers] [2010-11-30 14:13:36] [b98453cac15ba1066b407e146608df68]
- RM D      [Standard Deviation-Mean Plot] [Stat Dev - Mean Plot] [2012-11-28 18:20:49] [4c917d823355d00d361b7013e9f37760] [Current]
Feedback Forum

Post a new message
Dataseries X:
37
30
47
35
30
43
82
40
47
19
52
136
80
42
54
66
81
63
137
72
107
58
36
52
79
77
54
84
48
96
83
66
61
53
30
74
69
59
42
65
70
100
63
105
82
81
75
102
121
98
76
77
63
37
35
23
40
29
37
51
20
28
13
22
25
13
16
13
16
17
9
17
25
14
8
7
10
7
10
3


Summary of computational transaction
Raw Inputview raw input (R code)
Raw Outputview raw output of R engine
Computing time3 seconds
R Server'Sir Maurice George Kendall' @ kendall.wessa.net

\begin{tabular}{lllllllll}
\hline
Summary of computational transaction \tabularnewline
Raw Input & view raw input (R code)  \tabularnewline
Raw Output & view raw output of R engine  \tabularnewline
Computing time & 3 seconds \tabularnewline
R Server & 'Sir Maurice George Kendall' @ kendall.wessa.net \tabularnewline
\hline
\end{tabular}
%Source: https://freestatistics.org/blog/index.php?pk=194205&T=0

[TABLE]
[ROW][C]Summary of computational transaction[/C][/ROW]
[ROW][C]Raw Input[/C][C]view raw input (R code) [/C][/ROW]
[ROW][C]Raw Output[/C][C]view raw output of R engine [/C][/ROW]
[ROW][C]Computing time[/C][C]3 seconds[/C][/ROW]
[ROW][C]R Server[/C][C]'Sir Maurice George Kendall' @ kendall.wessa.net[/C][/ROW]
[/TABLE]
Source: https://freestatistics.org/blog/index.php?pk=194205&T=0

Globally Unique Identifier (entire table): ba.freestatistics.org/blog/index.php?pk=194205&T=0

As an alternative you can also use a QR Code:  

The GUIDs for individual cells are displayed in the table below:

Summary of computational transaction
Raw Inputview raw input (R code)
Raw Outputview raw output of R engine
Computing time3 seconds
R Server'Sir Maurice George Kendall' @ kendall.wessa.net


Standard Deviation-Mean Plot
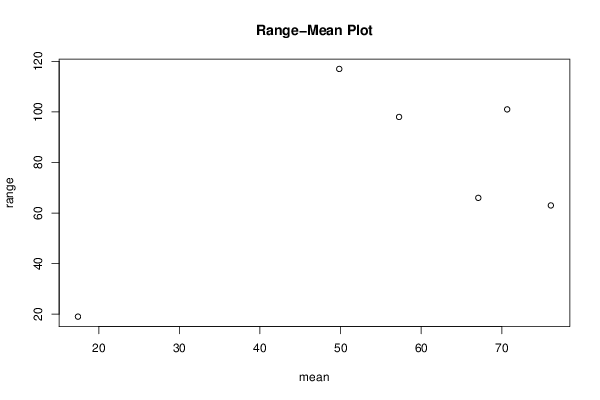
SectionMeanStandard DeviationRange
149.833333333333331.2550601963712117
270.666666666666728.2949829582218101
367.083333333333318.613085979948966
476.083333333333319.009367706635163
557.2530.334873420776798
617.41666666666675.4848275573014419

\begin{tabular}{lllllllll}
\hline
Standard Deviation-Mean Plot \tabularnewline
Section & Mean & Standard Deviation & Range \tabularnewline
1 & 49.8333333333333 & 31.2550601963712 & 117 \tabularnewline
2 & 70.6666666666667 & 28.2949829582218 & 101 \tabularnewline
3 & 67.0833333333333 & 18.6130859799489 & 66 \tabularnewline
4 & 76.0833333333333 & 19.0093677066351 & 63 \tabularnewline
5 & 57.25 & 30.3348734207767 & 98 \tabularnewline
6 & 17.4166666666667 & 5.48482755730144 & 19 \tabularnewline
\hline
\end{tabular}
%Source: https://freestatistics.org/blog/index.php?pk=194205&T=1

[TABLE]
[ROW][C]Standard Deviation-Mean Plot[/C][/ROW]
[ROW][C]Section[/C][C]Mean[/C][C]Standard Deviation[/C][C]Range[/C][/ROW]
[ROW][C]1[/C][C]49.8333333333333[/C][C]31.2550601963712[/C][C]117[/C][/ROW]
[ROW][C]2[/C][C]70.6666666666667[/C][C]28.2949829582218[/C][C]101[/C][/ROW]
[ROW][C]3[/C][C]67.0833333333333[/C][C]18.6130859799489[/C][C]66[/C][/ROW]
[ROW][C]4[/C][C]76.0833333333333[/C][C]19.0093677066351[/C][C]63[/C][/ROW]
[ROW][C]5[/C][C]57.25[/C][C]30.3348734207767[/C][C]98[/C][/ROW]
[ROW][C]6[/C][C]17.4166666666667[/C][C]5.48482755730144[/C][C]19[/C][/ROW]
[/TABLE]
Source: https://freestatistics.org/blog/index.php?pk=194205&T=1

Globally Unique Identifier (entire table): ba.freestatistics.org/blog/index.php?pk=194205&T=1

As an alternative you can also use a QR Code:  

The GUIDs for individual cells are displayed in the table below:

Standard Deviation-Mean Plot
SectionMeanStandard DeviationRange
149.833333333333331.2550601963712117
270.666666666666728.2949829582218101
367.083333333333318.613085979948966
476.083333333333319.009367706635163
557.2530.334873420776798
617.41666666666675.4848275573014419


Regression: S.E.(k) = alpha + beta * Mean(k)
alpha7.62734060098987
beta0.257817204571377
S.D.0.192696886862756
T-STAT1.33794172167919
p-value0.251913511181569

\begin{tabular}{lllllllll}
\hline
Regression: S.E.(k) = alpha + beta * Mean(k) \tabularnewline
alpha & 7.62734060098987 \tabularnewline
beta & 0.257817204571377 \tabularnewline
S.D. & 0.192696886862756 \tabularnewline
T-STAT & 1.33794172167919 \tabularnewline
p-value & 0.251913511181569 \tabularnewline
\hline
\end{tabular}
%Source: https://freestatistics.org/blog/index.php?pk=194205&T=2

[TABLE]
[ROW][C]Regression: S.E.(k) = alpha + beta * Mean(k)[/C][/ROW]
[ROW][C]alpha[/C][C]7.62734060098987[/C][/ROW]
[ROW][C]beta[/C][C]0.257817204571377[/C][/ROW]
[ROW][C]S.D.[/C][C]0.192696886862756[/C][/ROW]
[ROW][C]T-STAT[/C][C]1.33794172167919[/C][/ROW]
[ROW][C]p-value[/C][C]0.251913511181569[/C][/ROW]
[/TABLE]
Source: https://freestatistics.org/blog/index.php?pk=194205&T=2

Globally Unique Identifier (entire table): ba.freestatistics.org/blog/index.php?pk=194205&T=2

As an alternative you can also use a QR Code:  

The GUIDs for individual cells are displayed in the table below:

Regression: S.E.(k) = alpha + beta * Mean(k)
alpha7.62734060098987
beta0.257817204571377
S.D.0.192696886862756
T-STAT1.33794172167919
p-value0.251913511181569


Regression: ln S.E.(k) = alpha + beta * ln Mean(k)
alpha-0.952456878721544
beta0.994638095085675
S.D.0.334109924590222
T-STAT2.97697859860217
p-value0.0408608743220423
Lambda0.00536190491432453

\begin{tabular}{lllllllll}
\hline
Regression: ln S.E.(k) = alpha + beta * ln Mean(k) \tabularnewline
alpha & -0.952456878721544 \tabularnewline
beta & 0.994638095085675 \tabularnewline
S.D. & 0.334109924590222 \tabularnewline
T-STAT & 2.97697859860217 \tabularnewline
p-value & 0.0408608743220423 \tabularnewline
Lambda & 0.00536190491432453 \tabularnewline
\hline
\end{tabular}
%Source: https://freestatistics.org/blog/index.php?pk=194205&T=3

[TABLE]
[ROW][C]Regression: ln S.E.(k) = alpha + beta * ln Mean(k)[/C][/ROW]
[ROW][C]alpha[/C][C]-0.952456878721544[/C][/ROW]
[ROW][C]beta[/C][C]0.994638095085675[/C][/ROW]
[ROW][C]S.D.[/C][C]0.334109924590222[/C][/ROW]
[ROW][C]T-STAT[/C][C]2.97697859860217[/C][/ROW]
[ROW][C]p-value[/C][C]0.0408608743220423[/C][/ROW]
[ROW][C]Lambda[/C][C]0.00536190491432453[/C][/ROW]
[/TABLE]
Source: https://freestatistics.org/blog/index.php?pk=194205&T=3

Globally Unique Identifier (entire table): ba.freestatistics.org/blog/index.php?pk=194205&T=3

As an alternative you can also use a QR Code:  

The GUIDs for individual cells are displayed in the table below:

Regression: ln S.E.(k) = alpha + beta * ln Mean(k)
alpha-0.952456878721544
beta0.994638095085675
S.D.0.334109924590222
T-STAT2.97697859860217
p-value0.0408608743220423
Lambda0.00536190491432453


Parameters (Session):
par1 = 12 ;
Parameters (R input):
par1 = 12 ;
R code (references can be found in the software module):
par1 <- as.numeric(par1)
(n <- length(x))
(np <- floor(n / par1))
arr <- array(NA,dim=c(par1,np))
j <- 0
k <- 1
for (i in 1:(np*par1))
{
j = j + 1
arr[j,k] <- x[i]
if (j == par1) {
j = 0
k=k+1
}
}
arr
arr.mean <- array(NA,dim=np)
arr.sd <- array(NA,dim=np)
arr.range <- array(NA,dim=np)
for (j in 1:np)
{
arr.mean[j] <- mean(arr[,j],na.rm=TRUE)
arr.sd[j] <- sd(arr[,j],na.rm=TRUE)
arr.range[j] <- max(arr[,j],na.rm=TRUE) - min(arr[,j],na.rm=TRUE)
}
arr.mean
arr.sd
arr.range
(lm1 <- lm(arr.sd~arr.mean))
(lnlm1 <- lm(log(arr.sd)~log(arr.mean)))
(lm2 <- lm(arr.range~arr.mean))
bitmap(file='test1.png')
plot(arr.mean,arr.sd,main='Standard Deviation-Mean Plot',xlab='mean',ylab='standard deviation')
dev.off()
bitmap(file='test2.png')
plot(arr.mean,arr.range,main='Range-Mean Plot',xlab='mean',ylab='range')
dev.off()
load(file='createtable')
a<-table.start()
a<-table.row.start(a)
a<-table.element(a,'Standard Deviation-Mean Plot',4,TRUE)
a<-table.row.end(a)
a<-table.row.start(a)
a<-table.element(a,'Section',header=TRUE)
a<-table.element(a,'Mean',header=TRUE)
a<-table.element(a,'Standard Deviation',header=TRUE)
a<-table.element(a,'Range',header=TRUE)
a<-table.row.end(a)
for (j in 1:np) {
a<-table.row.start(a)
a<-table.element(a,j,header=TRUE)
a<-table.element(a,arr.mean[j])
a<-table.element(a,arr.sd[j] )
a<-table.element(a,arr.range[j] )
a<-table.row.end(a)
}
a<-table.end(a)
table.save(a,file='mytable.tab')
a<-table.start()
a<-table.row.start(a)
a<-table.element(a,'Regression: S.E.(k) = alpha + beta * Mean(k)',2,TRUE)
a<-table.row.end(a)
a<-table.row.start(a)
a<-table.element(a,'alpha',header=TRUE)
a<-table.element(a,lm1$coefficients[[1]])
a<-table.row.end(a)
a<-table.row.start(a)
a<-table.element(a,'beta',header=TRUE)
a<-table.element(a,lm1$coefficients[[2]])
a<-table.row.end(a)
a<-table.row.start(a)
a<-table.element(a,'S.D.',header=TRUE)
a<-table.element(a,summary(lm1)$coefficients[2,2])
a<-table.row.end(a)
a<-table.row.start(a)
a<-table.element(a,'T-STAT',header=TRUE)
a<-table.element(a,summary(lm1)$coefficients[2,3])
a<-table.row.end(a)
a<-table.row.start(a)
a<-table.element(a,'p-value',header=TRUE)
a<-table.element(a,summary(lm1)$coefficients[2,4])
a<-table.row.end(a)
a<-table.end(a)
table.save(a,file='mytable1.tab')
a<-table.start()
a<-table.row.start(a)
a<-table.element(a,'Regression: ln S.E.(k) = alpha + beta * ln Mean(k)',2,TRUE)
a<-table.row.end(a)
a<-table.row.start(a)
a<-table.element(a,'alpha',header=TRUE)
a<-table.element(a,lnlm1$coefficients[[1]])
a<-table.row.end(a)
a<-table.row.start(a)
a<-table.element(a,'beta',header=TRUE)
a<-table.element(a,lnlm1$coefficients[[2]])
a<-table.row.end(a)
a<-table.row.start(a)
a<-table.element(a,'S.D.',header=TRUE)
a<-table.element(a,summary(lnlm1)$coefficients[2,2])
a<-table.row.end(a)
a<-table.row.start(a)
a<-table.element(a,'T-STAT',header=TRUE)
a<-table.element(a,summary(lnlm1)$coefficients[2,3])
a<-table.row.end(a)
a<-table.row.start(a)
a<-table.element(a,'p-value',header=TRUE)
a<-table.element(a,summary(lnlm1)$coefficients[2,4])
a<-table.row.end(a)
a<-table.row.start(a)
a<-table.element(a,'Lambda',header=TRUE)
a<-table.element(a,1-lnlm1$coefficients[[2]])
a<-table.row.end(a)
a<-table.end(a)
table.save(a,file='mytable2.tab')