Free Statistics

of Irreproducible Research!

Author's title

Author*The author of this computation has been verified*
R Software Modulerwasp_multipleregression.wasp
Title produced by softwareMultiple Regression
Date of computationWed, 28 Nov 2012 12:15:10 -0500
Cite this page as followsStatistical Computations at FreeStatistics.org, Office for Research Development and Education, URL https://freestatistics.org/blog/index.php?v=date/2012/Nov/28/t1354122961uplik0u95j7cugm.htm/, Retrieved Tue, 16 Apr 2024 15:45:20 +0000
Statistical Computations at FreeStatistics.org, Office for Research Development and Education, URL https://freestatistics.org/blog/index.php?pk=194195, Retrieved Tue, 16 Apr 2024 15:45:20 +0000
QR Codes:

Original text written by user:
IsPrivate?No (this computation is public)
User-defined keywords
Estimated Impact60
Family? (F = Feedback message, R = changed R code, M = changed R Module, P = changed Parameters, D = changed Data)
-       [Multiple Regression] [MR - Time series] [2012-11-28 17:15:10] [64435dfec13c3cda39d1733fd4b6eb52] [Current]
Feedback Forum

Post a new message
Dataseries X:
54.3
55.9
63.9
64
60.7
67.8
70.5
76.6
76.2
71.8
67.8
69.7
76.7
74.2
75.8
84.3
84.9
84.4
89.4
88.5
76.5
71.4
72.1
75.8
66.6
71.7
75.4
80.9
80.7
85
91.5
87.7
95.3
102.4
114.2
111.7
113.7
118.8
129
136.4
155
166
168.7
145.5
127.3
91.5
69
54
56.3
54.2
59.3
63.4
73.3
86.7
81.3
89.6
85.3
92.4
96.8
93.6
97.6
94.2
99.9
106.4
96
94.9
94.8
95.9
96.2
103.1
106.9
114.2
118.2
123.9
137.1
146.2
136.4
133.2
135.9
127.1
128.5
126.6
132.6
130.9


Summary of computational transaction
Raw Inputview raw input (R code)
Raw Outputview raw output of R engine
Computing time9 seconds
R Server'Sir Ronald Aylmer Fisher' @ fisher.wessa.net

\begin{tabular}{lllllllll}
\hline
Summary of computational transaction \tabularnewline
Raw Input & view raw input (R code)  \tabularnewline
Raw Output & view raw output of R engine  \tabularnewline
Computing time & 9 seconds \tabularnewline
R Server & 'Sir Ronald Aylmer Fisher' @ fisher.wessa.net \tabularnewline
\hline
\end{tabular}
%Source: https://freestatistics.org/blog/index.php?pk=194195&T=0

[TABLE]
[ROW][C]Summary of computational transaction[/C][/ROW]
[ROW][C]Raw Input[/C][C]view raw input (R code) [/C][/ROW]
[ROW][C]Raw Output[/C][C]view raw output of R engine [/C][/ROW]
[ROW][C]Computing time[/C][C]9 seconds[/C][/ROW]
[ROW][C]R Server[/C][C]'Sir Ronald Aylmer Fisher' @ fisher.wessa.net[/C][/ROW]
[/TABLE]
Source: https://freestatistics.org/blog/index.php?pk=194195&T=0

Globally Unique Identifier (entire table): ba.freestatistics.org/blog/index.php?pk=194195&T=0

As an alternative you can also use a QR Code:  

The GUIDs for individual cells are displayed in the table below:

Summary of computational transaction
Raw Inputview raw input (R code)
Raw Outputview raw output of R engine
Computing time9 seconds
R Server'Sir Ronald Aylmer Fisher' @ fisher.wessa.net


Multiple Linear Regression - Estimated Regression Equation
Grondstoffen[t] = + 60.7773809523809 -2.15166170634922M1[t] -1.4625496031746M2[t] + 4.65513392857143M3[t] + 9.87281746031746M4[t] + 9.97621527777778M5[t] + 13.736755952381M6[t] + 15.0830109126984M7[t] + 11.3864087301587M8[t] + 7.06123511904762M9[t] + 2.66463293650794M10[t] + 2.02517361111111M11[t] + 0.668030753968254t + e[t]

\begin{tabular}{lllllllll}
\hline
Multiple Linear Regression - Estimated Regression Equation \tabularnewline
Grondstoffen[t] =  +  60.7773809523809 -2.15166170634922M1[t] -1.4625496031746M2[t] +  4.65513392857143M3[t] +  9.87281746031746M4[t] +  9.97621527777778M5[t] +  13.736755952381M6[t] +  15.0830109126984M7[t] +  11.3864087301587M8[t] +  7.06123511904762M9[t] +  2.66463293650794M10[t] +  2.02517361111111M11[t] +  0.668030753968254t  + e[t] \tabularnewline
\hline
\end{tabular}
%Source: https://freestatistics.org/blog/index.php?pk=194195&T=1

[TABLE]
[ROW][C]Multiple Linear Regression - Estimated Regression Equation[/C][/ROW]
[ROW][C]Grondstoffen[t] =  +  60.7773809523809 -2.15166170634922M1[t] -1.4625496031746M2[t] +  4.65513392857143M3[t] +  9.87281746031746M4[t] +  9.97621527777778M5[t] +  13.736755952381M6[t] +  15.0830109126984M7[t] +  11.3864087301587M8[t] +  7.06123511904762M9[t] +  2.66463293650794M10[t] +  2.02517361111111M11[t] +  0.668030753968254t  + e[t][/C][/ROW]
[/TABLE]
Source: https://freestatistics.org/blog/index.php?pk=194195&T=1

Globally Unique Identifier (entire table): ba.freestatistics.org/blog/index.php?pk=194195&T=1

As an alternative you can also use a QR Code:  

The GUIDs for individual cells are displayed in the table below:

Multiple Linear Regression - Estimated Regression Equation
Grondstoffen[t] = + 60.7773809523809 -2.15166170634922M1[t] -1.4625496031746M2[t] + 4.65513392857143M3[t] + 9.87281746031746M4[t] + 9.97621527777778M5[t] + 13.736755952381M6[t] + 15.0830109126984M7[t] + 11.3864087301587M8[t] + 7.06123511904762M9[t] + 2.66463293650794M10[t] + 2.02517361111111M11[t] + 0.668030753968254t + e[t]


Multiple Linear Regression - Ordinary Least Squares
VariableParameterS.D.T-STATH0: parameter = 02-tail p-value1-tail p-value
(Intercept)60.777380952380910.2256455.943600
M1-2.1516617063492212.578496-0.17110.8646640.432332
M2-1.462549603174612.569021-0.11640.9076950.453847
M34.6551339285714312.5604430.37060.7120250.356013
M49.8728174603174612.5527620.78650.4341890.217094
M59.9762152777777812.5459820.79520.4291640.214582
M613.73675595238112.5401021.09540.2770320.138516
M715.083010912698412.5351251.20330.2328730.116436
M811.386408730158712.5310510.90870.3666060.183303
M97.0612351190476212.5278820.56360.5747740.287387
M102.6646329365079412.5256170.21270.8321440.416072
M112.0251736111111112.5242590.16170.8720010.436001
t0.6680307539682540.1065176.271600

\begin{tabular}{lllllllll}
\hline
Multiple Linear Regression - Ordinary Least Squares \tabularnewline
Variable & Parameter & S.D. & T-STATH0: parameter = 0 & 2-tail p-value & 1-tail p-value \tabularnewline
(Intercept) & 60.7773809523809 & 10.225645 & 5.9436 & 0 & 0 \tabularnewline
M1 & -2.15166170634922 & 12.578496 & -0.1711 & 0.864664 & 0.432332 \tabularnewline
M2 & -1.4625496031746 & 12.569021 & -0.1164 & 0.907695 & 0.453847 \tabularnewline
M3 & 4.65513392857143 & 12.560443 & 0.3706 & 0.712025 & 0.356013 \tabularnewline
M4 & 9.87281746031746 & 12.552762 & 0.7865 & 0.434189 & 0.217094 \tabularnewline
M5 & 9.97621527777778 & 12.545982 & 0.7952 & 0.429164 & 0.214582 \tabularnewline
M6 & 13.736755952381 & 12.540102 & 1.0954 & 0.277032 & 0.138516 \tabularnewline
M7 & 15.0830109126984 & 12.535125 & 1.2033 & 0.232873 & 0.116436 \tabularnewline
M8 & 11.3864087301587 & 12.531051 & 0.9087 & 0.366606 & 0.183303 \tabularnewline
M9 & 7.06123511904762 & 12.527882 & 0.5636 & 0.574774 & 0.287387 \tabularnewline
M10 & 2.66463293650794 & 12.525617 & 0.2127 & 0.832144 & 0.416072 \tabularnewline
M11 & 2.02517361111111 & 12.524259 & 0.1617 & 0.872001 & 0.436001 \tabularnewline
t & 0.668030753968254 & 0.106517 & 6.2716 & 0 & 0 \tabularnewline
\hline
\end{tabular}
%Source: https://freestatistics.org/blog/index.php?pk=194195&T=2

[TABLE]
[ROW][C]Multiple Linear Regression - Ordinary Least Squares[/C][/ROW]
[ROW][C]Variable[/C][C]Parameter[/C][C]S.D.[/C][C]T-STATH0: parameter = 0[/C][C]2-tail p-value[/C][C]1-tail p-value[/C][/ROW]
[ROW][C](Intercept)[/C][C]60.7773809523809[/C][C]10.225645[/C][C]5.9436[/C][C]0[/C][C]0[/C][/ROW]
[ROW][C]M1[/C][C]-2.15166170634922[/C][C]12.578496[/C][C]-0.1711[/C][C]0.864664[/C][C]0.432332[/C][/ROW]
[ROW][C]M2[/C][C]-1.4625496031746[/C][C]12.569021[/C][C]-0.1164[/C][C]0.907695[/C][C]0.453847[/C][/ROW]
[ROW][C]M3[/C][C]4.65513392857143[/C][C]12.560443[/C][C]0.3706[/C][C]0.712025[/C][C]0.356013[/C][/ROW]
[ROW][C]M4[/C][C]9.87281746031746[/C][C]12.552762[/C][C]0.7865[/C][C]0.434189[/C][C]0.217094[/C][/ROW]
[ROW][C]M5[/C][C]9.97621527777778[/C][C]12.545982[/C][C]0.7952[/C][C]0.429164[/C][C]0.214582[/C][/ROW]
[ROW][C]M6[/C][C]13.736755952381[/C][C]12.540102[/C][C]1.0954[/C][C]0.277032[/C][C]0.138516[/C][/ROW]
[ROW][C]M7[/C][C]15.0830109126984[/C][C]12.535125[/C][C]1.2033[/C][C]0.232873[/C][C]0.116436[/C][/ROW]
[ROW][C]M8[/C][C]11.3864087301587[/C][C]12.531051[/C][C]0.9087[/C][C]0.366606[/C][C]0.183303[/C][/ROW]
[ROW][C]M9[/C][C]7.06123511904762[/C][C]12.527882[/C][C]0.5636[/C][C]0.574774[/C][C]0.287387[/C][/ROW]
[ROW][C]M10[/C][C]2.66463293650794[/C][C]12.525617[/C][C]0.2127[/C][C]0.832144[/C][C]0.416072[/C][/ROW]
[ROW][C]M11[/C][C]2.02517361111111[/C][C]12.524259[/C][C]0.1617[/C][C]0.872001[/C][C]0.436001[/C][/ROW]
[ROW][C]t[/C][C]0.668030753968254[/C][C]0.106517[/C][C]6.2716[/C][C]0[/C][C]0[/C][/ROW]
[/TABLE]
Source: https://freestatistics.org/blog/index.php?pk=194195&T=2

Globally Unique Identifier (entire table): ba.freestatistics.org/blog/index.php?pk=194195&T=2

As an alternative you can also use a QR Code:  

The GUIDs for individual cells are displayed in the table below:

Multiple Linear Regression - Ordinary Least Squares
VariableParameterS.D.T-STATH0: parameter = 02-tail p-value1-tail p-value
(Intercept)60.777380952380910.2256455.943600
M1-2.1516617063492212.578496-0.17110.8646640.432332
M2-1.462549603174612.569021-0.11640.9076950.453847
M34.6551339285714312.5604430.37060.7120250.356013
M49.8728174603174612.5527620.78650.4341890.217094
M59.9762152777777812.5459820.79520.4291640.214582
M613.73675595238112.5401021.09540.2770320.138516
M715.083010912698412.5351251.20330.2328730.116436
M811.386408730158712.5310510.90870.3666060.183303
M97.0612351190476212.5278820.56360.5747740.287387
M102.6646329365079412.5256170.21270.8321440.416072
M112.0251736111111112.5242590.16170.8720010.436001
t0.6680307539682540.1065176.271600


Multiple Linear Regression - Regression Statistics
Multiple R0.624523481847631
R-squared0.390029579379088
Adjusted R-squared0.286935987161469
F-TEST (value)3.78325724217447
F-TEST (DF numerator)12
F-TEST (DF denominator)71
p-value0.000190169002201479
Multiple Linear Regression - Residual Statistics
Residual Standard Deviation23.4298949946451
Sum Squared Residuals38976.1585416667

\begin{tabular}{lllllllll}
\hline
Multiple Linear Regression - Regression Statistics \tabularnewline
Multiple R & 0.624523481847631 \tabularnewline
R-squared & 0.390029579379088 \tabularnewline
Adjusted R-squared & 0.286935987161469 \tabularnewline
F-TEST (value) & 3.78325724217447 \tabularnewline
F-TEST (DF numerator) & 12 \tabularnewline
F-TEST (DF denominator) & 71 \tabularnewline
p-value & 0.000190169002201479 \tabularnewline
Multiple Linear Regression - Residual Statistics \tabularnewline
Residual Standard Deviation & 23.4298949946451 \tabularnewline
Sum Squared Residuals & 38976.1585416667 \tabularnewline
\hline
\end{tabular}
%Source: https://freestatistics.org/blog/index.php?pk=194195&T=3

[TABLE]
[ROW][C]Multiple Linear Regression - Regression Statistics[/C][/ROW]
[ROW][C]Multiple R[/C][C]0.624523481847631[/C][/ROW]
[ROW][C]R-squared[/C][C]0.390029579379088[/C][/ROW]
[ROW][C]Adjusted R-squared[/C][C]0.286935987161469[/C][/ROW]
[ROW][C]F-TEST (value)[/C][C]3.78325724217447[/C][/ROW]
[ROW][C]F-TEST (DF numerator)[/C][C]12[/C][/ROW]
[ROW][C]F-TEST (DF denominator)[/C][C]71[/C][/ROW]
[ROW][C]p-value[/C][C]0.000190169002201479[/C][/ROW]
[ROW][C]Multiple Linear Regression - Residual Statistics[/C][/ROW]
[ROW][C]Residual Standard Deviation[/C][C]23.4298949946451[/C][/ROW]
[ROW][C]Sum Squared Residuals[/C][C]38976.1585416667[/C][/ROW]
[/TABLE]
Source: https://freestatistics.org/blog/index.php?pk=194195&T=3

Globally Unique Identifier (entire table): ba.freestatistics.org/blog/index.php?pk=194195&T=3

As an alternative you can also use a QR Code:  

The GUIDs for individual cells are displayed in the table below:

Multiple Linear Regression - Regression Statistics
Multiple R0.624523481847631
R-squared0.390029579379088
Adjusted R-squared0.286935987161469
F-TEST (value)3.78325724217447
F-TEST (DF numerator)12
F-TEST (DF denominator)71
p-value0.000190169002201479
Multiple Linear Regression - Residual Statistics
Residual Standard Deviation23.4298949946451
Sum Squared Residuals38976.1585416667


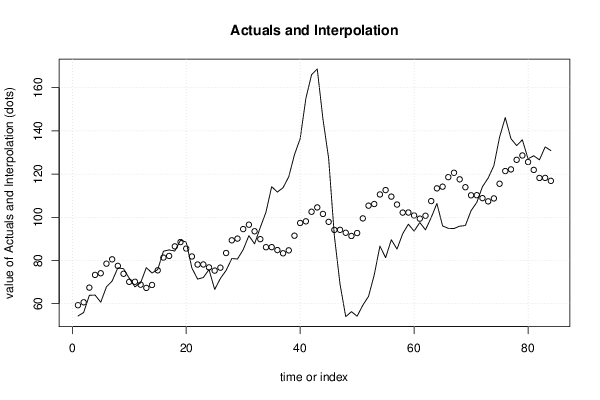
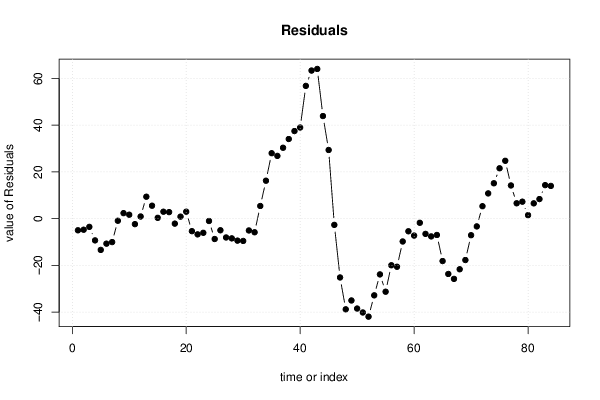
Multiple Linear Regression - Actuals, Interpolation, and Residuals
Time or IndexActualsInterpolationForecastResidualsPrediction Error
154.359.2937500000001-4.99375000000008
255.960.6508928571429-4.75089285714286
363.967.4366071428572-3.53660714285715
46473.3223214285714-9.32232142857142
560.774.09375-13.39375
667.878.5223214285714-10.7223214285714
770.580.5366071428571-10.0366071428571
876.677.5080357142857-0.908035714285717
976.273.85089285714292.34910714285715
1071.870.12232142857141.67767857142857
1167.870.1508928571428-2.35089285714286
1269.768.793750.90625000000001
1376.767.3101190476199.38988095238099
1474.268.66726190476195.53273809523811
1575.875.45297619047620.347023809523805
1684.381.33869047619052.96130952380952
1784.982.11011904761912.78988095238095
1884.486.5386904761905-2.13869047619047
1989.488.55297619047620.847023809523821
2088.585.52440476190482.97559523809524
2176.581.8672619047619-5.36726190476191
2271.478.1386904761905-6.73869047619047
2372.178.1672619047619-6.06726190476191
2475.876.8101190476191-1.01011904761905
2566.675.3264880952381-8.7264880952381
2671.776.683630952381-4.98363095238095
2775.483.4693452380952-8.06934523809524
2880.989.3550595238095-8.45505952380952
2980.790.1264880952381-9.4264880952381
308594.5550595238095-9.55505952380953
3191.596.5693452380952-5.06934523809524
3287.793.5407738095238-5.84077380952381
3395.389.8836309523815.41636904761904
34102.486.155059523809516.2449404761905
35114.286.18363095238128.0163690476191
36111.784.826488095238126.8735119047619
37113.783.342857142857130.3571428571429
38118.884.734.1
3912991.485714285714337.5142857142857
40136.497.371428571428639.0285714285714
4115598.142857142857156.8571428571429
42166102.57142857142963.4285714285714
43168.7104.58571428571464.1142857142857
44145.5101.55714285714343.9428571428572
45127.397.929.4
4691.594.1714285714286-2.67142857142857
476994.2-25.2
485492.8428571428571-38.8428571428571
4956.391.3592261904762-35.0592261904762
5054.292.7163690476191-38.5163690476191
5159.399.5020833333333-40.2020833333333
5263.4105.387797619048-41.9877976190476
5373.3106.159226190476-32.8592261904762
5486.7110.587797619048-23.8877976190476
5581.3112.602083333333-31.3020833333333
5689.6109.573511904762-19.9735119047619
5785.3105.916369047619-20.616369047619
5892.4102.187797619048-9.78779761904761
5996.8102.216369047619-5.41636904761905
6093.6100.859226190476-7.2592261904762
6197.699.3755952380952-1.77559523809523
6294.2100.732738095238-6.5327380952381
6399.9107.518452380952-7.61845238095238
64106.4113.404166666667-7.00416666666666
6596114.175595238095-18.1755952380953
6694.9118.604166666667-23.7041666666667
6794.8120.618452380952-25.8184523809524
6895.9117.589880952381-21.6898809523809
6996.2113.932738095238-17.7327380952381
70103.1110.204166666667-7.10416666666668
71106.9110.232738095238-3.33273809523809
72114.2108.8755952380955.32440476190475
73118.2107.39196428571410.8080357142857
74123.9108.74910714285715.1508928571429
75137.1115.53482142857121.5651785714286
76146.2121.42053571428624.7794642857143
77136.4122.19196428571414.2080357142857
78133.2126.6205357142866.57946428571428
79135.9128.6348214285717.26517857142858
80127.1125.606251.49375
81128.5121.9491071428576.55089285714286
82126.6118.2205357142868.37946428571428
83132.6118.24910714285714.3508928571429
84130.9116.89196428571414.0080357142857

\begin{tabular}{lllllllll}
\hline
Multiple Linear Regression - Actuals, Interpolation, and Residuals \tabularnewline
Time or Index & Actuals & InterpolationForecast & ResidualsPrediction Error \tabularnewline
1 & 54.3 & 59.2937500000001 & -4.99375000000008 \tabularnewline
2 & 55.9 & 60.6508928571429 & -4.75089285714286 \tabularnewline
3 & 63.9 & 67.4366071428572 & -3.53660714285715 \tabularnewline
4 & 64 & 73.3223214285714 & -9.32232142857142 \tabularnewline
5 & 60.7 & 74.09375 & -13.39375 \tabularnewline
6 & 67.8 & 78.5223214285714 & -10.7223214285714 \tabularnewline
7 & 70.5 & 80.5366071428571 & -10.0366071428571 \tabularnewline
8 & 76.6 & 77.5080357142857 & -0.908035714285717 \tabularnewline
9 & 76.2 & 73.8508928571429 & 2.34910714285715 \tabularnewline
10 & 71.8 & 70.1223214285714 & 1.67767857142857 \tabularnewline
11 & 67.8 & 70.1508928571428 & -2.35089285714286 \tabularnewline
12 & 69.7 & 68.79375 & 0.90625000000001 \tabularnewline
13 & 76.7 & 67.310119047619 & 9.38988095238099 \tabularnewline
14 & 74.2 & 68.6672619047619 & 5.53273809523811 \tabularnewline
15 & 75.8 & 75.4529761904762 & 0.347023809523805 \tabularnewline
16 & 84.3 & 81.3386904761905 & 2.96130952380952 \tabularnewline
17 & 84.9 & 82.1101190476191 & 2.78988095238095 \tabularnewline
18 & 84.4 & 86.5386904761905 & -2.13869047619047 \tabularnewline
19 & 89.4 & 88.5529761904762 & 0.847023809523821 \tabularnewline
20 & 88.5 & 85.5244047619048 & 2.97559523809524 \tabularnewline
21 & 76.5 & 81.8672619047619 & -5.36726190476191 \tabularnewline
22 & 71.4 & 78.1386904761905 & -6.73869047619047 \tabularnewline
23 & 72.1 & 78.1672619047619 & -6.06726190476191 \tabularnewline
24 & 75.8 & 76.8101190476191 & -1.01011904761905 \tabularnewline
25 & 66.6 & 75.3264880952381 & -8.7264880952381 \tabularnewline
26 & 71.7 & 76.683630952381 & -4.98363095238095 \tabularnewline
27 & 75.4 & 83.4693452380952 & -8.06934523809524 \tabularnewline
28 & 80.9 & 89.3550595238095 & -8.45505952380952 \tabularnewline
29 & 80.7 & 90.1264880952381 & -9.4264880952381 \tabularnewline
30 & 85 & 94.5550595238095 & -9.55505952380953 \tabularnewline
31 & 91.5 & 96.5693452380952 & -5.06934523809524 \tabularnewline
32 & 87.7 & 93.5407738095238 & -5.84077380952381 \tabularnewline
33 & 95.3 & 89.883630952381 & 5.41636904761904 \tabularnewline
34 & 102.4 & 86.1550595238095 & 16.2449404761905 \tabularnewline
35 & 114.2 & 86.183630952381 & 28.0163690476191 \tabularnewline
36 & 111.7 & 84.8264880952381 & 26.8735119047619 \tabularnewline
37 & 113.7 & 83.3428571428571 & 30.3571428571429 \tabularnewline
38 & 118.8 & 84.7 & 34.1 \tabularnewline
39 & 129 & 91.4857142857143 & 37.5142857142857 \tabularnewline
40 & 136.4 & 97.3714285714286 & 39.0285714285714 \tabularnewline
41 & 155 & 98.1428571428571 & 56.8571428571429 \tabularnewline
42 & 166 & 102.571428571429 & 63.4285714285714 \tabularnewline
43 & 168.7 & 104.585714285714 & 64.1142857142857 \tabularnewline
44 & 145.5 & 101.557142857143 & 43.9428571428572 \tabularnewline
45 & 127.3 & 97.9 & 29.4 \tabularnewline
46 & 91.5 & 94.1714285714286 & -2.67142857142857 \tabularnewline
47 & 69 & 94.2 & -25.2 \tabularnewline
48 & 54 & 92.8428571428571 & -38.8428571428571 \tabularnewline
49 & 56.3 & 91.3592261904762 & -35.0592261904762 \tabularnewline
50 & 54.2 & 92.7163690476191 & -38.5163690476191 \tabularnewline
51 & 59.3 & 99.5020833333333 & -40.2020833333333 \tabularnewline
52 & 63.4 & 105.387797619048 & -41.9877976190476 \tabularnewline
53 & 73.3 & 106.159226190476 & -32.8592261904762 \tabularnewline
54 & 86.7 & 110.587797619048 & -23.8877976190476 \tabularnewline
55 & 81.3 & 112.602083333333 & -31.3020833333333 \tabularnewline
56 & 89.6 & 109.573511904762 & -19.9735119047619 \tabularnewline
57 & 85.3 & 105.916369047619 & -20.616369047619 \tabularnewline
58 & 92.4 & 102.187797619048 & -9.78779761904761 \tabularnewline
59 & 96.8 & 102.216369047619 & -5.41636904761905 \tabularnewline
60 & 93.6 & 100.859226190476 & -7.2592261904762 \tabularnewline
61 & 97.6 & 99.3755952380952 & -1.77559523809523 \tabularnewline
62 & 94.2 & 100.732738095238 & -6.5327380952381 \tabularnewline
63 & 99.9 & 107.518452380952 & -7.61845238095238 \tabularnewline
64 & 106.4 & 113.404166666667 & -7.00416666666666 \tabularnewline
65 & 96 & 114.175595238095 & -18.1755952380953 \tabularnewline
66 & 94.9 & 118.604166666667 & -23.7041666666667 \tabularnewline
67 & 94.8 & 120.618452380952 & -25.8184523809524 \tabularnewline
68 & 95.9 & 117.589880952381 & -21.6898809523809 \tabularnewline
69 & 96.2 & 113.932738095238 & -17.7327380952381 \tabularnewline
70 & 103.1 & 110.204166666667 & -7.10416666666668 \tabularnewline
71 & 106.9 & 110.232738095238 & -3.33273809523809 \tabularnewline
72 & 114.2 & 108.875595238095 & 5.32440476190475 \tabularnewline
73 & 118.2 & 107.391964285714 & 10.8080357142857 \tabularnewline
74 & 123.9 & 108.749107142857 & 15.1508928571429 \tabularnewline
75 & 137.1 & 115.534821428571 & 21.5651785714286 \tabularnewline
76 & 146.2 & 121.420535714286 & 24.7794642857143 \tabularnewline
77 & 136.4 & 122.191964285714 & 14.2080357142857 \tabularnewline
78 & 133.2 & 126.620535714286 & 6.57946428571428 \tabularnewline
79 & 135.9 & 128.634821428571 & 7.26517857142858 \tabularnewline
80 & 127.1 & 125.60625 & 1.49375 \tabularnewline
81 & 128.5 & 121.949107142857 & 6.55089285714286 \tabularnewline
82 & 126.6 & 118.220535714286 & 8.37946428571428 \tabularnewline
83 & 132.6 & 118.249107142857 & 14.3508928571429 \tabularnewline
84 & 130.9 & 116.891964285714 & 14.0080357142857 \tabularnewline
\hline
\end{tabular}
%Source: https://freestatistics.org/blog/index.php?pk=194195&T=4

[TABLE]
[ROW][C]Multiple Linear Regression - Actuals, Interpolation, and Residuals[/C][/ROW]
[ROW][C]Time or Index[/C][C]Actuals[/C][C]InterpolationForecast[/C][C]ResidualsPrediction Error[/C][/ROW]
[ROW][C]1[/C][C]54.3[/C][C]59.2937500000001[/C][C]-4.99375000000008[/C][/ROW]
[ROW][C]2[/C][C]55.9[/C][C]60.6508928571429[/C][C]-4.75089285714286[/C][/ROW]
[ROW][C]3[/C][C]63.9[/C][C]67.4366071428572[/C][C]-3.53660714285715[/C][/ROW]
[ROW][C]4[/C][C]64[/C][C]73.3223214285714[/C][C]-9.32232142857142[/C][/ROW]
[ROW][C]5[/C][C]60.7[/C][C]74.09375[/C][C]-13.39375[/C][/ROW]
[ROW][C]6[/C][C]67.8[/C][C]78.5223214285714[/C][C]-10.7223214285714[/C][/ROW]
[ROW][C]7[/C][C]70.5[/C][C]80.5366071428571[/C][C]-10.0366071428571[/C][/ROW]
[ROW][C]8[/C][C]76.6[/C][C]77.5080357142857[/C][C]-0.908035714285717[/C][/ROW]
[ROW][C]9[/C][C]76.2[/C][C]73.8508928571429[/C][C]2.34910714285715[/C][/ROW]
[ROW][C]10[/C][C]71.8[/C][C]70.1223214285714[/C][C]1.67767857142857[/C][/ROW]
[ROW][C]11[/C][C]67.8[/C][C]70.1508928571428[/C][C]-2.35089285714286[/C][/ROW]
[ROW][C]12[/C][C]69.7[/C][C]68.79375[/C][C]0.90625000000001[/C][/ROW]
[ROW][C]13[/C][C]76.7[/C][C]67.310119047619[/C][C]9.38988095238099[/C][/ROW]
[ROW][C]14[/C][C]74.2[/C][C]68.6672619047619[/C][C]5.53273809523811[/C][/ROW]
[ROW][C]15[/C][C]75.8[/C][C]75.4529761904762[/C][C]0.347023809523805[/C][/ROW]
[ROW][C]16[/C][C]84.3[/C][C]81.3386904761905[/C][C]2.96130952380952[/C][/ROW]
[ROW][C]17[/C][C]84.9[/C][C]82.1101190476191[/C][C]2.78988095238095[/C][/ROW]
[ROW][C]18[/C][C]84.4[/C][C]86.5386904761905[/C][C]-2.13869047619047[/C][/ROW]
[ROW][C]19[/C][C]89.4[/C][C]88.5529761904762[/C][C]0.847023809523821[/C][/ROW]
[ROW][C]20[/C][C]88.5[/C][C]85.5244047619048[/C][C]2.97559523809524[/C][/ROW]
[ROW][C]21[/C][C]76.5[/C][C]81.8672619047619[/C][C]-5.36726190476191[/C][/ROW]
[ROW][C]22[/C][C]71.4[/C][C]78.1386904761905[/C][C]-6.73869047619047[/C][/ROW]
[ROW][C]23[/C][C]72.1[/C][C]78.1672619047619[/C][C]-6.06726190476191[/C][/ROW]
[ROW][C]24[/C][C]75.8[/C][C]76.8101190476191[/C][C]-1.01011904761905[/C][/ROW]
[ROW][C]25[/C][C]66.6[/C][C]75.3264880952381[/C][C]-8.7264880952381[/C][/ROW]
[ROW][C]26[/C][C]71.7[/C][C]76.683630952381[/C][C]-4.98363095238095[/C][/ROW]
[ROW][C]27[/C][C]75.4[/C][C]83.4693452380952[/C][C]-8.06934523809524[/C][/ROW]
[ROW][C]28[/C][C]80.9[/C][C]89.3550595238095[/C][C]-8.45505952380952[/C][/ROW]
[ROW][C]29[/C][C]80.7[/C][C]90.1264880952381[/C][C]-9.4264880952381[/C][/ROW]
[ROW][C]30[/C][C]85[/C][C]94.5550595238095[/C][C]-9.55505952380953[/C][/ROW]
[ROW][C]31[/C][C]91.5[/C][C]96.5693452380952[/C][C]-5.06934523809524[/C][/ROW]
[ROW][C]32[/C][C]87.7[/C][C]93.5407738095238[/C][C]-5.84077380952381[/C][/ROW]
[ROW][C]33[/C][C]95.3[/C][C]89.883630952381[/C][C]5.41636904761904[/C][/ROW]
[ROW][C]34[/C][C]102.4[/C][C]86.1550595238095[/C][C]16.2449404761905[/C][/ROW]
[ROW][C]35[/C][C]114.2[/C][C]86.183630952381[/C][C]28.0163690476191[/C][/ROW]
[ROW][C]36[/C][C]111.7[/C][C]84.8264880952381[/C][C]26.8735119047619[/C][/ROW]
[ROW][C]37[/C][C]113.7[/C][C]83.3428571428571[/C][C]30.3571428571429[/C][/ROW]
[ROW][C]38[/C][C]118.8[/C][C]84.7[/C][C]34.1[/C][/ROW]
[ROW][C]39[/C][C]129[/C][C]91.4857142857143[/C][C]37.5142857142857[/C][/ROW]
[ROW][C]40[/C][C]136.4[/C][C]97.3714285714286[/C][C]39.0285714285714[/C][/ROW]
[ROW][C]41[/C][C]155[/C][C]98.1428571428571[/C][C]56.8571428571429[/C][/ROW]
[ROW][C]42[/C][C]166[/C][C]102.571428571429[/C][C]63.4285714285714[/C][/ROW]
[ROW][C]43[/C][C]168.7[/C][C]104.585714285714[/C][C]64.1142857142857[/C][/ROW]
[ROW][C]44[/C][C]145.5[/C][C]101.557142857143[/C][C]43.9428571428572[/C][/ROW]
[ROW][C]45[/C][C]127.3[/C][C]97.9[/C][C]29.4[/C][/ROW]
[ROW][C]46[/C][C]91.5[/C][C]94.1714285714286[/C][C]-2.67142857142857[/C][/ROW]
[ROW][C]47[/C][C]69[/C][C]94.2[/C][C]-25.2[/C][/ROW]
[ROW][C]48[/C][C]54[/C][C]92.8428571428571[/C][C]-38.8428571428571[/C][/ROW]
[ROW][C]49[/C][C]56.3[/C][C]91.3592261904762[/C][C]-35.0592261904762[/C][/ROW]
[ROW][C]50[/C][C]54.2[/C][C]92.7163690476191[/C][C]-38.5163690476191[/C][/ROW]
[ROW][C]51[/C][C]59.3[/C][C]99.5020833333333[/C][C]-40.2020833333333[/C][/ROW]
[ROW][C]52[/C][C]63.4[/C][C]105.387797619048[/C][C]-41.9877976190476[/C][/ROW]
[ROW][C]53[/C][C]73.3[/C][C]106.159226190476[/C][C]-32.8592261904762[/C][/ROW]
[ROW][C]54[/C][C]86.7[/C][C]110.587797619048[/C][C]-23.8877976190476[/C][/ROW]
[ROW][C]55[/C][C]81.3[/C][C]112.602083333333[/C][C]-31.3020833333333[/C][/ROW]
[ROW][C]56[/C][C]89.6[/C][C]109.573511904762[/C][C]-19.9735119047619[/C][/ROW]
[ROW][C]57[/C][C]85.3[/C][C]105.916369047619[/C][C]-20.616369047619[/C][/ROW]
[ROW][C]58[/C][C]92.4[/C][C]102.187797619048[/C][C]-9.78779761904761[/C][/ROW]
[ROW][C]59[/C][C]96.8[/C][C]102.216369047619[/C][C]-5.41636904761905[/C][/ROW]
[ROW][C]60[/C][C]93.6[/C][C]100.859226190476[/C][C]-7.2592261904762[/C][/ROW]
[ROW][C]61[/C][C]97.6[/C][C]99.3755952380952[/C][C]-1.77559523809523[/C][/ROW]
[ROW][C]62[/C][C]94.2[/C][C]100.732738095238[/C][C]-6.5327380952381[/C][/ROW]
[ROW][C]63[/C][C]99.9[/C][C]107.518452380952[/C][C]-7.61845238095238[/C][/ROW]
[ROW][C]64[/C][C]106.4[/C][C]113.404166666667[/C][C]-7.00416666666666[/C][/ROW]
[ROW][C]65[/C][C]96[/C][C]114.175595238095[/C][C]-18.1755952380953[/C][/ROW]
[ROW][C]66[/C][C]94.9[/C][C]118.604166666667[/C][C]-23.7041666666667[/C][/ROW]
[ROW][C]67[/C][C]94.8[/C][C]120.618452380952[/C][C]-25.8184523809524[/C][/ROW]
[ROW][C]68[/C][C]95.9[/C][C]117.589880952381[/C][C]-21.6898809523809[/C][/ROW]
[ROW][C]69[/C][C]96.2[/C][C]113.932738095238[/C][C]-17.7327380952381[/C][/ROW]
[ROW][C]70[/C][C]103.1[/C][C]110.204166666667[/C][C]-7.10416666666668[/C][/ROW]
[ROW][C]71[/C][C]106.9[/C][C]110.232738095238[/C][C]-3.33273809523809[/C][/ROW]
[ROW][C]72[/C][C]114.2[/C][C]108.875595238095[/C][C]5.32440476190475[/C][/ROW]
[ROW][C]73[/C][C]118.2[/C][C]107.391964285714[/C][C]10.8080357142857[/C][/ROW]
[ROW][C]74[/C][C]123.9[/C][C]108.749107142857[/C][C]15.1508928571429[/C][/ROW]
[ROW][C]75[/C][C]137.1[/C][C]115.534821428571[/C][C]21.5651785714286[/C][/ROW]
[ROW][C]76[/C][C]146.2[/C][C]121.420535714286[/C][C]24.7794642857143[/C][/ROW]
[ROW][C]77[/C][C]136.4[/C][C]122.191964285714[/C][C]14.2080357142857[/C][/ROW]
[ROW][C]78[/C][C]133.2[/C][C]126.620535714286[/C][C]6.57946428571428[/C][/ROW]
[ROW][C]79[/C][C]135.9[/C][C]128.634821428571[/C][C]7.26517857142858[/C][/ROW]
[ROW][C]80[/C][C]127.1[/C][C]125.60625[/C][C]1.49375[/C][/ROW]
[ROW][C]81[/C][C]128.5[/C][C]121.949107142857[/C][C]6.55089285714286[/C][/ROW]
[ROW][C]82[/C][C]126.6[/C][C]118.220535714286[/C][C]8.37946428571428[/C][/ROW]
[ROW][C]83[/C][C]132.6[/C][C]118.249107142857[/C][C]14.3508928571429[/C][/ROW]
[ROW][C]84[/C][C]130.9[/C][C]116.891964285714[/C][C]14.0080357142857[/C][/ROW]
[/TABLE]
Source: https://freestatistics.org/blog/index.php?pk=194195&T=4

Globally Unique Identifier (entire table): ba.freestatistics.org/blog/index.php?pk=194195&T=4

As an alternative you can also use a QR Code:  

The GUIDs for individual cells are displayed in the table below:

Multiple Linear Regression - Actuals, Interpolation, and Residuals
Time or IndexActualsInterpolationForecastResidualsPrediction Error
154.359.2937500000001-4.99375000000008
255.960.6508928571429-4.75089285714286
363.967.4366071428572-3.53660714285715
46473.3223214285714-9.32232142857142
560.774.09375-13.39375
667.878.5223214285714-10.7223214285714
770.580.5366071428571-10.0366071428571
876.677.5080357142857-0.908035714285717
976.273.85089285714292.34910714285715
1071.870.12232142857141.67767857142857
1167.870.1508928571428-2.35089285714286
1269.768.793750.90625000000001
1376.767.3101190476199.38988095238099
1474.268.66726190476195.53273809523811
1575.875.45297619047620.347023809523805
1684.381.33869047619052.96130952380952
1784.982.11011904761912.78988095238095
1884.486.5386904761905-2.13869047619047
1989.488.55297619047620.847023809523821
2088.585.52440476190482.97559523809524
2176.581.8672619047619-5.36726190476191
2271.478.1386904761905-6.73869047619047
2372.178.1672619047619-6.06726190476191
2475.876.8101190476191-1.01011904761905
2566.675.3264880952381-8.7264880952381
2671.776.683630952381-4.98363095238095
2775.483.4693452380952-8.06934523809524
2880.989.3550595238095-8.45505952380952
2980.790.1264880952381-9.4264880952381
308594.5550595238095-9.55505952380953
3191.596.5693452380952-5.06934523809524
3287.793.5407738095238-5.84077380952381
3395.389.8836309523815.41636904761904
34102.486.155059523809516.2449404761905
35114.286.18363095238128.0163690476191
36111.784.826488095238126.8735119047619
37113.783.342857142857130.3571428571429
38118.884.734.1
3912991.485714285714337.5142857142857
40136.497.371428571428639.0285714285714
4115598.142857142857156.8571428571429
42166102.57142857142963.4285714285714
43168.7104.58571428571464.1142857142857
44145.5101.55714285714343.9428571428572
45127.397.929.4
4691.594.1714285714286-2.67142857142857
476994.2-25.2
485492.8428571428571-38.8428571428571
4956.391.3592261904762-35.0592261904762
5054.292.7163690476191-38.5163690476191
5159.399.5020833333333-40.2020833333333
5263.4105.387797619048-41.9877976190476
5373.3106.159226190476-32.8592261904762
5486.7110.587797619048-23.8877976190476
5581.3112.602083333333-31.3020833333333
5689.6109.573511904762-19.9735119047619
5785.3105.916369047619-20.616369047619
5892.4102.187797619048-9.78779761904761
5996.8102.216369047619-5.41636904761905
6093.6100.859226190476-7.2592261904762
6197.699.3755952380952-1.77559523809523
6294.2100.732738095238-6.5327380952381
6399.9107.518452380952-7.61845238095238
64106.4113.404166666667-7.00416666666666
6596114.175595238095-18.1755952380953
6694.9118.604166666667-23.7041666666667
6794.8120.618452380952-25.8184523809524
6895.9117.589880952381-21.6898809523809
6996.2113.932738095238-17.7327380952381
70103.1110.204166666667-7.10416666666668
71106.9110.232738095238-3.33273809523809
72114.2108.8755952380955.32440476190475
73118.2107.39196428571410.8080357142857
74123.9108.74910714285715.1508928571429
75137.1115.53482142857121.5651785714286
76146.2121.42053571428624.7794642857143
77136.4122.19196428571414.2080357142857
78133.2126.6205357142866.57946428571428
79135.9128.6348214285717.26517857142858
80127.1125.606251.49375
81128.5121.9491071428576.55089285714286
82126.6118.2205357142868.37946428571428
83132.6118.24910714285714.3508928571429
84130.9116.89196428571414.0080357142857


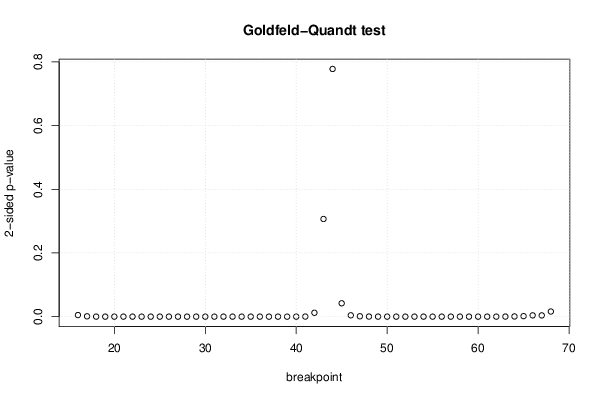
Goldfeld-Quandt test for Heteroskedasticity
p-valuesAlternative Hypothesis
breakpoint indexgreater2-sidedless
160.002502426084207540.005004852168415080.997497573915792
170.000519419480756120.001038838961512240.999480580519244
186.58011143998559e-050.0001316022287997120.9999341988856
196.60071054714179e-061.32014210942836e-050.999993399289453
202.19957594049834e-064.39915188099667e-060.99999780042406
211.70183268880534e-053.40366537761068e-050.999982981673112
222.10760695694639e-054.21521391389278e-050.999978923930431
237.96480671929214e-061.59296134385843e-050.999992035193281
242.25217594326257e-064.50435188652515e-060.999997747824057
253.59865483310239e-067.19730966620478e-060.999996401345167
261.30371856602545e-062.6074371320509e-060.999998696281434
274.66653137148911e-079.33306274297823e-070.999999533346863
281.37577344132994e-072.75154688265989e-070.999999862422656
293.62926966658067e-087.25853933316135e-080.999999963707303
308.93171236540071e-091.78634247308014e-080.999999991068288
311.95039408225205e-093.9007881645041e-090.999999998049606
325.54942398845914e-101.10988479769183e-090.999999999445058
331.78558575669833e-103.57117151339666e-100.999999999821441
344.51575387992268e-109.03150775984535e-100.999999999548425
351.28399137684789e-082.56798275369577e-080.999999987160086
362.96323895611249e-085.92647791222498e-080.99999997036761
378.81570932785313e-081.76314186557063e-070.999999911842907
382.62733308173436e-075.25466616346872e-070.999999737266692
391.03832616798638e-062.07665233597276e-060.999998961673832
403.63357911766801e-067.26715823533603e-060.999996366420882
410.0001437238166862340.0002874476333724670.999856276183314
420.006099729937543230.01219945987508650.993900270062457
430.1534105130147650.306821026029530.846589486985235
440.6109392722659050.7781214554681910.389060727734095
450.9789984181207470.0420031637585060.021001581879253
460.9978839535071720.004232092985655540.00211604649282777
470.9993908222629710.001218355474058780.000609177737029389
480.9998425966408190.0003148067183628460.000157403359181423
490.9999428187551090.000114362489782235.7181244891115e-05
500.99997929242294.14151541994726e-052.07075770997363e-05
510.9999946805097711.06389804579952e-055.3194902289976e-06
520.9999995542298068.91540387795779e-074.45770193897889e-07
530.9999993394718371.321056325627e-066.60528162813498e-07
540.9999985943475042.81130499134218e-061.40565249567109e-06
550.9999966500392226.69992155632732e-063.34996077816366e-06
560.9999953373856959.32522861042911e-064.66261430521456e-06
570.9999903197588721.93604822553305e-059.68024112766524e-06
580.9999899868545182.00262909647974e-051.00131454823987e-05
590.9999947956663091.04086673812253e-055.20433369061264e-06
600.999997002022895.99595421975359e-062.99797710987679e-06
610.9999941128114871.17743770263006e-055.88718851315031e-06
620.9999728564516595.42870966825496e-052.71435483412748e-05
630.9998917273145050.0002165453709894440.000108272685494722
640.9996768732500940.000646253499812820.00032312674990641
650.9992218500580920.001556299883814990.000778149941907494
660.9979739434785050.00405211304299010.00202605652149505
670.9980634390089110.003873121982177190.0019365609910886
680.9919512873166240.01609742536675110.00804871268337556

\begin{tabular}{lllllllll}
\hline
Goldfeld-Quandt test for Heteroskedasticity \tabularnewline
p-values & Alternative Hypothesis \tabularnewline
breakpoint index & greater & 2-sided & less \tabularnewline
16 & 0.00250242608420754 & 0.00500485216841508 & 0.997497573915792 \tabularnewline
17 & 0.00051941948075612 & 0.00103883896151224 & 0.999480580519244 \tabularnewline
18 & 6.58011143998559e-05 & 0.000131602228799712 & 0.9999341988856 \tabularnewline
19 & 6.60071054714179e-06 & 1.32014210942836e-05 & 0.999993399289453 \tabularnewline
20 & 2.19957594049834e-06 & 4.39915188099667e-06 & 0.99999780042406 \tabularnewline
21 & 1.70183268880534e-05 & 3.40366537761068e-05 & 0.999982981673112 \tabularnewline
22 & 2.10760695694639e-05 & 4.21521391389278e-05 & 0.999978923930431 \tabularnewline
23 & 7.96480671929214e-06 & 1.59296134385843e-05 & 0.999992035193281 \tabularnewline
24 & 2.25217594326257e-06 & 4.50435188652515e-06 & 0.999997747824057 \tabularnewline
25 & 3.59865483310239e-06 & 7.19730966620478e-06 & 0.999996401345167 \tabularnewline
26 & 1.30371856602545e-06 & 2.6074371320509e-06 & 0.999998696281434 \tabularnewline
27 & 4.66653137148911e-07 & 9.33306274297823e-07 & 0.999999533346863 \tabularnewline
28 & 1.37577344132994e-07 & 2.75154688265989e-07 & 0.999999862422656 \tabularnewline
29 & 3.62926966658067e-08 & 7.25853933316135e-08 & 0.999999963707303 \tabularnewline
30 & 8.93171236540071e-09 & 1.78634247308014e-08 & 0.999999991068288 \tabularnewline
31 & 1.95039408225205e-09 & 3.9007881645041e-09 & 0.999999998049606 \tabularnewline
32 & 5.54942398845914e-10 & 1.10988479769183e-09 & 0.999999999445058 \tabularnewline
33 & 1.78558575669833e-10 & 3.57117151339666e-10 & 0.999999999821441 \tabularnewline
34 & 4.51575387992268e-10 & 9.03150775984535e-10 & 0.999999999548425 \tabularnewline
35 & 1.28399137684789e-08 & 2.56798275369577e-08 & 0.999999987160086 \tabularnewline
36 & 2.96323895611249e-08 & 5.92647791222498e-08 & 0.99999997036761 \tabularnewline
37 & 8.81570932785313e-08 & 1.76314186557063e-07 & 0.999999911842907 \tabularnewline
38 & 2.62733308173436e-07 & 5.25466616346872e-07 & 0.999999737266692 \tabularnewline
39 & 1.03832616798638e-06 & 2.07665233597276e-06 & 0.999998961673832 \tabularnewline
40 & 3.63357911766801e-06 & 7.26715823533603e-06 & 0.999996366420882 \tabularnewline
41 & 0.000143723816686234 & 0.000287447633372467 & 0.999856276183314 \tabularnewline
42 & 0.00609972993754323 & 0.0121994598750865 & 0.993900270062457 \tabularnewline
43 & 0.153410513014765 & 0.30682102602953 & 0.846589486985235 \tabularnewline
44 & 0.610939272265905 & 0.778121455468191 & 0.389060727734095 \tabularnewline
45 & 0.978998418120747 & 0.042003163758506 & 0.021001581879253 \tabularnewline
46 & 0.997883953507172 & 0.00423209298565554 & 0.00211604649282777 \tabularnewline
47 & 0.999390822262971 & 0.00121835547405878 & 0.000609177737029389 \tabularnewline
48 & 0.999842596640819 & 0.000314806718362846 & 0.000157403359181423 \tabularnewline
49 & 0.999942818755109 & 0.00011436248978223 & 5.7181244891115e-05 \tabularnewline
50 & 0.9999792924229 & 4.14151541994726e-05 & 2.07075770997363e-05 \tabularnewline
51 & 0.999994680509771 & 1.06389804579952e-05 & 5.3194902289976e-06 \tabularnewline
52 & 0.999999554229806 & 8.91540387795779e-07 & 4.45770193897889e-07 \tabularnewline
53 & 0.999999339471837 & 1.321056325627e-06 & 6.60528162813498e-07 \tabularnewline
54 & 0.999998594347504 & 2.81130499134218e-06 & 1.40565249567109e-06 \tabularnewline
55 & 0.999996650039222 & 6.69992155632732e-06 & 3.34996077816366e-06 \tabularnewline
56 & 0.999995337385695 & 9.32522861042911e-06 & 4.66261430521456e-06 \tabularnewline
57 & 0.999990319758872 & 1.93604822553305e-05 & 9.68024112766524e-06 \tabularnewline
58 & 0.999989986854518 & 2.00262909647974e-05 & 1.00131454823987e-05 \tabularnewline
59 & 0.999994795666309 & 1.04086673812253e-05 & 5.20433369061264e-06 \tabularnewline
60 & 0.99999700202289 & 5.99595421975359e-06 & 2.99797710987679e-06 \tabularnewline
61 & 0.999994112811487 & 1.17743770263006e-05 & 5.88718851315031e-06 \tabularnewline
62 & 0.999972856451659 & 5.42870966825496e-05 & 2.71435483412748e-05 \tabularnewline
63 & 0.999891727314505 & 0.000216545370989444 & 0.000108272685494722 \tabularnewline
64 & 0.999676873250094 & 0.00064625349981282 & 0.00032312674990641 \tabularnewline
65 & 0.999221850058092 & 0.00155629988381499 & 0.000778149941907494 \tabularnewline
66 & 0.997973943478505 & 0.0040521130429901 & 0.00202605652149505 \tabularnewline
67 & 0.998063439008911 & 0.00387312198217719 & 0.0019365609910886 \tabularnewline
68 & 0.991951287316624 & 0.0160974253667511 & 0.00804871268337556 \tabularnewline
\hline
\end{tabular}
%Source: https://freestatistics.org/blog/index.php?pk=194195&T=5

[TABLE]
[ROW][C]Goldfeld-Quandt test for Heteroskedasticity[/C][/ROW]
[ROW][C]p-values[/C][C]Alternative Hypothesis[/C][/ROW]
[ROW][C]breakpoint index[/C][C]greater[/C][C]2-sided[/C][C]less[/C][/ROW]
[ROW][C]16[/C][C]0.00250242608420754[/C][C]0.00500485216841508[/C][C]0.997497573915792[/C][/ROW]
[ROW][C]17[/C][C]0.00051941948075612[/C][C]0.00103883896151224[/C][C]0.999480580519244[/C][/ROW]
[ROW][C]18[/C][C]6.58011143998559e-05[/C][C]0.000131602228799712[/C][C]0.9999341988856[/C][/ROW]
[ROW][C]19[/C][C]6.60071054714179e-06[/C][C]1.32014210942836e-05[/C][C]0.999993399289453[/C][/ROW]
[ROW][C]20[/C][C]2.19957594049834e-06[/C][C]4.39915188099667e-06[/C][C]0.99999780042406[/C][/ROW]
[ROW][C]21[/C][C]1.70183268880534e-05[/C][C]3.40366537761068e-05[/C][C]0.999982981673112[/C][/ROW]
[ROW][C]22[/C][C]2.10760695694639e-05[/C][C]4.21521391389278e-05[/C][C]0.999978923930431[/C][/ROW]
[ROW][C]23[/C][C]7.96480671929214e-06[/C][C]1.59296134385843e-05[/C][C]0.999992035193281[/C][/ROW]
[ROW][C]24[/C][C]2.25217594326257e-06[/C][C]4.50435188652515e-06[/C][C]0.999997747824057[/C][/ROW]
[ROW][C]25[/C][C]3.59865483310239e-06[/C][C]7.19730966620478e-06[/C][C]0.999996401345167[/C][/ROW]
[ROW][C]26[/C][C]1.30371856602545e-06[/C][C]2.6074371320509e-06[/C][C]0.999998696281434[/C][/ROW]
[ROW][C]27[/C][C]4.66653137148911e-07[/C][C]9.33306274297823e-07[/C][C]0.999999533346863[/C][/ROW]
[ROW][C]28[/C][C]1.37577344132994e-07[/C][C]2.75154688265989e-07[/C][C]0.999999862422656[/C][/ROW]
[ROW][C]29[/C][C]3.62926966658067e-08[/C][C]7.25853933316135e-08[/C][C]0.999999963707303[/C][/ROW]
[ROW][C]30[/C][C]8.93171236540071e-09[/C][C]1.78634247308014e-08[/C][C]0.999999991068288[/C][/ROW]
[ROW][C]31[/C][C]1.95039408225205e-09[/C][C]3.9007881645041e-09[/C][C]0.999999998049606[/C][/ROW]
[ROW][C]32[/C][C]5.54942398845914e-10[/C][C]1.10988479769183e-09[/C][C]0.999999999445058[/C][/ROW]
[ROW][C]33[/C][C]1.78558575669833e-10[/C][C]3.57117151339666e-10[/C][C]0.999999999821441[/C][/ROW]
[ROW][C]34[/C][C]4.51575387992268e-10[/C][C]9.03150775984535e-10[/C][C]0.999999999548425[/C][/ROW]
[ROW][C]35[/C][C]1.28399137684789e-08[/C][C]2.56798275369577e-08[/C][C]0.999999987160086[/C][/ROW]
[ROW][C]36[/C][C]2.96323895611249e-08[/C][C]5.92647791222498e-08[/C][C]0.99999997036761[/C][/ROW]
[ROW][C]37[/C][C]8.81570932785313e-08[/C][C]1.76314186557063e-07[/C][C]0.999999911842907[/C][/ROW]
[ROW][C]38[/C][C]2.62733308173436e-07[/C][C]5.25466616346872e-07[/C][C]0.999999737266692[/C][/ROW]
[ROW][C]39[/C][C]1.03832616798638e-06[/C][C]2.07665233597276e-06[/C][C]0.999998961673832[/C][/ROW]
[ROW][C]40[/C][C]3.63357911766801e-06[/C][C]7.26715823533603e-06[/C][C]0.999996366420882[/C][/ROW]
[ROW][C]41[/C][C]0.000143723816686234[/C][C]0.000287447633372467[/C][C]0.999856276183314[/C][/ROW]
[ROW][C]42[/C][C]0.00609972993754323[/C][C]0.0121994598750865[/C][C]0.993900270062457[/C][/ROW]
[ROW][C]43[/C][C]0.153410513014765[/C][C]0.30682102602953[/C][C]0.846589486985235[/C][/ROW]
[ROW][C]44[/C][C]0.610939272265905[/C][C]0.778121455468191[/C][C]0.389060727734095[/C][/ROW]
[ROW][C]45[/C][C]0.978998418120747[/C][C]0.042003163758506[/C][C]0.021001581879253[/C][/ROW]
[ROW][C]46[/C][C]0.997883953507172[/C][C]0.00423209298565554[/C][C]0.00211604649282777[/C][/ROW]
[ROW][C]47[/C][C]0.999390822262971[/C][C]0.00121835547405878[/C][C]0.000609177737029389[/C][/ROW]
[ROW][C]48[/C][C]0.999842596640819[/C][C]0.000314806718362846[/C][C]0.000157403359181423[/C][/ROW]
[ROW][C]49[/C][C]0.999942818755109[/C][C]0.00011436248978223[/C][C]5.7181244891115e-05[/C][/ROW]
[ROW][C]50[/C][C]0.9999792924229[/C][C]4.14151541994726e-05[/C][C]2.07075770997363e-05[/C][/ROW]
[ROW][C]51[/C][C]0.999994680509771[/C][C]1.06389804579952e-05[/C][C]5.3194902289976e-06[/C][/ROW]
[ROW][C]52[/C][C]0.999999554229806[/C][C]8.91540387795779e-07[/C][C]4.45770193897889e-07[/C][/ROW]
[ROW][C]53[/C][C]0.999999339471837[/C][C]1.321056325627e-06[/C][C]6.60528162813498e-07[/C][/ROW]
[ROW][C]54[/C][C]0.999998594347504[/C][C]2.81130499134218e-06[/C][C]1.40565249567109e-06[/C][/ROW]
[ROW][C]55[/C][C]0.999996650039222[/C][C]6.69992155632732e-06[/C][C]3.34996077816366e-06[/C][/ROW]
[ROW][C]56[/C][C]0.999995337385695[/C][C]9.32522861042911e-06[/C][C]4.66261430521456e-06[/C][/ROW]
[ROW][C]57[/C][C]0.999990319758872[/C][C]1.93604822553305e-05[/C][C]9.68024112766524e-06[/C][/ROW]
[ROW][C]58[/C][C]0.999989986854518[/C][C]2.00262909647974e-05[/C][C]1.00131454823987e-05[/C][/ROW]
[ROW][C]59[/C][C]0.999994795666309[/C][C]1.04086673812253e-05[/C][C]5.20433369061264e-06[/C][/ROW]
[ROW][C]60[/C][C]0.99999700202289[/C][C]5.99595421975359e-06[/C][C]2.99797710987679e-06[/C][/ROW]
[ROW][C]61[/C][C]0.999994112811487[/C][C]1.17743770263006e-05[/C][C]5.88718851315031e-06[/C][/ROW]
[ROW][C]62[/C][C]0.999972856451659[/C][C]5.42870966825496e-05[/C][C]2.71435483412748e-05[/C][/ROW]
[ROW][C]63[/C][C]0.999891727314505[/C][C]0.000216545370989444[/C][C]0.000108272685494722[/C][/ROW]
[ROW][C]64[/C][C]0.999676873250094[/C][C]0.00064625349981282[/C][C]0.00032312674990641[/C][/ROW]
[ROW][C]65[/C][C]0.999221850058092[/C][C]0.00155629988381499[/C][C]0.000778149941907494[/C][/ROW]
[ROW][C]66[/C][C]0.997973943478505[/C][C]0.0040521130429901[/C][C]0.00202605652149505[/C][/ROW]
[ROW][C]67[/C][C]0.998063439008911[/C][C]0.00387312198217719[/C][C]0.0019365609910886[/C][/ROW]
[ROW][C]68[/C][C]0.991951287316624[/C][C]0.0160974253667511[/C][C]0.00804871268337556[/C][/ROW]
[/TABLE]
Source: https://freestatistics.org/blog/index.php?pk=194195&T=5

Globally Unique Identifier (entire table): ba.freestatistics.org/blog/index.php?pk=194195&T=5

As an alternative you can also use a QR Code:  

The GUIDs for individual cells are displayed in the table below:

Goldfeld-Quandt test for Heteroskedasticity
p-valuesAlternative Hypothesis
breakpoint indexgreater2-sidedless
160.002502426084207540.005004852168415080.997497573915792
170.000519419480756120.001038838961512240.999480580519244
186.58011143998559e-050.0001316022287997120.9999341988856
196.60071054714179e-061.32014210942836e-050.999993399289453
202.19957594049834e-064.39915188099667e-060.99999780042406
211.70183268880534e-053.40366537761068e-050.999982981673112
222.10760695694639e-054.21521391389278e-050.999978923930431
237.96480671929214e-061.59296134385843e-050.999992035193281
242.25217594326257e-064.50435188652515e-060.999997747824057
253.59865483310239e-067.19730966620478e-060.999996401345167
261.30371856602545e-062.6074371320509e-060.999998696281434
274.66653137148911e-079.33306274297823e-070.999999533346863
281.37577344132994e-072.75154688265989e-070.999999862422656
293.62926966658067e-087.25853933316135e-080.999999963707303
308.93171236540071e-091.78634247308014e-080.999999991068288
311.95039408225205e-093.9007881645041e-090.999999998049606
325.54942398845914e-101.10988479769183e-090.999999999445058
331.78558575669833e-103.57117151339666e-100.999999999821441
344.51575387992268e-109.03150775984535e-100.999999999548425
351.28399137684789e-082.56798275369577e-080.999999987160086
362.96323895611249e-085.92647791222498e-080.99999997036761
378.81570932785313e-081.76314186557063e-070.999999911842907
382.62733308173436e-075.25466616346872e-070.999999737266692
391.03832616798638e-062.07665233597276e-060.999998961673832
403.63357911766801e-067.26715823533603e-060.999996366420882
410.0001437238166862340.0002874476333724670.999856276183314
420.006099729937543230.01219945987508650.993900270062457
430.1534105130147650.306821026029530.846589486985235
440.6109392722659050.7781214554681910.389060727734095
450.9789984181207470.0420031637585060.021001581879253
460.9978839535071720.004232092985655540.00211604649282777
470.9993908222629710.001218355474058780.000609177737029389
480.9998425966408190.0003148067183628460.000157403359181423
490.9999428187551090.000114362489782235.7181244891115e-05
500.99997929242294.14151541994726e-052.07075770997363e-05
510.9999946805097711.06389804579952e-055.3194902289976e-06
520.9999995542298068.91540387795779e-074.45770193897889e-07
530.9999993394718371.321056325627e-066.60528162813498e-07
540.9999985943475042.81130499134218e-061.40565249567109e-06
550.9999966500392226.69992155632732e-063.34996077816366e-06
560.9999953373856959.32522861042911e-064.66261430521456e-06
570.9999903197588721.93604822553305e-059.68024112766524e-06
580.9999899868545182.00262909647974e-051.00131454823987e-05
590.9999947956663091.04086673812253e-055.20433369061264e-06
600.999997002022895.99595421975359e-062.99797710987679e-06
610.9999941128114871.17743770263006e-055.88718851315031e-06
620.9999728564516595.42870966825496e-052.71435483412748e-05
630.9998917273145050.0002165453709894440.000108272685494722
640.9996768732500940.000646253499812820.00032312674990641
650.9992218500580920.001556299883814990.000778149941907494
660.9979739434785050.00405211304299010.00202605652149505
670.9980634390089110.003873121982177190.0019365609910886
680.9919512873166240.01609742536675110.00804871268337556


Meta Analysis of Goldfeld-Quandt test for Heteroskedasticity
Description# significant tests% significant testsOK/NOK
1% type I error level480.905660377358491NOK
5% type I error level510.962264150943396NOK
10% type I error level510.962264150943396NOK

\begin{tabular}{lllllllll}
\hline
Meta Analysis of Goldfeld-Quandt test for Heteroskedasticity \tabularnewline
Description & # significant tests & % significant tests & OK/NOK \tabularnewline
1% type I error level & 48 & 0.905660377358491 & NOK \tabularnewline
5% type I error level & 51 & 0.962264150943396 & NOK \tabularnewline
10% type I error level & 51 & 0.962264150943396 & NOK \tabularnewline
\hline
\end{tabular}
%Source: https://freestatistics.org/blog/index.php?pk=194195&T=6

[TABLE]
[ROW][C]Meta Analysis of Goldfeld-Quandt test for Heteroskedasticity[/C][/ROW]
[ROW][C]Description[/C][C]# significant tests[/C][C]% significant tests[/C][C]OK/NOK[/C][/ROW]
[ROW][C]1% type I error level[/C][C]48[/C][C]0.905660377358491[/C][C]NOK[/C][/ROW]
[ROW][C]5% type I error level[/C][C]51[/C][C]0.962264150943396[/C][C]NOK[/C][/ROW]
[ROW][C]10% type I error level[/C][C]51[/C][C]0.962264150943396[/C][C]NOK[/C][/ROW]
[/TABLE]
Source: https://freestatistics.org/blog/index.php?pk=194195&T=6

Globally Unique Identifier (entire table): ba.freestatistics.org/blog/index.php?pk=194195&T=6

As an alternative you can also use a QR Code:  

The GUIDs for individual cells are displayed in the table below:

Meta Analysis of Goldfeld-Quandt test for Heteroskedasticity
Description# significant tests% significant testsOK/NOK
1% type I error level480.905660377358491NOK
5% type I error level510.962264150943396NOK
10% type I error level510.962264150943396NOK


Parameters (Session):
par1 = 1 ; par2 = Include Monthly Dummies ; par3 = Linear Trend ;
Parameters (R input):
par1 = 1 ; par2 = Include Monthly Dummies ; par3 = Linear Trend ;
R code (references can be found in the software module):
library(lattice)
library(lmtest)
n25 <- 25 #minimum number of obs. for Goldfeld-Quandt test
par1 <- as.numeric(par1)
x <- t(y)
k <- length(x[1,])
n <- length(x[,1])
x1 <- cbind(x[,par1], x[,1:k!=par1])
mycolnames <- c(colnames(x)[par1], colnames(x)[1:k!=par1])
colnames(x1) <- mycolnames #colnames(x)[par1]
x <- x1
if (par3 == 'First Differences'){
x2 <- array(0, dim=c(n-1,k), dimnames=list(1:(n-1), paste('(1-B)',colnames(x),sep='')))
for (i in 1:n-1) {
for (j in 1:k) {
x2[i,j] <- x[i+1,j] - x[i,j]
}
}
x <- x2
}
if (par2 == 'Include Monthly Dummies'){
x2 <- array(0, dim=c(n,11), dimnames=list(1:n, paste('M', seq(1:11), sep ='')))
for (i in 1:11){
x2[seq(i,n,12),i] <- 1
}
x <- cbind(x, x2)
}
if (par2 == 'Include Quarterly Dummies'){
x2 <- array(0, dim=c(n,3), dimnames=list(1:n, paste('Q', seq(1:3), sep ='')))
for (i in 1:3){
x2[seq(i,n,4),i] <- 1
}
x <- cbind(x, x2)
}
k <- length(x[1,])
if (par3 == 'Linear Trend'){
x <- cbind(x, c(1:n))
colnames(x)[k+1] <- 't'
}
x
k <- length(x[1,])
df <- as.data.frame(x)
(mylm <- lm(df))
(mysum <- summary(mylm))
if (n > n25) {
kp3 <- k + 3
nmkm3 <- n - k - 3
gqarr <- array(NA, dim=c(nmkm3-kp3+1,3))
numgqtests <- 0
numsignificant1 <- 0
numsignificant5 <- 0
numsignificant10 <- 0
for (mypoint in kp3:nmkm3) {
j <- 0
numgqtests <- numgqtests + 1
for (myalt in c('greater', 'two.sided', 'less')) {
j <- j + 1
gqarr[mypoint-kp3+1,j] <- gqtest(mylm, point=mypoint, alternative=myalt)$p.value
}
if (gqarr[mypoint-kp3+1,2] < 0.01) numsignificant1 <- numsignificant1 + 1
if (gqarr[mypoint-kp3+1,2] < 0.05) numsignificant5 <- numsignificant5 + 1
if (gqarr[mypoint-kp3+1,2] < 0.10) numsignificant10 <- numsignificant10 + 1
}
gqarr
}
bitmap(file='test0.png')
plot(x[,1], type='l', main='Actuals and Interpolation', ylab='value of Actuals and Interpolation (dots)', xlab='time or index')
points(x[,1]-mysum$resid)
grid()
dev.off()
bitmap(file='test1.png')
plot(mysum$resid, type='b', pch=19, main='Residuals', ylab='value of Residuals', xlab='time or index')
grid()
dev.off()
bitmap(file='test2.png')
hist(mysum$resid, main='Residual Histogram', xlab='values of Residuals')
grid()
dev.off()
bitmap(file='test3.png')
densityplot(~mysum$resid,col='black',main='Residual Density Plot', xlab='values of Residuals')
dev.off()
bitmap(file='test4.png')
qqnorm(mysum$resid, main='Residual Normal Q-Q Plot')
qqline(mysum$resid)
grid()
dev.off()
(myerror <- as.ts(mysum$resid))
bitmap(file='test5.png')
dum <- cbind(lag(myerror,k=1),myerror)
dum
dum1 <- dum[2:length(myerror),]
dum1
z <- as.data.frame(dum1)
z
plot(z,main=paste('Residual Lag plot, lowess, and regression line'), ylab='values of Residuals', xlab='lagged values of Residuals')
lines(lowess(z))
abline(lm(z))
grid()
dev.off()
bitmap(file='test6.png')
acf(mysum$resid, lag.max=length(mysum$resid)/2, main='Residual Autocorrelation Function')
grid()
dev.off()
bitmap(file='test7.png')
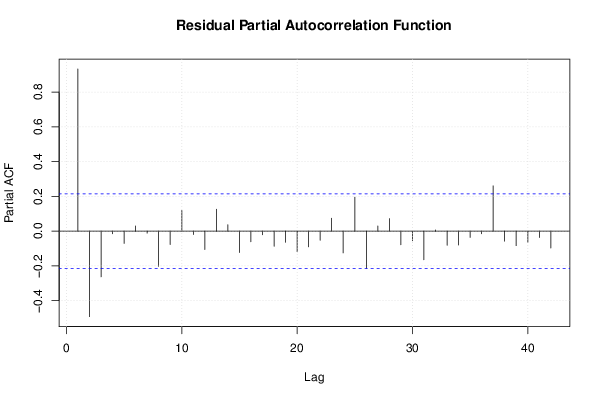
pacf(mysum$resid, lag.max=length(mysum$resid)/2, main='Residual Partial Autocorrelation Function')
grid()
dev.off()
bitmap(file='test8.png')
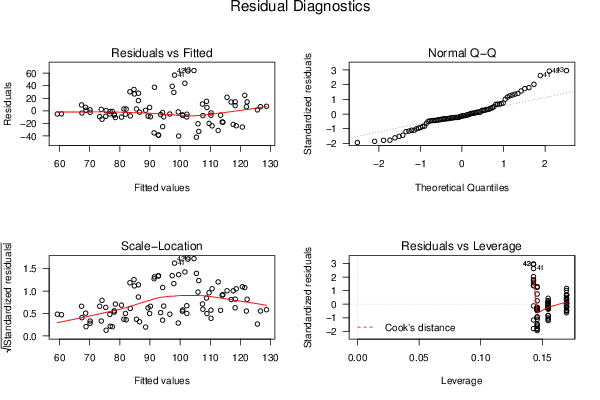
opar <- par(mfrow = c(2,2), oma = c(0, 0, 1.1, 0))
plot(mylm, las = 1, sub='Residual Diagnostics')
par(opar)
dev.off()
if (n > n25) {
bitmap(file='test9.png')
plot(kp3:nmkm3,gqarr[,2], main='Goldfeld-Quandt test',ylab='2-sided p-value',xlab='breakpoint')
grid()
dev.off()
}
load(file='createtable')
a<-table.start()
a<-table.row.start(a)
a<-table.element(a, 'Multiple Linear Regression - Estimated Regression Equation', 1, TRUE)
a<-table.row.end(a)
myeq <- colnames(x)[1]
myeq <- paste(myeq, '[t] = ', sep='')
for (i in 1:k){
if (mysum$coefficients[i,1] > 0) myeq <- paste(myeq, '+', '')
myeq <- paste(myeq, mysum$coefficients[i,1], sep=' ')
if (rownames(mysum$coefficients)[i] != '(Intercept)') {
myeq <- paste(myeq, rownames(mysum$coefficients)[i], sep='')
if (rownames(mysum$coefficients)[i] != 't') myeq <- paste(myeq, '[t]', sep='')
}
}
myeq <- paste(myeq, ' + e[t]')
a<-table.row.start(a)
a<-table.element(a, myeq)
a<-table.row.end(a)
a<-table.end(a)
table.save(a,file='mytable1.tab')
a<-table.start()
a<-table.row.start(a)
a<-table.element(a,hyperlink('ols1.htm','Multiple Linear Regression - Ordinary Least Squares',''), 6, TRUE)
a<-table.row.end(a)
a<-table.row.start(a)
a<-table.element(a,'Variable',header=TRUE)
a<-table.element(a,'Parameter',header=TRUE)
a<-table.element(a,'S.D.',header=TRUE)
a<-table.element(a,'T-STAT
H0: parameter = 0',header=TRUE)
a<-table.element(a,'2-tail p-value',header=TRUE)
a<-table.element(a,'1-tail p-value',header=TRUE)
a<-table.row.end(a)
for (i in 1:k){
a<-table.row.start(a)
a<-table.element(a,rownames(mysum$coefficients)[i],header=TRUE)
a<-table.element(a,mysum$coefficients[i,1])
a<-table.element(a, round(mysum$coefficients[i,2],6))
a<-table.element(a, round(mysum$coefficients[i,3],4))
a<-table.element(a, round(mysum$coefficients[i,4],6))
a<-table.element(a, round(mysum$coefficients[i,4]/2,6))
a<-table.row.end(a)
}
a<-table.end(a)
table.save(a,file='mytable2.tab')
a<-table.start()
a<-table.row.start(a)
a<-table.element(a, 'Multiple Linear Regression - Regression Statistics', 2, TRUE)
a<-table.row.end(a)
a<-table.row.start(a)
a<-table.element(a, 'Multiple R',1,TRUE)
a<-table.element(a, sqrt(mysum$r.squared))
a<-table.row.end(a)
a<-table.row.start(a)
a<-table.element(a, 'R-squared',1,TRUE)
a<-table.element(a, mysum$r.squared)
a<-table.row.end(a)
a<-table.row.start(a)
a<-table.element(a, 'Adjusted R-squared',1,TRUE)
a<-table.element(a, mysum$adj.r.squared)
a<-table.row.end(a)
a<-table.row.start(a)
a<-table.element(a, 'F-TEST (value)',1,TRUE)
a<-table.element(a, mysum$fstatistic[1])
a<-table.row.end(a)
a<-table.row.start(a)
a<-table.element(a, 'F-TEST (DF numerator)',1,TRUE)
a<-table.element(a, mysum$fstatistic[2])
a<-table.row.end(a)
a<-table.row.start(a)
a<-table.element(a, 'F-TEST (DF denominator)',1,TRUE)
a<-table.element(a, mysum$fstatistic[3])
a<-table.row.end(a)
a<-table.row.start(a)
a<-table.element(a, 'p-value',1,TRUE)
a<-table.element(a, 1-pf(mysum$fstatistic[1],mysum$fstatistic[2],mysum$fstatistic[3]))
a<-table.row.end(a)
a<-table.row.start(a)
a<-table.element(a, 'Multiple Linear Regression - Residual Statistics', 2, TRUE)
a<-table.row.end(a)
a<-table.row.start(a)
a<-table.element(a, 'Residual Standard Deviation',1,TRUE)
a<-table.element(a, mysum$sigma)
a<-table.row.end(a)
a<-table.row.start(a)
a<-table.element(a, 'Sum Squared Residuals',1,TRUE)
a<-table.element(a, sum(myerror*myerror))
a<-table.row.end(a)
a<-table.end(a)
table.save(a,file='mytable3.tab')
a<-table.start()
a<-table.row.start(a)
a<-table.element(a, 'Multiple Linear Regression - Actuals, Interpolation, and Residuals', 4, TRUE)
a<-table.row.end(a)
a<-table.row.start(a)
a<-table.element(a, 'Time or Index', 1, TRUE)
a<-table.element(a, 'Actuals', 1, TRUE)
a<-table.element(a, 'Interpolation
Forecast', 1, TRUE)
a<-table.element(a, 'Residuals
Prediction Error', 1, TRUE)
a<-table.row.end(a)
for (i in 1:n) {
a<-table.row.start(a)
a<-table.element(a,i, 1, TRUE)
a<-table.element(a,x[i])
a<-table.element(a,x[i]-mysum$resid[i])
a<-table.element(a,mysum$resid[i])
a<-table.row.end(a)
}
a<-table.end(a)
table.save(a,file='mytable4.tab')
if (n > n25) {
a<-table.start()
a<-table.row.start(a)
a<-table.element(a,'Goldfeld-Quandt test for Heteroskedasticity',4,TRUE)
a<-table.row.end(a)
a<-table.row.start(a)
a<-table.element(a,'p-values',header=TRUE)
a<-table.element(a,'Alternative Hypothesis',3,header=TRUE)
a<-table.row.end(a)
a<-table.row.start(a)
a<-table.element(a,'breakpoint index',header=TRUE)
a<-table.element(a,'greater',header=TRUE)
a<-table.element(a,'2-sided',header=TRUE)
a<-table.element(a,'less',header=TRUE)
a<-table.row.end(a)
for (mypoint in kp3:nmkm3) {
a<-table.row.start(a)
a<-table.element(a,mypoint,header=TRUE)
a<-table.element(a,gqarr[mypoint-kp3+1,1])
a<-table.element(a,gqarr[mypoint-kp3+1,2])
a<-table.element(a,gqarr[mypoint-kp3+1,3])
a<-table.row.end(a)
}
a<-table.end(a)
table.save(a,file='mytable5.tab')
a<-table.start()
a<-table.row.start(a)
a<-table.element(a,'Meta Analysis of Goldfeld-Quandt test for Heteroskedasticity',4,TRUE)
a<-table.row.end(a)
a<-table.row.start(a)
a<-table.element(a,'Description',header=TRUE)
a<-table.element(a,'# significant tests',header=TRUE)
a<-table.element(a,'% significant tests',header=TRUE)
a<-table.element(a,'OK/NOK',header=TRUE)
a<-table.row.end(a)
a<-table.row.start(a)
a<-table.element(a,'1% type I error level',header=TRUE)
a<-table.element(a,numsignificant1)
a<-table.element(a,numsignificant1/numgqtests)
if (numsignificant1/numgqtests < 0.01) dum <- 'OK' else dum <- 'NOK'
a<-table.element(a,dum)
a<-table.row.end(a)
a<-table.row.start(a)
a<-table.element(a,'5% type I error level',header=TRUE)
a<-table.element(a,numsignificant5)
a<-table.element(a,numsignificant5/numgqtests)
if (numsignificant5/numgqtests < 0.05) dum <- 'OK' else dum <- 'NOK'
a<-table.element(a,dum)
a<-table.row.end(a)
a<-table.row.start(a)
a<-table.element(a,'10% type I error level',header=TRUE)
a<-table.element(a,numsignificant10)
a<-table.element(a,numsignificant10/numgqtests)
if (numsignificant10/numgqtests < 0.1) dum <- 'OK' else dum <- 'NOK'
a<-table.element(a,dum)
a<-table.row.end(a)
a<-table.end(a)
table.save(a,file='mytable6.tab')
}