Free Statistics

of Irreproducible Research!

Author's title

Author*Unverified author*
R Software Modulerwasp_autocorrelation.wasp
Title produced by software(Partial) Autocorrelation Function
Date of computationFri, 16 Nov 2012 15:14:12 -0500
Cite this page as followsStatistical Computations at FreeStatistics.org, Office for Research Development and Education, URL https://freestatistics.org/blog/index.php?v=date/2012/Nov/16/t1353097004gveui9p3xiqk6v9.htm/, Retrieved Sat, 27 Apr 2024 09:14:40 +0000
Statistical Computations at FreeStatistics.org, Office for Research Development and Education, URL https://freestatistics.org/blog/index.php?pk=190012, Retrieved Sat, 27 Apr 2024 09:14:40 +0000
QR Codes:

Original text written by user:
IsPrivate?No (this computation is public)
User-defined keywords
Estimated Impact59
Family? (F = Feedback message, R = changed R code, M = changed R Module, P = changed Parameters, D = changed Data)
-       [(Partial) Autocorrelation Function] [inschrijving nieu...] [2012-11-16 20:14:12] [d0e7cd87186a15776b36563906a5538f] [Current]
Feedback Forum

Post a new message
Dataseries X:
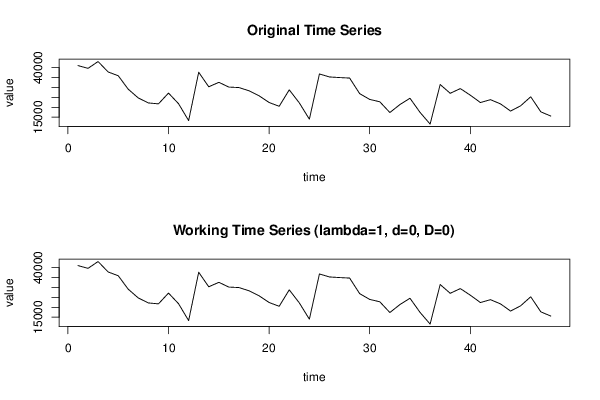
41086
39690
43129
37863
35953
29133
24693
22205
21725
27192
21790
13253
37702
30364
32609
30212
29965
28352
25814
22414
20506
28806
22228
13971
36845
35338
35022
34777
26887
23970
22780
17351
21382
24561
17409
11514
31514
27071
29462
26105
22397
23843
21705
18089
20764
25316
17704
15548


Summary of computational transaction
Raw Inputview raw input (R code)
Raw Outputview raw output of R engine
Computing time3 seconds
R Server'George Udny Yule' @ yule.wessa.net

\begin{tabular}{lllllllll}
\hline
Summary of computational transaction \tabularnewline
Raw Input & view raw input (R code)  \tabularnewline
Raw Output & view raw output of R engine  \tabularnewline
Computing time & 3 seconds \tabularnewline
R Server & 'George Udny Yule' @ yule.wessa.net \tabularnewline
\hline
\end{tabular}
%Source: https://freestatistics.org/blog/index.php?pk=190012&T=0

[TABLE]
[ROW][C]Summary of computational transaction[/C][/ROW]
[ROW][C]Raw Input[/C][C]view raw input (R code) [/C][/ROW]
[ROW][C]Raw Output[/C][C]view raw output of R engine [/C][/ROW]
[ROW][C]Computing time[/C][C]3 seconds[/C][/ROW]
[ROW][C]R Server[/C][C]'George Udny Yule' @ yule.wessa.net[/C][/ROW]
[/TABLE]
Source: https://freestatistics.org/blog/index.php?pk=190012&T=0

Globally Unique Identifier (entire table): ba.freestatistics.org/blog/index.php?pk=190012&T=0

As an alternative you can also use a QR Code:  

The GUIDs for individual cells are displayed in the table below:

Summary of computational transaction
Raw Inputview raw input (R code)
Raw Outputview raw output of R engine
Computing time3 seconds
R Server'George Udny Yule' @ yule.wessa.net


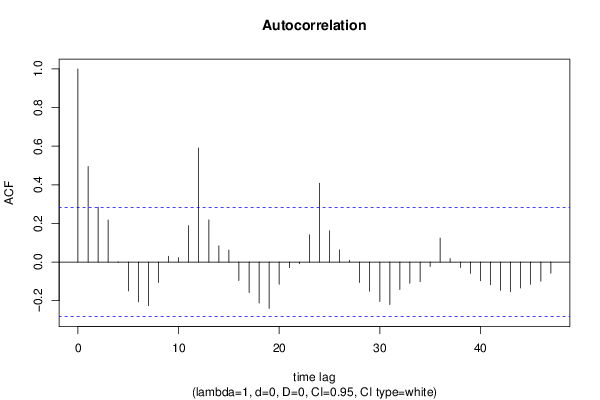
Autocorrelation Function
Time lag kACF(k)T-STATP-value
10.4949363.4290.000627
20.2837391.96580.02756
30.2180351.51060.068724
4-0.001798-0.01250.495056
5-0.149361-1.03480.152973
6-0.206254-1.4290.079745
7-0.225854-1.56480.062104
8-0.106377-0.7370.232354
90.0298490.20680.418521
100.022680.15710.437901
110.1884861.30590.098911
120.5902494.08948.2e-05
130.2182691.51220.068518
140.0837310.58010.282278
150.0619030.42890.334966
16-0.095548-0.6620.255576
17-0.158169-1.09580.139311
18-0.211829-1.46760.074368
19-0.239952-1.66240.051471
20-0.114991-0.79670.21478
21-0.028916-0.20030.421032
22-0.008896-0.06160.475555
230.1411310.97780.166542
240.4078512.82570.003428
250.1616791.12010.134112
260.0630760.4370.332034
270.0088950.06160.475559
28-0.10578-0.73290.233602
29-0.151492-1.04960.149586
30-0.204282-1.41530.081717
31-0.219858-1.52320.067132
32-0.142579-0.98780.164098
33-0.109548-0.7590.225791
34-0.101456-0.70290.242755
35-0.023122-0.16020.436699
360.1240310.85930.19722
370.0177440.12290.451336
38-0.028217-0.19550.422917
39-0.058785-0.40730.342808
40-0.096702-0.670.253043
41-0.117382-0.81320.210045
42-0.146666-1.01610.157331
43-0.153876-1.06610.145859
44-0.134992-0.93530.177169
45-0.115118-0.79760.214527
46-0.099926-0.69230.24604
47-0.058557-0.40570.343385
48NANANA

\begin{tabular}{lllllllll}
\hline
Autocorrelation Function \tabularnewline
Time lag k & ACF(k) & T-STAT & P-value \tabularnewline
1 & 0.494936 & 3.429 & 0.000627 \tabularnewline
2 & 0.283739 & 1.9658 & 0.02756 \tabularnewline
3 & 0.218035 & 1.5106 & 0.068724 \tabularnewline
4 & -0.001798 & -0.0125 & 0.495056 \tabularnewline
5 & -0.149361 & -1.0348 & 0.152973 \tabularnewline
6 & -0.206254 & -1.429 & 0.079745 \tabularnewline
7 & -0.225854 & -1.5648 & 0.062104 \tabularnewline
8 & -0.106377 & -0.737 & 0.232354 \tabularnewline
9 & 0.029849 & 0.2068 & 0.418521 \tabularnewline
10 & 0.02268 & 0.1571 & 0.437901 \tabularnewline
11 & 0.188486 & 1.3059 & 0.098911 \tabularnewline
12 & 0.590249 & 4.0894 & 8.2e-05 \tabularnewline
13 & 0.218269 & 1.5122 & 0.068518 \tabularnewline
14 & 0.083731 & 0.5801 & 0.282278 \tabularnewline
15 & 0.061903 & 0.4289 & 0.334966 \tabularnewline
16 & -0.095548 & -0.662 & 0.255576 \tabularnewline
17 & -0.158169 & -1.0958 & 0.139311 \tabularnewline
18 & -0.211829 & -1.4676 & 0.074368 \tabularnewline
19 & -0.239952 & -1.6624 & 0.051471 \tabularnewline
20 & -0.114991 & -0.7967 & 0.21478 \tabularnewline
21 & -0.028916 & -0.2003 & 0.421032 \tabularnewline
22 & -0.008896 & -0.0616 & 0.475555 \tabularnewline
23 & 0.141131 & 0.9778 & 0.166542 \tabularnewline
24 & 0.407851 & 2.8257 & 0.003428 \tabularnewline
25 & 0.161679 & 1.1201 & 0.134112 \tabularnewline
26 & 0.063076 & 0.437 & 0.332034 \tabularnewline
27 & 0.008895 & 0.0616 & 0.475559 \tabularnewline
28 & -0.10578 & -0.7329 & 0.233602 \tabularnewline
29 & -0.151492 & -1.0496 & 0.149586 \tabularnewline
30 & -0.204282 & -1.4153 & 0.081717 \tabularnewline
31 & -0.219858 & -1.5232 & 0.067132 \tabularnewline
32 & -0.142579 & -0.9878 & 0.164098 \tabularnewline
33 & -0.109548 & -0.759 & 0.225791 \tabularnewline
34 & -0.101456 & -0.7029 & 0.242755 \tabularnewline
35 & -0.023122 & -0.1602 & 0.436699 \tabularnewline
36 & 0.124031 & 0.8593 & 0.19722 \tabularnewline
37 & 0.017744 & 0.1229 & 0.451336 \tabularnewline
38 & -0.028217 & -0.1955 & 0.422917 \tabularnewline
39 & -0.058785 & -0.4073 & 0.342808 \tabularnewline
40 & -0.096702 & -0.67 & 0.253043 \tabularnewline
41 & -0.117382 & -0.8132 & 0.210045 \tabularnewline
42 & -0.146666 & -1.0161 & 0.157331 \tabularnewline
43 & -0.153876 & -1.0661 & 0.145859 \tabularnewline
44 & -0.134992 & -0.9353 & 0.177169 \tabularnewline
45 & -0.115118 & -0.7976 & 0.214527 \tabularnewline
46 & -0.099926 & -0.6923 & 0.24604 \tabularnewline
47 & -0.058557 & -0.4057 & 0.343385 \tabularnewline
48 & NA & NA & NA \tabularnewline
\hline
\end{tabular}
%Source: https://freestatistics.org/blog/index.php?pk=190012&T=1

[TABLE]
[ROW][C]Autocorrelation Function[/C][/ROW]
[ROW][C]Time lag k[/C][C]ACF(k)[/C][C]T-STAT[/C][C]P-value[/C][/ROW]
[ROW][C]1[/C][C]0.494936[/C][C]3.429[/C][C]0.000627[/C][/ROW]
[ROW][C]2[/C][C]0.283739[/C][C]1.9658[/C][C]0.02756[/C][/ROW]
[ROW][C]3[/C][C]0.218035[/C][C]1.5106[/C][C]0.068724[/C][/ROW]
[ROW][C]4[/C][C]-0.001798[/C][C]-0.0125[/C][C]0.495056[/C][/ROW]
[ROW][C]5[/C][C]-0.149361[/C][C]-1.0348[/C][C]0.152973[/C][/ROW]
[ROW][C]6[/C][C]-0.206254[/C][C]-1.429[/C][C]0.079745[/C][/ROW]
[ROW][C]7[/C][C]-0.225854[/C][C]-1.5648[/C][C]0.062104[/C][/ROW]
[ROW][C]8[/C][C]-0.106377[/C][C]-0.737[/C][C]0.232354[/C][/ROW]
[ROW][C]9[/C][C]0.029849[/C][C]0.2068[/C][C]0.418521[/C][/ROW]
[ROW][C]10[/C][C]0.02268[/C][C]0.1571[/C][C]0.437901[/C][/ROW]
[ROW][C]11[/C][C]0.188486[/C][C]1.3059[/C][C]0.098911[/C][/ROW]
[ROW][C]12[/C][C]0.590249[/C][C]4.0894[/C][C]8.2e-05[/C][/ROW]
[ROW][C]13[/C][C]0.218269[/C][C]1.5122[/C][C]0.068518[/C][/ROW]
[ROW][C]14[/C][C]0.083731[/C][C]0.5801[/C][C]0.282278[/C][/ROW]
[ROW][C]15[/C][C]0.061903[/C][C]0.4289[/C][C]0.334966[/C][/ROW]
[ROW][C]16[/C][C]-0.095548[/C][C]-0.662[/C][C]0.255576[/C][/ROW]
[ROW][C]17[/C][C]-0.158169[/C][C]-1.0958[/C][C]0.139311[/C][/ROW]
[ROW][C]18[/C][C]-0.211829[/C][C]-1.4676[/C][C]0.074368[/C][/ROW]
[ROW][C]19[/C][C]-0.239952[/C][C]-1.6624[/C][C]0.051471[/C][/ROW]
[ROW][C]20[/C][C]-0.114991[/C][C]-0.7967[/C][C]0.21478[/C][/ROW]
[ROW][C]21[/C][C]-0.028916[/C][C]-0.2003[/C][C]0.421032[/C][/ROW]
[ROW][C]22[/C][C]-0.008896[/C][C]-0.0616[/C][C]0.475555[/C][/ROW]
[ROW][C]23[/C][C]0.141131[/C][C]0.9778[/C][C]0.166542[/C][/ROW]
[ROW][C]24[/C][C]0.407851[/C][C]2.8257[/C][C]0.003428[/C][/ROW]
[ROW][C]25[/C][C]0.161679[/C][C]1.1201[/C][C]0.134112[/C][/ROW]
[ROW][C]26[/C][C]0.063076[/C][C]0.437[/C][C]0.332034[/C][/ROW]
[ROW][C]27[/C][C]0.008895[/C][C]0.0616[/C][C]0.475559[/C][/ROW]
[ROW][C]28[/C][C]-0.10578[/C][C]-0.7329[/C][C]0.233602[/C][/ROW]
[ROW][C]29[/C][C]-0.151492[/C][C]-1.0496[/C][C]0.149586[/C][/ROW]
[ROW][C]30[/C][C]-0.204282[/C][C]-1.4153[/C][C]0.081717[/C][/ROW]
[ROW][C]31[/C][C]-0.219858[/C][C]-1.5232[/C][C]0.067132[/C][/ROW]
[ROW][C]32[/C][C]-0.142579[/C][C]-0.9878[/C][C]0.164098[/C][/ROW]
[ROW][C]33[/C][C]-0.109548[/C][C]-0.759[/C][C]0.225791[/C][/ROW]
[ROW][C]34[/C][C]-0.101456[/C][C]-0.7029[/C][C]0.242755[/C][/ROW]
[ROW][C]35[/C][C]-0.023122[/C][C]-0.1602[/C][C]0.436699[/C][/ROW]
[ROW][C]36[/C][C]0.124031[/C][C]0.8593[/C][C]0.19722[/C][/ROW]
[ROW][C]37[/C][C]0.017744[/C][C]0.1229[/C][C]0.451336[/C][/ROW]
[ROW][C]38[/C][C]-0.028217[/C][C]-0.1955[/C][C]0.422917[/C][/ROW]
[ROW][C]39[/C][C]-0.058785[/C][C]-0.4073[/C][C]0.342808[/C][/ROW]
[ROW][C]40[/C][C]-0.096702[/C][C]-0.67[/C][C]0.253043[/C][/ROW]
[ROW][C]41[/C][C]-0.117382[/C][C]-0.8132[/C][C]0.210045[/C][/ROW]
[ROW][C]42[/C][C]-0.146666[/C][C]-1.0161[/C][C]0.157331[/C][/ROW]
[ROW][C]43[/C][C]-0.153876[/C][C]-1.0661[/C][C]0.145859[/C][/ROW]
[ROW][C]44[/C][C]-0.134992[/C][C]-0.9353[/C][C]0.177169[/C][/ROW]
[ROW][C]45[/C][C]-0.115118[/C][C]-0.7976[/C][C]0.214527[/C][/ROW]
[ROW][C]46[/C][C]-0.099926[/C][C]-0.6923[/C][C]0.24604[/C][/ROW]
[ROW][C]47[/C][C]-0.058557[/C][C]-0.4057[/C][C]0.343385[/C][/ROW]
[ROW][C]48[/C][C]NA[/C][C]NA[/C][C]NA[/C][/ROW]
[/TABLE]
Source: https://freestatistics.org/blog/index.php?pk=190012&T=1

Globally Unique Identifier (entire table): ba.freestatistics.org/blog/index.php?pk=190012&T=1

As an alternative you can also use a QR Code:  

The GUIDs for individual cells are displayed in the table below:

Autocorrelation Function
Time lag kACF(k)T-STATP-value
10.4949363.4290.000627
20.2837391.96580.02756
30.2180351.51060.068724
4-0.001798-0.01250.495056
5-0.149361-1.03480.152973
6-0.206254-1.4290.079745
7-0.225854-1.56480.062104
8-0.106377-0.7370.232354
90.0298490.20680.418521
100.022680.15710.437901
110.1884861.30590.098911
120.5902494.08948.2e-05
130.2182691.51220.068518
140.0837310.58010.282278
150.0619030.42890.334966
16-0.095548-0.6620.255576
17-0.158169-1.09580.139311
18-0.211829-1.46760.074368
19-0.239952-1.66240.051471
20-0.114991-0.79670.21478
21-0.028916-0.20030.421032
22-0.008896-0.06160.475555
230.1411310.97780.166542
240.4078512.82570.003428
250.1616791.12010.134112
260.0630760.4370.332034
270.0088950.06160.475559
28-0.10578-0.73290.233602
29-0.151492-1.04960.149586
30-0.204282-1.41530.081717
31-0.219858-1.52320.067132
32-0.142579-0.98780.164098
33-0.109548-0.7590.225791
34-0.101456-0.70290.242755
35-0.023122-0.16020.436699
360.1240310.85930.19722
370.0177440.12290.451336
38-0.028217-0.19550.422917
39-0.058785-0.40730.342808
40-0.096702-0.670.253043
41-0.117382-0.81320.210045
42-0.146666-1.01610.157331
43-0.153876-1.06610.145859
44-0.134992-0.93530.177169
45-0.115118-0.79760.214527
46-0.099926-0.69230.24604
47-0.058557-0.40570.343385
48NANANA


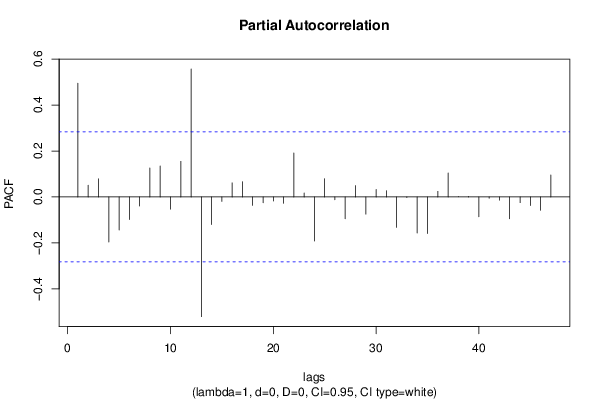
Partial Autocorrelation Function
Time lag kPACF(k)T-STATP-value
10.4949363.4290.000627
20.0513580.35580.361767
30.0788740.54650.293642
4-0.195612-1.35520.090843
5-0.143985-0.99760.161748
6-0.097937-0.67850.250349
7-0.039067-0.27070.393906
80.1264560.87610.192666
90.1348430.93420.177433
10-0.053014-0.36730.357508
110.1549871.07380.144145
120.5571793.86030.000169
13-0.520776-3.6080.000367
14-0.119492-0.82790.205923
15-0.019058-0.1320.447753
160.061420.42550.336175
170.0662040.45870.324269
18-0.036439-0.25250.400884
19-0.025487-0.17660.430292
20-0.017174-0.1190.452892
21-0.027083-0.18760.425977
220.1912111.32480.095763
230.0174560.12090.452121
24-0.191382-1.32590.095568
250.079130.54820.293039
26-0.012186-0.08440.466534
27-0.095019-0.65830.256742
280.0495290.34310.366494
29-0.074573-0.51670.303885
300.0322610.22350.412044
310.0269890.1870.42623
32-0.132328-0.91680.181917
33-0.002102-0.01460.49422
34-0.156607-1.0850.14167
35-0.158982-1.10150.138094
360.0244890.16970.432994
370.1045010.7240.236289
380.0004780.00330.498686
390.0020560.01420.494346
40-0.086022-0.5960.276996
41-0.00592-0.0410.483727
42-0.013715-0.0950.462348
43-0.095031-0.65840.256714
44-0.02469-0.17110.432448
45-0.037011-0.25640.399362
46-0.057706-0.39980.345539
470.0960140.66520.254551
48NANANA

\begin{tabular}{lllllllll}
\hline
Partial Autocorrelation Function \tabularnewline
Time lag k & PACF(k) & T-STAT & P-value \tabularnewline
1 & 0.494936 & 3.429 & 0.000627 \tabularnewline
2 & 0.051358 & 0.3558 & 0.361767 \tabularnewline
3 & 0.078874 & 0.5465 & 0.293642 \tabularnewline
4 & -0.195612 & -1.3552 & 0.090843 \tabularnewline
5 & -0.143985 & -0.9976 & 0.161748 \tabularnewline
6 & -0.097937 & -0.6785 & 0.250349 \tabularnewline
7 & -0.039067 & -0.2707 & 0.393906 \tabularnewline
8 & 0.126456 & 0.8761 & 0.192666 \tabularnewline
9 & 0.134843 & 0.9342 & 0.177433 \tabularnewline
10 & -0.053014 & -0.3673 & 0.357508 \tabularnewline
11 & 0.154987 & 1.0738 & 0.144145 \tabularnewline
12 & 0.557179 & 3.8603 & 0.000169 \tabularnewline
13 & -0.520776 & -3.608 & 0.000367 \tabularnewline
14 & -0.119492 & -0.8279 & 0.205923 \tabularnewline
15 & -0.019058 & -0.132 & 0.447753 \tabularnewline
16 & 0.06142 & 0.4255 & 0.336175 \tabularnewline
17 & 0.066204 & 0.4587 & 0.324269 \tabularnewline
18 & -0.036439 & -0.2525 & 0.400884 \tabularnewline
19 & -0.025487 & -0.1766 & 0.430292 \tabularnewline
20 & -0.017174 & -0.119 & 0.452892 \tabularnewline
21 & -0.027083 & -0.1876 & 0.425977 \tabularnewline
22 & 0.191211 & 1.3248 & 0.095763 \tabularnewline
23 & 0.017456 & 0.1209 & 0.452121 \tabularnewline
24 & -0.191382 & -1.3259 & 0.095568 \tabularnewline
25 & 0.07913 & 0.5482 & 0.293039 \tabularnewline
26 & -0.012186 & -0.0844 & 0.466534 \tabularnewline
27 & -0.095019 & -0.6583 & 0.256742 \tabularnewline
28 & 0.049529 & 0.3431 & 0.366494 \tabularnewline
29 & -0.074573 & -0.5167 & 0.303885 \tabularnewline
30 & 0.032261 & 0.2235 & 0.412044 \tabularnewline
31 & 0.026989 & 0.187 & 0.42623 \tabularnewline
32 & -0.132328 & -0.9168 & 0.181917 \tabularnewline
33 & -0.002102 & -0.0146 & 0.49422 \tabularnewline
34 & -0.156607 & -1.085 & 0.14167 \tabularnewline
35 & -0.158982 & -1.1015 & 0.138094 \tabularnewline
36 & 0.024489 & 0.1697 & 0.432994 \tabularnewline
37 & 0.104501 & 0.724 & 0.236289 \tabularnewline
38 & 0.000478 & 0.0033 & 0.498686 \tabularnewline
39 & 0.002056 & 0.0142 & 0.494346 \tabularnewline
40 & -0.086022 & -0.596 & 0.276996 \tabularnewline
41 & -0.00592 & -0.041 & 0.483727 \tabularnewline
42 & -0.013715 & -0.095 & 0.462348 \tabularnewline
43 & -0.095031 & -0.6584 & 0.256714 \tabularnewline
44 & -0.02469 & -0.1711 & 0.432448 \tabularnewline
45 & -0.037011 & -0.2564 & 0.399362 \tabularnewline
46 & -0.057706 & -0.3998 & 0.345539 \tabularnewline
47 & 0.096014 & 0.6652 & 0.254551 \tabularnewline
48 & NA & NA & NA \tabularnewline
\hline
\end{tabular}
%Source: https://freestatistics.org/blog/index.php?pk=190012&T=2

[TABLE]
[ROW][C]Partial Autocorrelation Function[/C][/ROW]
[ROW][C]Time lag k[/C][C]PACF(k)[/C][C]T-STAT[/C][C]P-value[/C][/ROW]
[ROW][C]1[/C][C]0.494936[/C][C]3.429[/C][C]0.000627[/C][/ROW]
[ROW][C]2[/C][C]0.051358[/C][C]0.3558[/C][C]0.361767[/C][/ROW]
[ROW][C]3[/C][C]0.078874[/C][C]0.5465[/C][C]0.293642[/C][/ROW]
[ROW][C]4[/C][C]-0.195612[/C][C]-1.3552[/C][C]0.090843[/C][/ROW]
[ROW][C]5[/C][C]-0.143985[/C][C]-0.9976[/C][C]0.161748[/C][/ROW]
[ROW][C]6[/C][C]-0.097937[/C][C]-0.6785[/C][C]0.250349[/C][/ROW]
[ROW][C]7[/C][C]-0.039067[/C][C]-0.2707[/C][C]0.393906[/C][/ROW]
[ROW][C]8[/C][C]0.126456[/C][C]0.8761[/C][C]0.192666[/C][/ROW]
[ROW][C]9[/C][C]0.134843[/C][C]0.9342[/C][C]0.177433[/C][/ROW]
[ROW][C]10[/C][C]-0.053014[/C][C]-0.3673[/C][C]0.357508[/C][/ROW]
[ROW][C]11[/C][C]0.154987[/C][C]1.0738[/C][C]0.144145[/C][/ROW]
[ROW][C]12[/C][C]0.557179[/C][C]3.8603[/C][C]0.000169[/C][/ROW]
[ROW][C]13[/C][C]-0.520776[/C][C]-3.608[/C][C]0.000367[/C][/ROW]
[ROW][C]14[/C][C]-0.119492[/C][C]-0.8279[/C][C]0.205923[/C][/ROW]
[ROW][C]15[/C][C]-0.019058[/C][C]-0.132[/C][C]0.447753[/C][/ROW]
[ROW][C]16[/C][C]0.06142[/C][C]0.4255[/C][C]0.336175[/C][/ROW]
[ROW][C]17[/C][C]0.066204[/C][C]0.4587[/C][C]0.324269[/C][/ROW]
[ROW][C]18[/C][C]-0.036439[/C][C]-0.2525[/C][C]0.400884[/C][/ROW]
[ROW][C]19[/C][C]-0.025487[/C][C]-0.1766[/C][C]0.430292[/C][/ROW]
[ROW][C]20[/C][C]-0.017174[/C][C]-0.119[/C][C]0.452892[/C][/ROW]
[ROW][C]21[/C][C]-0.027083[/C][C]-0.1876[/C][C]0.425977[/C][/ROW]
[ROW][C]22[/C][C]0.191211[/C][C]1.3248[/C][C]0.095763[/C][/ROW]
[ROW][C]23[/C][C]0.017456[/C][C]0.1209[/C][C]0.452121[/C][/ROW]
[ROW][C]24[/C][C]-0.191382[/C][C]-1.3259[/C][C]0.095568[/C][/ROW]
[ROW][C]25[/C][C]0.07913[/C][C]0.5482[/C][C]0.293039[/C][/ROW]
[ROW][C]26[/C][C]-0.012186[/C][C]-0.0844[/C][C]0.466534[/C][/ROW]
[ROW][C]27[/C][C]-0.095019[/C][C]-0.6583[/C][C]0.256742[/C][/ROW]
[ROW][C]28[/C][C]0.049529[/C][C]0.3431[/C][C]0.366494[/C][/ROW]
[ROW][C]29[/C][C]-0.074573[/C][C]-0.5167[/C][C]0.303885[/C][/ROW]
[ROW][C]30[/C][C]0.032261[/C][C]0.2235[/C][C]0.412044[/C][/ROW]
[ROW][C]31[/C][C]0.026989[/C][C]0.187[/C][C]0.42623[/C][/ROW]
[ROW][C]32[/C][C]-0.132328[/C][C]-0.9168[/C][C]0.181917[/C][/ROW]
[ROW][C]33[/C][C]-0.002102[/C][C]-0.0146[/C][C]0.49422[/C][/ROW]
[ROW][C]34[/C][C]-0.156607[/C][C]-1.085[/C][C]0.14167[/C][/ROW]
[ROW][C]35[/C][C]-0.158982[/C][C]-1.1015[/C][C]0.138094[/C][/ROW]
[ROW][C]36[/C][C]0.024489[/C][C]0.1697[/C][C]0.432994[/C][/ROW]
[ROW][C]37[/C][C]0.104501[/C][C]0.724[/C][C]0.236289[/C][/ROW]
[ROW][C]38[/C][C]0.000478[/C][C]0.0033[/C][C]0.498686[/C][/ROW]
[ROW][C]39[/C][C]0.002056[/C][C]0.0142[/C][C]0.494346[/C][/ROW]
[ROW][C]40[/C][C]-0.086022[/C][C]-0.596[/C][C]0.276996[/C][/ROW]
[ROW][C]41[/C][C]-0.00592[/C][C]-0.041[/C][C]0.483727[/C][/ROW]
[ROW][C]42[/C][C]-0.013715[/C][C]-0.095[/C][C]0.462348[/C][/ROW]
[ROW][C]43[/C][C]-0.095031[/C][C]-0.6584[/C][C]0.256714[/C][/ROW]
[ROW][C]44[/C][C]-0.02469[/C][C]-0.1711[/C][C]0.432448[/C][/ROW]
[ROW][C]45[/C][C]-0.037011[/C][C]-0.2564[/C][C]0.399362[/C][/ROW]
[ROW][C]46[/C][C]-0.057706[/C][C]-0.3998[/C][C]0.345539[/C][/ROW]
[ROW][C]47[/C][C]0.096014[/C][C]0.6652[/C][C]0.254551[/C][/ROW]
[ROW][C]48[/C][C]NA[/C][C]NA[/C][C]NA[/C][/ROW]
[/TABLE]
Source: https://freestatistics.org/blog/index.php?pk=190012&T=2

Globally Unique Identifier (entire table): ba.freestatistics.org/blog/index.php?pk=190012&T=2

As an alternative you can also use a QR Code:  

The GUIDs for individual cells are displayed in the table below:

Partial Autocorrelation Function
Time lag kPACF(k)T-STATP-value
10.4949363.4290.000627
20.0513580.35580.361767
30.0788740.54650.293642
4-0.195612-1.35520.090843
5-0.143985-0.99760.161748
6-0.097937-0.67850.250349
7-0.039067-0.27070.393906
80.1264560.87610.192666
90.1348430.93420.177433
10-0.053014-0.36730.357508
110.1549871.07380.144145
120.5571793.86030.000169
13-0.520776-3.6080.000367
14-0.119492-0.82790.205923
15-0.019058-0.1320.447753
160.061420.42550.336175
170.0662040.45870.324269
18-0.036439-0.25250.400884
19-0.025487-0.17660.430292
20-0.017174-0.1190.452892
21-0.027083-0.18760.425977
220.1912111.32480.095763
230.0174560.12090.452121
24-0.191382-1.32590.095568
250.079130.54820.293039
26-0.012186-0.08440.466534
27-0.095019-0.65830.256742
280.0495290.34310.366494
29-0.074573-0.51670.303885
300.0322610.22350.412044
310.0269890.1870.42623
32-0.132328-0.91680.181917
33-0.002102-0.01460.49422
34-0.156607-1.0850.14167
35-0.158982-1.10150.138094
360.0244890.16970.432994
370.1045010.7240.236289
380.0004780.00330.498686
390.0020560.01420.494346
40-0.086022-0.5960.276996
41-0.00592-0.0410.483727
42-0.013715-0.0950.462348
43-0.095031-0.65840.256714
44-0.02469-0.17110.432448
45-0.037011-0.25640.399362
46-0.057706-0.39980.345539
470.0960140.66520.254551
48NANANA


Parameters (Session):
par1 = 48 ; par2 = 1 ; par3 = 0 ; par4 = 0 ; par5 = 12 ; par6 = White Noise ; par7 = 0.95 ;
Parameters (R input):
par1 = 48 ; par2 = 1 ; par3 = 0 ; par4 = 0 ; par5 = 12 ; par6 = White Noise ; par7 = 0.95 ; par8 = ;
R code (references can be found in the software module):
if (par1 == 'Default') {
par1 = 10*log10(length(x))
} else {
par1 <- as.numeric(par1)
}
par2 <- as.numeric(par2)
par3 <- as.numeric(par3)
par4 <- as.numeric(par4)
par5 <- as.numeric(par5)
if (par6 == 'White Noise') par6 <- 'white' else par6 <- 'ma'
par7 <- as.numeric(par7)
if (par8 != '') par8 <- as.numeric(par8)
ox <- x
if (par8 == '') {
if (par2 == 0) {
x <- log(x)
} else {
x <- (x ^ par2 - 1) / par2
}
} else {
x <- log(x,base=par8)
}
if (par3 > 0) x <- diff(x,lag=1,difference=par3)
if (par4 > 0) x <- diff(x,lag=par5,difference=par4)
bitmap(file='picts.png')
op <- par(mfrow=c(2,1))
plot(ox,type='l',main='Original Time Series',xlab='time',ylab='value')
if (par8=='') {
mytitle <- paste('Working Time Series (lambda=',par2,', d=',par3,', D=',par4,')',sep='')
mysub <- paste('(lambda=',par2,', d=',par3,', D=',par4,', CI=', par7, ', CI type=',par6,')',sep='')
} else {
mytitle <- paste('Working Time Series (base=',par8,', d=',par3,', D=',par4,')',sep='')
mysub <- paste('(base=',par8,', d=',par3,', D=',par4,', CI=', par7, ', CI type=',par6,')',sep='')
}
plot(x,type='l', main=mytitle,xlab='time',ylab='value')
par(op)
dev.off()
bitmap(file='pic1.png')
racf <- acf(x, par1, main='Autocorrelation', xlab='time lag', ylab='ACF', ci.type=par6, ci=par7, sub=mysub)
dev.off()
bitmap(file='pic2.png')
rpacf <- pacf(x,par1,main='Partial Autocorrelation',xlab='lags',ylab='PACF',sub=mysub)
dev.off()
(myacf <- c(racf$acf))
(mypacf <- c(rpacf$acf))
lengthx <- length(x)
sqrtn <- sqrt(lengthx)
load(file='createtable')
a<-table.start()
a<-table.row.start(a)
a<-table.element(a,'Autocorrelation Function',4,TRUE)
a<-table.row.end(a)
a<-table.row.start(a)
a<-table.element(a,'Time lag k',header=TRUE)
a<-table.element(a,hyperlink('basics.htm','ACF(k)','click here for more information about the Autocorrelation Function'),header=TRUE)
a<-table.element(a,'T-STAT',header=TRUE)
a<-table.element(a,'P-value',header=TRUE)
a<-table.row.end(a)
for (i in 2:(par1+1)) {
a<-table.row.start(a)
a<-table.element(a,i-1,header=TRUE)
a<-table.element(a,round(myacf[i],6))
mytstat <- myacf[i]*sqrtn
a<-table.element(a,round(mytstat,4))
a<-table.element(a,round(1-pt(abs(mytstat),lengthx),6))
a<-table.row.end(a)
}
a<-table.end(a)
table.save(a,file='mytable.tab')
a<-table.start()
a<-table.row.start(a)
a<-table.element(a,'Partial Autocorrelation Function',4,TRUE)
a<-table.row.end(a)
a<-table.row.start(a)
a<-table.element(a,'Time lag k',header=TRUE)
a<-table.element(a,hyperlink('basics.htm','PACF(k)','click here for more information about the Partial Autocorrelation Function'),header=TRUE)
a<-table.element(a,'T-STAT',header=TRUE)
a<-table.element(a,'P-value',header=TRUE)
a<-table.row.end(a)
for (i in 1:par1) {
a<-table.row.start(a)
a<-table.element(a,i,header=TRUE)
a<-table.element(a,round(mypacf[i],6))
mytstat <- mypacf[i]*sqrtn
a<-table.element(a,round(mytstat,4))
a<-table.element(a,round(1-pt(abs(mytstat),lengthx),6))
a<-table.row.end(a)
}
a<-table.end(a)
table.save(a,file='mytable1.tab')