Free Statistics

of Irreproducible Research!

Author's title

Author*Unverified author*
R Software Modulerwasp_autocorrelation.wasp
Title produced by software(Partial) Autocorrelation Function
Date of computationFri, 16 Nov 2012 14:23:17 -0500
Cite this page as followsStatistical Computations at FreeStatistics.org, Office for Research Development and Education, URL https://freestatistics.org/blog/index.php?v=date/2012/Nov/16/t1353093877y7yt55gnzpuxq61.htm/, Retrieved Sat, 27 Apr 2024 10:46:43 +0000
Statistical Computations at FreeStatistics.org, Office for Research Development and Education, URL https://freestatistics.org/blog/index.php?pk=189992, Retrieved Sat, 27 Apr 2024 10:46:43 +0000
QR Codes:

Original text written by user:
IsPrivate?No (this computation is public)
User-defined keywords
Estimated Impact58
Family? (F = Feedback message, R = changed R code, M = changed R Module, P = changed Parameters, D = changed Data)
-       [(Partial) Autocorrelation Function] [gemiddeldeprijs s...] [2012-11-16 19:23:17] [b973758fc1658916c4a7c8f7ddd22f57] [Current]
Feedback Forum

Post a new message
Dataseries X:
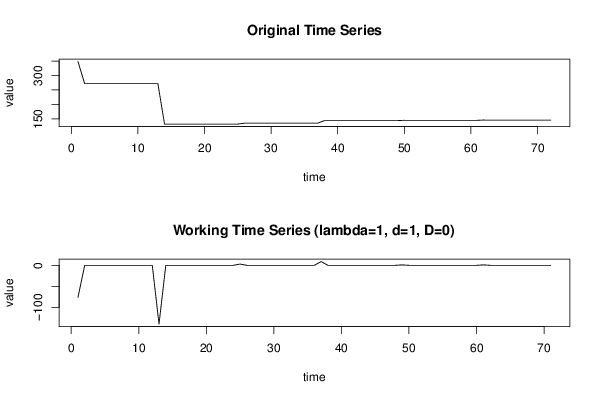
348.33
272
272
272
272
272
272
272
272
272
272
272
272
132
132
132
132
132
132
132
132
132
132
132
132
135
135
135
135
135
135
135
135
135
135
135
135
144
144
144
144
144
144
144
144
144
144
144
144
145
145
145
145
145
145
145
145
145
145
145
145
146
146
146
146
146
146
146
146
146
146
146


Summary of computational transaction
Raw Inputview raw input (R code)
Raw Outputview raw output of R engine
Computing time3 seconds
R Server'Sir Ronald Aylmer Fisher' @ fisher.wessa.net

\begin{tabular}{lllllllll}
\hline
Summary of computational transaction \tabularnewline
Raw Input & view raw input (R code)  \tabularnewline
Raw Output & view raw output of R engine  \tabularnewline
Computing time & 3 seconds \tabularnewline
R Server & 'Sir Ronald Aylmer Fisher' @ fisher.wessa.net \tabularnewline
\hline
\end{tabular}
%Source: https://freestatistics.org/blog/index.php?pk=189992&T=0

[TABLE]
[ROW][C]Summary of computational transaction[/C][/ROW]
[ROW][C]Raw Input[/C][C]view raw input (R code) [/C][/ROW]
[ROW][C]Raw Output[/C][C]view raw output of R engine [/C][/ROW]
[ROW][C]Computing time[/C][C]3 seconds[/C][/ROW]
[ROW][C]R Server[/C][C]'Sir Ronald Aylmer Fisher' @ fisher.wessa.net[/C][/ROW]
[/TABLE]
Source: https://freestatistics.org/blog/index.php?pk=189992&T=0

Globally Unique Identifier (entire table): ba.freestatistics.org/blog/index.php?pk=189992&T=0

As an alternative you can also use a QR Code:  

The GUIDs for individual cells are displayed in the table below:

Summary of computational transaction
Raw Inputview raw input (R code)
Raw Outputview raw output of R engine
Computing time3 seconds
R Server'Sir Ronald Aylmer Fisher' @ fisher.wessa.net


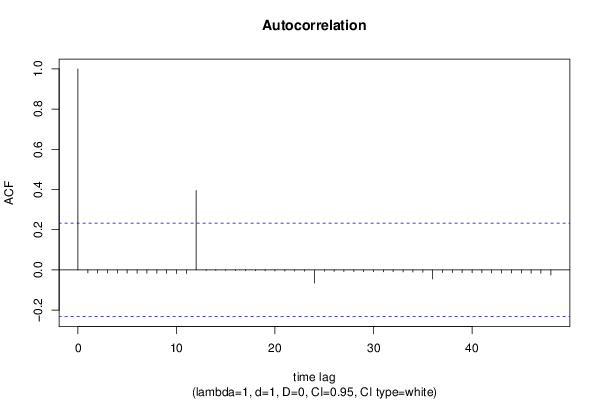
Autocorrelation Function
Time lag kACF(k)T-STATP-value
1-0.014722-0.1240.450814
2-0.015047-0.12680.449732
3-0.015373-0.12950.44865
4-0.015699-0.13230.447569
5-0.016024-0.1350.446488
6-0.01635-0.13780.445408
7-0.016675-0.14050.444328
8-0.017001-0.14330.443248
9-0.017327-0.1460.442169
10-0.017652-0.14870.44109
11-0.018092-0.15240.439634
120.3946743.32567e-04
13-0.002747-0.02320.490798
14-0.003073-0.02590.489707
15-0.003399-0.02860.488617
16-0.003724-0.03140.487527
17-0.00405-0.03410.486437
18-0.004375-0.03690.485347
19-0.004701-0.03960.484257
20-0.005027-0.04240.483167
21-0.005352-0.04510.482078
22-0.005678-0.04780.480988
23-0.006118-0.05150.479517
24-0.065661-0.55330.290909
25-0.007112-0.05990.476193
26-0.007437-0.06270.475104
27-0.007763-0.06540.474016
28-0.008088-0.06820.472927
29-0.008414-0.07090.471839
30-0.00874-0.07360.470752
31-0.009065-0.07640.469664
32-0.009391-0.07910.468577
33-0.009716-0.08190.46749
34-0.010042-0.08460.466403
35-0.011396-0.0960.461886
36-0.044757-0.37710.3536
37-0.013075-0.11020.456291
38-0.013401-0.11290.455207
39-0.013727-0.11570.454124
40-0.014052-0.11840.45304
41-0.014378-0.12110.451958
42-0.014703-0.12390.450875
43-0.015029-0.12660.449793
44-0.015354-0.12940.448712
45-0.01568-0.13210.44763
46-0.016006-0.13490.44655
47-0.016674-0.14050.444332
48-0.025673-0.21630.414677

\begin{tabular}{lllllllll}
\hline
Autocorrelation Function \tabularnewline
Time lag k & ACF(k) & T-STAT & P-value \tabularnewline
1 & -0.014722 & -0.124 & 0.450814 \tabularnewline
2 & -0.015047 & -0.1268 & 0.449732 \tabularnewline
3 & -0.015373 & -0.1295 & 0.44865 \tabularnewline
4 & -0.015699 & -0.1323 & 0.447569 \tabularnewline
5 & -0.016024 & -0.135 & 0.446488 \tabularnewline
6 & -0.01635 & -0.1378 & 0.445408 \tabularnewline
7 & -0.016675 & -0.1405 & 0.444328 \tabularnewline
8 & -0.017001 & -0.1433 & 0.443248 \tabularnewline
9 & -0.017327 & -0.146 & 0.442169 \tabularnewline
10 & -0.017652 & -0.1487 & 0.44109 \tabularnewline
11 & -0.018092 & -0.1524 & 0.439634 \tabularnewline
12 & 0.394674 & 3.3256 & 7e-04 \tabularnewline
13 & -0.002747 & -0.0232 & 0.490798 \tabularnewline
14 & -0.003073 & -0.0259 & 0.489707 \tabularnewline
15 & -0.003399 & -0.0286 & 0.488617 \tabularnewline
16 & -0.003724 & -0.0314 & 0.487527 \tabularnewline
17 & -0.00405 & -0.0341 & 0.486437 \tabularnewline
18 & -0.004375 & -0.0369 & 0.485347 \tabularnewline
19 & -0.004701 & -0.0396 & 0.484257 \tabularnewline
20 & -0.005027 & -0.0424 & 0.483167 \tabularnewline
21 & -0.005352 & -0.0451 & 0.482078 \tabularnewline
22 & -0.005678 & -0.0478 & 0.480988 \tabularnewline
23 & -0.006118 & -0.0515 & 0.479517 \tabularnewline
24 & -0.065661 & -0.5533 & 0.290909 \tabularnewline
25 & -0.007112 & -0.0599 & 0.476193 \tabularnewline
26 & -0.007437 & -0.0627 & 0.475104 \tabularnewline
27 & -0.007763 & -0.0654 & 0.474016 \tabularnewline
28 & -0.008088 & -0.0682 & 0.472927 \tabularnewline
29 & -0.008414 & -0.0709 & 0.471839 \tabularnewline
30 & -0.00874 & -0.0736 & 0.470752 \tabularnewline
31 & -0.009065 & -0.0764 & 0.469664 \tabularnewline
32 & -0.009391 & -0.0791 & 0.468577 \tabularnewline
33 & -0.009716 & -0.0819 & 0.46749 \tabularnewline
34 & -0.010042 & -0.0846 & 0.466403 \tabularnewline
35 & -0.011396 & -0.096 & 0.461886 \tabularnewline
36 & -0.044757 & -0.3771 & 0.3536 \tabularnewline
37 & -0.013075 & -0.1102 & 0.456291 \tabularnewline
38 & -0.013401 & -0.1129 & 0.455207 \tabularnewline
39 & -0.013727 & -0.1157 & 0.454124 \tabularnewline
40 & -0.014052 & -0.1184 & 0.45304 \tabularnewline
41 & -0.014378 & -0.1211 & 0.451958 \tabularnewline
42 & -0.014703 & -0.1239 & 0.450875 \tabularnewline
43 & -0.015029 & -0.1266 & 0.449793 \tabularnewline
44 & -0.015354 & -0.1294 & 0.448712 \tabularnewline
45 & -0.01568 & -0.1321 & 0.44763 \tabularnewline
46 & -0.016006 & -0.1349 & 0.44655 \tabularnewline
47 & -0.016674 & -0.1405 & 0.444332 \tabularnewline
48 & -0.025673 & -0.2163 & 0.414677 \tabularnewline
\hline
\end{tabular}
%Source: https://freestatistics.org/blog/index.php?pk=189992&T=1

[TABLE]
[ROW][C]Autocorrelation Function[/C][/ROW]
[ROW][C]Time lag k[/C][C]ACF(k)[/C][C]T-STAT[/C][C]P-value[/C][/ROW]
[ROW][C]1[/C][C]-0.014722[/C][C]-0.124[/C][C]0.450814[/C][/ROW]
[ROW][C]2[/C][C]-0.015047[/C][C]-0.1268[/C][C]0.449732[/C][/ROW]
[ROW][C]3[/C][C]-0.015373[/C][C]-0.1295[/C][C]0.44865[/C][/ROW]
[ROW][C]4[/C][C]-0.015699[/C][C]-0.1323[/C][C]0.447569[/C][/ROW]
[ROW][C]5[/C][C]-0.016024[/C][C]-0.135[/C][C]0.446488[/C][/ROW]
[ROW][C]6[/C][C]-0.01635[/C][C]-0.1378[/C][C]0.445408[/C][/ROW]
[ROW][C]7[/C][C]-0.016675[/C][C]-0.1405[/C][C]0.444328[/C][/ROW]
[ROW][C]8[/C][C]-0.017001[/C][C]-0.1433[/C][C]0.443248[/C][/ROW]
[ROW][C]9[/C][C]-0.017327[/C][C]-0.146[/C][C]0.442169[/C][/ROW]
[ROW][C]10[/C][C]-0.017652[/C][C]-0.1487[/C][C]0.44109[/C][/ROW]
[ROW][C]11[/C][C]-0.018092[/C][C]-0.1524[/C][C]0.439634[/C][/ROW]
[ROW][C]12[/C][C]0.394674[/C][C]3.3256[/C][C]7e-04[/C][/ROW]
[ROW][C]13[/C][C]-0.002747[/C][C]-0.0232[/C][C]0.490798[/C][/ROW]
[ROW][C]14[/C][C]-0.003073[/C][C]-0.0259[/C][C]0.489707[/C][/ROW]
[ROW][C]15[/C][C]-0.003399[/C][C]-0.0286[/C][C]0.488617[/C][/ROW]
[ROW][C]16[/C][C]-0.003724[/C][C]-0.0314[/C][C]0.487527[/C][/ROW]
[ROW][C]17[/C][C]-0.00405[/C][C]-0.0341[/C][C]0.486437[/C][/ROW]
[ROW][C]18[/C][C]-0.004375[/C][C]-0.0369[/C][C]0.485347[/C][/ROW]
[ROW][C]19[/C][C]-0.004701[/C][C]-0.0396[/C][C]0.484257[/C][/ROW]
[ROW][C]20[/C][C]-0.005027[/C][C]-0.0424[/C][C]0.483167[/C][/ROW]
[ROW][C]21[/C][C]-0.005352[/C][C]-0.0451[/C][C]0.482078[/C][/ROW]
[ROW][C]22[/C][C]-0.005678[/C][C]-0.0478[/C][C]0.480988[/C][/ROW]
[ROW][C]23[/C][C]-0.006118[/C][C]-0.0515[/C][C]0.479517[/C][/ROW]
[ROW][C]24[/C][C]-0.065661[/C][C]-0.5533[/C][C]0.290909[/C][/ROW]
[ROW][C]25[/C][C]-0.007112[/C][C]-0.0599[/C][C]0.476193[/C][/ROW]
[ROW][C]26[/C][C]-0.007437[/C][C]-0.0627[/C][C]0.475104[/C][/ROW]
[ROW][C]27[/C][C]-0.007763[/C][C]-0.0654[/C][C]0.474016[/C][/ROW]
[ROW][C]28[/C][C]-0.008088[/C][C]-0.0682[/C][C]0.472927[/C][/ROW]
[ROW][C]29[/C][C]-0.008414[/C][C]-0.0709[/C][C]0.471839[/C][/ROW]
[ROW][C]30[/C][C]-0.00874[/C][C]-0.0736[/C][C]0.470752[/C][/ROW]
[ROW][C]31[/C][C]-0.009065[/C][C]-0.0764[/C][C]0.469664[/C][/ROW]
[ROW][C]32[/C][C]-0.009391[/C][C]-0.0791[/C][C]0.468577[/C][/ROW]
[ROW][C]33[/C][C]-0.009716[/C][C]-0.0819[/C][C]0.46749[/C][/ROW]
[ROW][C]34[/C][C]-0.010042[/C][C]-0.0846[/C][C]0.466403[/C][/ROW]
[ROW][C]35[/C][C]-0.011396[/C][C]-0.096[/C][C]0.461886[/C][/ROW]
[ROW][C]36[/C][C]-0.044757[/C][C]-0.3771[/C][C]0.3536[/C][/ROW]
[ROW][C]37[/C][C]-0.013075[/C][C]-0.1102[/C][C]0.456291[/C][/ROW]
[ROW][C]38[/C][C]-0.013401[/C][C]-0.1129[/C][C]0.455207[/C][/ROW]
[ROW][C]39[/C][C]-0.013727[/C][C]-0.1157[/C][C]0.454124[/C][/ROW]
[ROW][C]40[/C][C]-0.014052[/C][C]-0.1184[/C][C]0.45304[/C][/ROW]
[ROW][C]41[/C][C]-0.014378[/C][C]-0.1211[/C][C]0.451958[/C][/ROW]
[ROW][C]42[/C][C]-0.014703[/C][C]-0.1239[/C][C]0.450875[/C][/ROW]
[ROW][C]43[/C][C]-0.015029[/C][C]-0.1266[/C][C]0.449793[/C][/ROW]
[ROW][C]44[/C][C]-0.015354[/C][C]-0.1294[/C][C]0.448712[/C][/ROW]
[ROW][C]45[/C][C]-0.01568[/C][C]-0.1321[/C][C]0.44763[/C][/ROW]
[ROW][C]46[/C][C]-0.016006[/C][C]-0.1349[/C][C]0.44655[/C][/ROW]
[ROW][C]47[/C][C]-0.016674[/C][C]-0.1405[/C][C]0.444332[/C][/ROW]
[ROW][C]48[/C][C]-0.025673[/C][C]-0.2163[/C][C]0.414677[/C][/ROW]
[/TABLE]
Source: https://freestatistics.org/blog/index.php?pk=189992&T=1

Globally Unique Identifier (entire table): ba.freestatistics.org/blog/index.php?pk=189992&T=1

As an alternative you can also use a QR Code:  

The GUIDs for individual cells are displayed in the table below:

Autocorrelation Function
Time lag kACF(k)T-STATP-value
1-0.014722-0.1240.450814
2-0.015047-0.12680.449732
3-0.015373-0.12950.44865
4-0.015699-0.13230.447569
5-0.016024-0.1350.446488
6-0.01635-0.13780.445408
7-0.016675-0.14050.444328
8-0.017001-0.14330.443248
9-0.017327-0.1460.442169
10-0.017652-0.14870.44109
11-0.018092-0.15240.439634
120.3946743.32567e-04
13-0.002747-0.02320.490798
14-0.003073-0.02590.489707
15-0.003399-0.02860.488617
16-0.003724-0.03140.487527
17-0.00405-0.03410.486437
18-0.004375-0.03690.485347
19-0.004701-0.03960.484257
20-0.005027-0.04240.483167
21-0.005352-0.04510.482078
22-0.005678-0.04780.480988
23-0.006118-0.05150.479517
24-0.065661-0.55330.290909
25-0.007112-0.05990.476193
26-0.007437-0.06270.475104
27-0.007763-0.06540.474016
28-0.008088-0.06820.472927
29-0.008414-0.07090.471839
30-0.00874-0.07360.470752
31-0.009065-0.07640.469664
32-0.009391-0.07910.468577
33-0.009716-0.08190.46749
34-0.010042-0.08460.466403
35-0.011396-0.0960.461886
36-0.044757-0.37710.3536
37-0.013075-0.11020.456291
38-0.013401-0.11290.455207
39-0.013727-0.11570.454124
40-0.014052-0.11840.45304
41-0.014378-0.12110.451958
42-0.014703-0.12390.450875
43-0.015029-0.12660.449793
44-0.015354-0.12940.448712
45-0.01568-0.13210.44763
46-0.016006-0.13490.44655
47-0.016674-0.14050.444332
48-0.025673-0.21630.414677


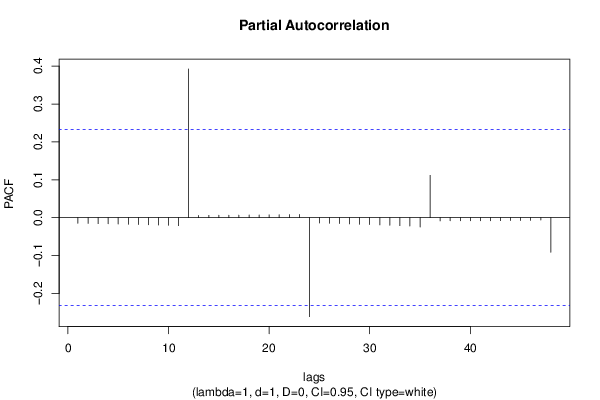
Partial Autocorrelation Function
Time lag kPACF(k)T-STATP-value
1-0.014722-0.1240.450814
2-0.015267-0.12860.449001
3-0.01583-0.13340.447134
4-0.01641-0.13830.445208
5-0.017009-0.14330.443222
6-0.017628-0.14850.44117
7-0.018269-0.15390.439048
8-0.018933-0.15950.436851
9-0.019622-0.16530.434574
10-0.020337-0.17140.432212
11-0.021196-0.17860.42938
120.3925693.30780.000739
130.0057410.04840.480778
140.0059280.04990.480152
150.0061090.05150.479545
160.0063050.05310.478888
170.0065180.05490.478179
180.0067460.05680.477416
190.0069910.05890.476596
200.0072540.06110.475718
210.0075340.06350.474779
220.0078340.0660.473778
230.0081280.06850.472795
24-0.261492-2.20340.015407
25-0.014221-0.11980.452479
26-0.014995-0.12630.449908
27-0.015772-0.13290.447326
28-0.016581-0.13970.44464
29-0.017425-0.14680.441843
30-0.018305-0.15420.438928
31-0.019225-0.1620.435885
32-0.020188-0.17010.432705
33-0.021196-0.17860.429378
34-0.022255-0.18750.425892
35-0.024649-0.20770.41803
360.1115650.94010.175186
37-0.008582-0.07230.471279
38-0.008497-0.07160.471561
39-0.008434-0.07110.471773
40-0.00835-0.07040.472054
41-0.008244-0.06950.472408
42-0.008114-0.06840.472841
43-0.00796-0.06710.473357
44-0.007779-0.06560.47396
45-0.007571-0.06380.474656
46-0.007334-0.06180.475449
47-0.006105-0.05140.479559
48-0.091512-0.77110.221606

\begin{tabular}{lllllllll}
\hline
Partial Autocorrelation Function \tabularnewline
Time lag k & PACF(k) & T-STAT & P-value \tabularnewline
1 & -0.014722 & -0.124 & 0.450814 \tabularnewline
2 & -0.015267 & -0.1286 & 0.449001 \tabularnewline
3 & -0.01583 & -0.1334 & 0.447134 \tabularnewline
4 & -0.01641 & -0.1383 & 0.445208 \tabularnewline
5 & -0.017009 & -0.1433 & 0.443222 \tabularnewline
6 & -0.017628 & -0.1485 & 0.44117 \tabularnewline
7 & -0.018269 & -0.1539 & 0.439048 \tabularnewline
8 & -0.018933 & -0.1595 & 0.436851 \tabularnewline
9 & -0.019622 & -0.1653 & 0.434574 \tabularnewline
10 & -0.020337 & -0.1714 & 0.432212 \tabularnewline
11 & -0.021196 & -0.1786 & 0.42938 \tabularnewline
12 & 0.392569 & 3.3078 & 0.000739 \tabularnewline
13 & 0.005741 & 0.0484 & 0.480778 \tabularnewline
14 & 0.005928 & 0.0499 & 0.480152 \tabularnewline
15 & 0.006109 & 0.0515 & 0.479545 \tabularnewline
16 & 0.006305 & 0.0531 & 0.478888 \tabularnewline
17 & 0.006518 & 0.0549 & 0.478179 \tabularnewline
18 & 0.006746 & 0.0568 & 0.477416 \tabularnewline
19 & 0.006991 & 0.0589 & 0.476596 \tabularnewline
20 & 0.007254 & 0.0611 & 0.475718 \tabularnewline
21 & 0.007534 & 0.0635 & 0.474779 \tabularnewline
22 & 0.007834 & 0.066 & 0.473778 \tabularnewline
23 & 0.008128 & 0.0685 & 0.472795 \tabularnewline
24 & -0.261492 & -2.2034 & 0.015407 \tabularnewline
25 & -0.014221 & -0.1198 & 0.452479 \tabularnewline
26 & -0.014995 & -0.1263 & 0.449908 \tabularnewline
27 & -0.015772 & -0.1329 & 0.447326 \tabularnewline
28 & -0.016581 & -0.1397 & 0.44464 \tabularnewline
29 & -0.017425 & -0.1468 & 0.441843 \tabularnewline
30 & -0.018305 & -0.1542 & 0.438928 \tabularnewline
31 & -0.019225 & -0.162 & 0.435885 \tabularnewline
32 & -0.020188 & -0.1701 & 0.432705 \tabularnewline
33 & -0.021196 & -0.1786 & 0.429378 \tabularnewline
34 & -0.022255 & -0.1875 & 0.425892 \tabularnewline
35 & -0.024649 & -0.2077 & 0.41803 \tabularnewline
36 & 0.111565 & 0.9401 & 0.175186 \tabularnewline
37 & -0.008582 & -0.0723 & 0.471279 \tabularnewline
38 & -0.008497 & -0.0716 & 0.471561 \tabularnewline
39 & -0.008434 & -0.0711 & 0.471773 \tabularnewline
40 & -0.00835 & -0.0704 & 0.472054 \tabularnewline
41 & -0.008244 & -0.0695 & 0.472408 \tabularnewline
42 & -0.008114 & -0.0684 & 0.472841 \tabularnewline
43 & -0.00796 & -0.0671 & 0.473357 \tabularnewline
44 & -0.007779 & -0.0656 & 0.47396 \tabularnewline
45 & -0.007571 & -0.0638 & 0.474656 \tabularnewline
46 & -0.007334 & -0.0618 & 0.475449 \tabularnewline
47 & -0.006105 & -0.0514 & 0.479559 \tabularnewline
48 & -0.091512 & -0.7711 & 0.221606 \tabularnewline
\hline
\end{tabular}
%Source: https://freestatistics.org/blog/index.php?pk=189992&T=2

[TABLE]
[ROW][C]Partial Autocorrelation Function[/C][/ROW]
[ROW][C]Time lag k[/C][C]PACF(k)[/C][C]T-STAT[/C][C]P-value[/C][/ROW]
[ROW][C]1[/C][C]-0.014722[/C][C]-0.124[/C][C]0.450814[/C][/ROW]
[ROW][C]2[/C][C]-0.015267[/C][C]-0.1286[/C][C]0.449001[/C][/ROW]
[ROW][C]3[/C][C]-0.01583[/C][C]-0.1334[/C][C]0.447134[/C][/ROW]
[ROW][C]4[/C][C]-0.01641[/C][C]-0.1383[/C][C]0.445208[/C][/ROW]
[ROW][C]5[/C][C]-0.017009[/C][C]-0.1433[/C][C]0.443222[/C][/ROW]
[ROW][C]6[/C][C]-0.017628[/C][C]-0.1485[/C][C]0.44117[/C][/ROW]
[ROW][C]7[/C][C]-0.018269[/C][C]-0.1539[/C][C]0.439048[/C][/ROW]
[ROW][C]8[/C][C]-0.018933[/C][C]-0.1595[/C][C]0.436851[/C][/ROW]
[ROW][C]9[/C][C]-0.019622[/C][C]-0.1653[/C][C]0.434574[/C][/ROW]
[ROW][C]10[/C][C]-0.020337[/C][C]-0.1714[/C][C]0.432212[/C][/ROW]
[ROW][C]11[/C][C]-0.021196[/C][C]-0.1786[/C][C]0.42938[/C][/ROW]
[ROW][C]12[/C][C]0.392569[/C][C]3.3078[/C][C]0.000739[/C][/ROW]
[ROW][C]13[/C][C]0.005741[/C][C]0.0484[/C][C]0.480778[/C][/ROW]
[ROW][C]14[/C][C]0.005928[/C][C]0.0499[/C][C]0.480152[/C][/ROW]
[ROW][C]15[/C][C]0.006109[/C][C]0.0515[/C][C]0.479545[/C][/ROW]
[ROW][C]16[/C][C]0.006305[/C][C]0.0531[/C][C]0.478888[/C][/ROW]
[ROW][C]17[/C][C]0.006518[/C][C]0.0549[/C][C]0.478179[/C][/ROW]
[ROW][C]18[/C][C]0.006746[/C][C]0.0568[/C][C]0.477416[/C][/ROW]
[ROW][C]19[/C][C]0.006991[/C][C]0.0589[/C][C]0.476596[/C][/ROW]
[ROW][C]20[/C][C]0.007254[/C][C]0.0611[/C][C]0.475718[/C][/ROW]
[ROW][C]21[/C][C]0.007534[/C][C]0.0635[/C][C]0.474779[/C][/ROW]
[ROW][C]22[/C][C]0.007834[/C][C]0.066[/C][C]0.473778[/C][/ROW]
[ROW][C]23[/C][C]0.008128[/C][C]0.0685[/C][C]0.472795[/C][/ROW]
[ROW][C]24[/C][C]-0.261492[/C][C]-2.2034[/C][C]0.015407[/C][/ROW]
[ROW][C]25[/C][C]-0.014221[/C][C]-0.1198[/C][C]0.452479[/C][/ROW]
[ROW][C]26[/C][C]-0.014995[/C][C]-0.1263[/C][C]0.449908[/C][/ROW]
[ROW][C]27[/C][C]-0.015772[/C][C]-0.1329[/C][C]0.447326[/C][/ROW]
[ROW][C]28[/C][C]-0.016581[/C][C]-0.1397[/C][C]0.44464[/C][/ROW]
[ROW][C]29[/C][C]-0.017425[/C][C]-0.1468[/C][C]0.441843[/C][/ROW]
[ROW][C]30[/C][C]-0.018305[/C][C]-0.1542[/C][C]0.438928[/C][/ROW]
[ROW][C]31[/C][C]-0.019225[/C][C]-0.162[/C][C]0.435885[/C][/ROW]
[ROW][C]32[/C][C]-0.020188[/C][C]-0.1701[/C][C]0.432705[/C][/ROW]
[ROW][C]33[/C][C]-0.021196[/C][C]-0.1786[/C][C]0.429378[/C][/ROW]
[ROW][C]34[/C][C]-0.022255[/C][C]-0.1875[/C][C]0.425892[/C][/ROW]
[ROW][C]35[/C][C]-0.024649[/C][C]-0.2077[/C][C]0.41803[/C][/ROW]
[ROW][C]36[/C][C]0.111565[/C][C]0.9401[/C][C]0.175186[/C][/ROW]
[ROW][C]37[/C][C]-0.008582[/C][C]-0.0723[/C][C]0.471279[/C][/ROW]
[ROW][C]38[/C][C]-0.008497[/C][C]-0.0716[/C][C]0.471561[/C][/ROW]
[ROW][C]39[/C][C]-0.008434[/C][C]-0.0711[/C][C]0.471773[/C][/ROW]
[ROW][C]40[/C][C]-0.00835[/C][C]-0.0704[/C][C]0.472054[/C][/ROW]
[ROW][C]41[/C][C]-0.008244[/C][C]-0.0695[/C][C]0.472408[/C][/ROW]
[ROW][C]42[/C][C]-0.008114[/C][C]-0.0684[/C][C]0.472841[/C][/ROW]
[ROW][C]43[/C][C]-0.00796[/C][C]-0.0671[/C][C]0.473357[/C][/ROW]
[ROW][C]44[/C][C]-0.007779[/C][C]-0.0656[/C][C]0.47396[/C][/ROW]
[ROW][C]45[/C][C]-0.007571[/C][C]-0.0638[/C][C]0.474656[/C][/ROW]
[ROW][C]46[/C][C]-0.007334[/C][C]-0.0618[/C][C]0.475449[/C][/ROW]
[ROW][C]47[/C][C]-0.006105[/C][C]-0.0514[/C][C]0.479559[/C][/ROW]
[ROW][C]48[/C][C]-0.091512[/C][C]-0.7711[/C][C]0.221606[/C][/ROW]
[/TABLE]
Source: https://freestatistics.org/blog/index.php?pk=189992&T=2

Globally Unique Identifier (entire table): ba.freestatistics.org/blog/index.php?pk=189992&T=2

As an alternative you can also use a QR Code:  

The GUIDs for individual cells are displayed in the table below:

Partial Autocorrelation Function
Time lag kPACF(k)T-STATP-value
1-0.014722-0.1240.450814
2-0.015267-0.12860.449001
3-0.01583-0.13340.447134
4-0.01641-0.13830.445208
5-0.017009-0.14330.443222
6-0.017628-0.14850.44117
7-0.018269-0.15390.439048
8-0.018933-0.15950.436851
9-0.019622-0.16530.434574
10-0.020337-0.17140.432212
11-0.021196-0.17860.42938
120.3925693.30780.000739
130.0057410.04840.480778
140.0059280.04990.480152
150.0061090.05150.479545
160.0063050.05310.478888
170.0065180.05490.478179
180.0067460.05680.477416
190.0069910.05890.476596
200.0072540.06110.475718
210.0075340.06350.474779
220.0078340.0660.473778
230.0081280.06850.472795
24-0.261492-2.20340.015407
25-0.014221-0.11980.452479
26-0.014995-0.12630.449908
27-0.015772-0.13290.447326
28-0.016581-0.13970.44464
29-0.017425-0.14680.441843
30-0.018305-0.15420.438928
31-0.019225-0.1620.435885
32-0.020188-0.17010.432705
33-0.021196-0.17860.429378
34-0.022255-0.18750.425892
35-0.024649-0.20770.41803
360.1115650.94010.175186
37-0.008582-0.07230.471279
38-0.008497-0.07160.471561
39-0.008434-0.07110.471773
40-0.00835-0.07040.472054
41-0.008244-0.06950.472408
42-0.008114-0.06840.472841
43-0.00796-0.06710.473357
44-0.007779-0.06560.47396
45-0.007571-0.06380.474656
46-0.007334-0.06180.475449
47-0.006105-0.05140.479559
48-0.091512-0.77110.221606


Parameters (Session):
par1 = 48 ; par2 = 1 ; par3 = 1 ; par4 = 0 ; par5 = 12 ; par6 = White Noise ; par7 = 0.95 ;
Parameters (R input):
par1 = 48 ; par2 = 1 ; par3 = 1 ; par4 = 0 ; par5 = 12 ; par6 = White Noise ; par7 = 0.95 ; par8 = ;
R code (references can be found in the software module):
par8 <- ''
par7 <- '0.95'
par6 <- 'White Noise'
par5 <- '12'
par4 <- '0'
par3 <- '0'
par2 <- '1'
par1 <- '48'
if (par1 == 'Default') {
par1 = 10*log10(length(x))
} else {
par1 <- as.numeric(par1)
}
par2 <- as.numeric(par2)
par3 <- as.numeric(par3)
par4 <- as.numeric(par4)
par5 <- as.numeric(par5)
if (par6 == 'White Noise') par6 <- 'white' else par6 <- 'ma'
par7 <- as.numeric(par7)
if (par8 != '') par8 <- as.numeric(par8)
ox <- x
if (par8 == '') {
if (par2 == 0) {
x <- log(x)
} else {
x <- (x ^ par2 - 1) / par2
}
} else {
x <- log(x,base=par8)
}
if (par3 > 0) x <- diff(x,lag=1,difference=par3)
if (par4 > 0) x <- diff(x,lag=par5,difference=par4)
bitmap(file='picts.png')
op <- par(mfrow=c(2,1))
plot(ox,type='l',main='Original Time Series',xlab='time',ylab='value')
if (par8=='') {
mytitle <- paste('Working Time Series (lambda=',par2,', d=',par3,', D=',par4,')',sep='')
mysub <- paste('(lambda=',par2,', d=',par3,', D=',par4,', CI=', par7, ', CI type=',par6,')',sep='')
} else {
mytitle <- paste('Working Time Series (base=',par8,', d=',par3,', D=',par4,')',sep='')
mysub <- paste('(base=',par8,', d=',par3,', D=',par4,', CI=', par7, ', CI type=',par6,')',sep='')
}
plot(x,type='l', main=mytitle,xlab='time',ylab='value')
par(op)
dev.off()
bitmap(file='pic1.png')
racf <- acf(x, par1, main='Autocorrelation', xlab='time lag', ylab='ACF', ci.type=par6, ci=par7, sub=mysub)
dev.off()
bitmap(file='pic2.png')
rpacf <- pacf(x,par1,main='Partial Autocorrelation',xlab='lags',ylab='PACF',sub=mysub)
dev.off()
(myacf <- c(racf$acf))
(mypacf <- c(rpacf$acf))
lengthx <- length(x)
sqrtn <- sqrt(lengthx)
load(file='createtable')
a<-table.start()
a<-table.row.start(a)
a<-table.element(a,'Autocorrelation Function',4,TRUE)
a<-table.row.end(a)
a<-table.row.start(a)
a<-table.element(a,'Time lag k',header=TRUE)
a<-table.element(a,hyperlink('basics.htm','ACF(k)','click here for more information about the Autocorrelation Function'),header=TRUE)
a<-table.element(a,'T-STAT',header=TRUE)
a<-table.element(a,'P-value',header=TRUE)
a<-table.row.end(a)
for (i in 2:(par1+1)) {
a<-table.row.start(a)
a<-table.element(a,i-1,header=TRUE)
a<-table.element(a,round(myacf[i],6))
mytstat <- myacf[i]*sqrtn
a<-table.element(a,round(mytstat,4))
a<-table.element(a,round(1-pt(abs(mytstat),lengthx),6))
a<-table.row.end(a)
}
a<-table.end(a)
table.save(a,file='mytable.tab')
a<-table.start()
a<-table.row.start(a)
a<-table.element(a,'Partial Autocorrelation Function',4,TRUE)
a<-table.row.end(a)
a<-table.row.start(a)
a<-table.element(a,'Time lag k',header=TRUE)
a<-table.element(a,hyperlink('basics.htm','PACF(k)','click here for more information about the Partial Autocorrelation Function'),header=TRUE)
a<-table.element(a,'T-STAT',header=TRUE)
a<-table.element(a,'P-value',header=TRUE)
a<-table.row.end(a)
for (i in 1:par1) {
a<-table.row.start(a)
a<-table.element(a,i,header=TRUE)
a<-table.element(a,round(mypacf[i],6))
mytstat <- mypacf[i]*sqrtn
a<-table.element(a,round(mytstat,4))
a<-table.element(a,round(1-pt(abs(mytstat),lengthx),6))
a<-table.row.end(a)
}
a<-table.end(a)
table.save(a,file='mytable1.tab')