Free Statistics

of Irreproducible Research!

Author's title

Author*Unverified author*
R Software Modulerwasp_autocorrelation.wasp
Title produced by software(Partial) Autocorrelation Function
Date of computationFri, 16 Nov 2012 14:20:19 -0500
Cite this page as followsStatistical Computations at FreeStatistics.org, Office for Research Development and Education, URL https://freestatistics.org/blog/index.php?v=date/2012/Nov/16/t13530937487m31iawrtlnqrg5.htm/, Retrieved Sat, 27 Apr 2024 10:52:44 +0000
Statistical Computations at FreeStatistics.org, Office for Research Development and Education, URL https://freestatistics.org/blog/index.php?pk=189991, Retrieved Sat, 27 Apr 2024 10:52:44 +0000
QR Codes:

Original text written by user:
IsPrivate?No (this computation is public)
User-defined keywords
Estimated Impact62
Family? (F = Feedback message, R = changed R code, M = changed R Module, P = changed Parameters, D = changed Data)
-       [(Partial) Autocorrelation Function] [gemiddeldeprijs s...] [2012-11-16 19:20:19] [b973758fc1658916c4a7c8f7ddd22f57] [Current]
Feedback Forum

Post a new message
Dataseries X:
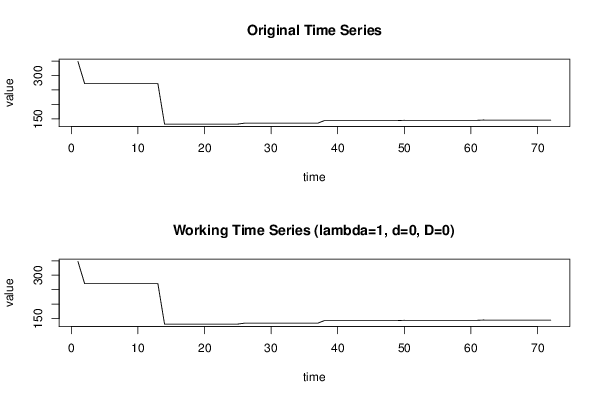
348,33
272
272
272
272
272
272
272
272
272
272
272
272
132
132
132
132
132
132
132
132
132
132
132
132
135
135
135
135
135
135
135
135
135
135
135
135
144
144
144
144
144
144
144
144
144
144
144
144
145
145
145
145
145
145
145
145
145
145
145
145
146
146
146
146
146
146
146
146
146
146
146


Summary of computational transaction
Raw Inputview raw input (R code)
Raw Outputview raw output of R engine
Computing time5 seconds
R Server'Gertrude Mary Cox' @ cox.wessa.net

\begin{tabular}{lllllllll}
\hline
Summary of computational transaction \tabularnewline
Raw Input & view raw input (R code)  \tabularnewline
Raw Output & view raw output of R engine  \tabularnewline
Computing time & 5 seconds \tabularnewline
R Server & 'Gertrude Mary Cox' @ cox.wessa.net \tabularnewline
\hline
\end{tabular}
%Source: https://freestatistics.org/blog/index.php?pk=189991&T=0

[TABLE]
[ROW][C]Summary of computational transaction[/C][/ROW]
[ROW][C]Raw Input[/C][C]view raw input (R code) [/C][/ROW]
[ROW][C]Raw Output[/C][C]view raw output of R engine [/C][/ROW]
[ROW][C]Computing time[/C][C]5 seconds[/C][/ROW]
[ROW][C]R Server[/C][C]'Gertrude Mary Cox' @ cox.wessa.net[/C][/ROW]
[/TABLE]
Source: https://freestatistics.org/blog/index.php?pk=189991&T=0

Globally Unique Identifier (entire table): ba.freestatistics.org/blog/index.php?pk=189991&T=0

As an alternative you can also use a QR Code:  

The GUIDs for individual cells are displayed in the table below:

Summary of computational transaction
Raw Inputview raw input (R code)
Raw Outputview raw output of R engine
Computing time5 seconds
R Server'Gertrude Mary Cox' @ cox.wessa.net


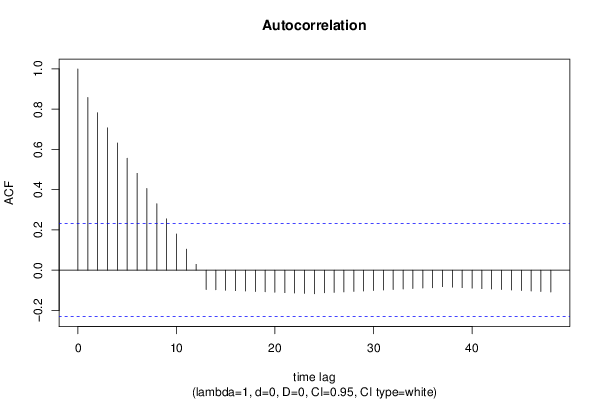
Autocorrelation Function
Time lag kACF(k)T-STATP-value
10.8577457.27820
20.7824156.6390
30.7070865.99980
40.6317565.36060
50.5564274.72146e-06
60.4810974.08225.7e-05
70.4057683.44310.000481
80.3304382.80390.003243
90.2551092.16470.016865
100.1797791.52550.06576
110.104450.88630.189207
120.0290290.24630.403069
13-0.095707-0.81210.209705
14-0.097692-0.82890.204939
15-0.099676-0.84580.200239
16-0.101661-0.86260.195605
17-0.103645-0.87950.191039
18-0.10563-0.89630.18654
19-0.107614-0.91310.182109
20-0.109599-0.930.177745
21-0.111583-0.94680.173449
22-0.113568-0.96370.169222
23-0.115553-0.98050.165062
24-0.117629-0.99810.160784
25-0.112635-0.95570.1712
26-0.110273-0.93570.176279
27-0.10791-0.91560.181455
28-0.105547-0.89560.186727
29-0.103184-0.87550.192094
30-0.100821-0.85550.197557
31-0.098458-0.83540.203115
32-0.096096-0.81540.208767
33-0.093733-0.79530.214512
34-0.09137-0.77530.220351
35-0.089007-0.75520.226281
36-0.087469-0.74220.230191
37-0.081987-0.69570.244434
38-0.084396-0.71610.238116
39-0.086805-0.73660.23189
40-0.089214-0.7570.225757
41-0.091623-0.77750.21972
42-0.094033-0.79790.213778
43-0.096442-0.81830.207933
44-0.098851-0.83880.202185
45-0.10126-0.85920.196535
46-0.103669-0.87970.190984
47-0.106078-0.90010.185533
48-0.108762-0.92290.179576

\begin{tabular}{lllllllll}
\hline
Autocorrelation Function \tabularnewline
Time lag k & ACF(k) & T-STAT & P-value \tabularnewline
1 & 0.857745 & 7.2782 & 0 \tabularnewline
2 & 0.782415 & 6.639 & 0 \tabularnewline
3 & 0.707086 & 5.9998 & 0 \tabularnewline
4 & 0.631756 & 5.3606 & 0 \tabularnewline
5 & 0.556427 & 4.7214 & 6e-06 \tabularnewline
6 & 0.481097 & 4.0822 & 5.7e-05 \tabularnewline
7 & 0.405768 & 3.4431 & 0.000481 \tabularnewline
8 & 0.330438 & 2.8039 & 0.003243 \tabularnewline
9 & 0.255109 & 2.1647 & 0.016865 \tabularnewline
10 & 0.179779 & 1.5255 & 0.06576 \tabularnewline
11 & 0.10445 & 0.8863 & 0.189207 \tabularnewline
12 & 0.029029 & 0.2463 & 0.403069 \tabularnewline
13 & -0.095707 & -0.8121 & 0.209705 \tabularnewline
14 & -0.097692 & -0.8289 & 0.204939 \tabularnewline
15 & -0.099676 & -0.8458 & 0.200239 \tabularnewline
16 & -0.101661 & -0.8626 & 0.195605 \tabularnewline
17 & -0.103645 & -0.8795 & 0.191039 \tabularnewline
18 & -0.10563 & -0.8963 & 0.18654 \tabularnewline
19 & -0.107614 & -0.9131 & 0.182109 \tabularnewline
20 & -0.109599 & -0.93 & 0.177745 \tabularnewline
21 & -0.111583 & -0.9468 & 0.173449 \tabularnewline
22 & -0.113568 & -0.9637 & 0.169222 \tabularnewline
23 & -0.115553 & -0.9805 & 0.165062 \tabularnewline
24 & -0.117629 & -0.9981 & 0.160784 \tabularnewline
25 & -0.112635 & -0.9557 & 0.1712 \tabularnewline
26 & -0.110273 & -0.9357 & 0.176279 \tabularnewline
27 & -0.10791 & -0.9156 & 0.181455 \tabularnewline
28 & -0.105547 & -0.8956 & 0.186727 \tabularnewline
29 & -0.103184 & -0.8755 & 0.192094 \tabularnewline
30 & -0.100821 & -0.8555 & 0.197557 \tabularnewline
31 & -0.098458 & -0.8354 & 0.203115 \tabularnewline
32 & -0.096096 & -0.8154 & 0.208767 \tabularnewline
33 & -0.093733 & -0.7953 & 0.214512 \tabularnewline
34 & -0.09137 & -0.7753 & 0.220351 \tabularnewline
35 & -0.089007 & -0.7552 & 0.226281 \tabularnewline
36 & -0.087469 & -0.7422 & 0.230191 \tabularnewline
37 & -0.081987 & -0.6957 & 0.244434 \tabularnewline
38 & -0.084396 & -0.7161 & 0.238116 \tabularnewline
39 & -0.086805 & -0.7366 & 0.23189 \tabularnewline
40 & -0.089214 & -0.757 & 0.225757 \tabularnewline
41 & -0.091623 & -0.7775 & 0.21972 \tabularnewline
42 & -0.094033 & -0.7979 & 0.213778 \tabularnewline
43 & -0.096442 & -0.8183 & 0.207933 \tabularnewline
44 & -0.098851 & -0.8388 & 0.202185 \tabularnewline
45 & -0.10126 & -0.8592 & 0.196535 \tabularnewline
46 & -0.103669 & -0.8797 & 0.190984 \tabularnewline
47 & -0.106078 & -0.9001 & 0.185533 \tabularnewline
48 & -0.108762 & -0.9229 & 0.179576 \tabularnewline
\hline
\end{tabular}
%Source: https://freestatistics.org/blog/index.php?pk=189991&T=1

[TABLE]
[ROW][C]Autocorrelation Function[/C][/ROW]
[ROW][C]Time lag k[/C][C]ACF(k)[/C][C]T-STAT[/C][C]P-value[/C][/ROW]
[ROW][C]1[/C][C]0.857745[/C][C]7.2782[/C][C]0[/C][/ROW]
[ROW][C]2[/C][C]0.782415[/C][C]6.639[/C][C]0[/C][/ROW]
[ROW][C]3[/C][C]0.707086[/C][C]5.9998[/C][C]0[/C][/ROW]
[ROW][C]4[/C][C]0.631756[/C][C]5.3606[/C][C]0[/C][/ROW]
[ROW][C]5[/C][C]0.556427[/C][C]4.7214[/C][C]6e-06[/C][/ROW]
[ROW][C]6[/C][C]0.481097[/C][C]4.0822[/C][C]5.7e-05[/C][/ROW]
[ROW][C]7[/C][C]0.405768[/C][C]3.4431[/C][C]0.000481[/C][/ROW]
[ROW][C]8[/C][C]0.330438[/C][C]2.8039[/C][C]0.003243[/C][/ROW]
[ROW][C]9[/C][C]0.255109[/C][C]2.1647[/C][C]0.016865[/C][/ROW]
[ROW][C]10[/C][C]0.179779[/C][C]1.5255[/C][C]0.06576[/C][/ROW]
[ROW][C]11[/C][C]0.10445[/C][C]0.8863[/C][C]0.189207[/C][/ROW]
[ROW][C]12[/C][C]0.029029[/C][C]0.2463[/C][C]0.403069[/C][/ROW]
[ROW][C]13[/C][C]-0.095707[/C][C]-0.8121[/C][C]0.209705[/C][/ROW]
[ROW][C]14[/C][C]-0.097692[/C][C]-0.8289[/C][C]0.204939[/C][/ROW]
[ROW][C]15[/C][C]-0.099676[/C][C]-0.8458[/C][C]0.200239[/C][/ROW]
[ROW][C]16[/C][C]-0.101661[/C][C]-0.8626[/C][C]0.195605[/C][/ROW]
[ROW][C]17[/C][C]-0.103645[/C][C]-0.8795[/C][C]0.191039[/C][/ROW]
[ROW][C]18[/C][C]-0.10563[/C][C]-0.8963[/C][C]0.18654[/C][/ROW]
[ROW][C]19[/C][C]-0.107614[/C][C]-0.9131[/C][C]0.182109[/C][/ROW]
[ROW][C]20[/C][C]-0.109599[/C][C]-0.93[/C][C]0.177745[/C][/ROW]
[ROW][C]21[/C][C]-0.111583[/C][C]-0.9468[/C][C]0.173449[/C][/ROW]
[ROW][C]22[/C][C]-0.113568[/C][C]-0.9637[/C][C]0.169222[/C][/ROW]
[ROW][C]23[/C][C]-0.115553[/C][C]-0.9805[/C][C]0.165062[/C][/ROW]
[ROW][C]24[/C][C]-0.117629[/C][C]-0.9981[/C][C]0.160784[/C][/ROW]
[ROW][C]25[/C][C]-0.112635[/C][C]-0.9557[/C][C]0.1712[/C][/ROW]
[ROW][C]26[/C][C]-0.110273[/C][C]-0.9357[/C][C]0.176279[/C][/ROW]
[ROW][C]27[/C][C]-0.10791[/C][C]-0.9156[/C][C]0.181455[/C][/ROW]
[ROW][C]28[/C][C]-0.105547[/C][C]-0.8956[/C][C]0.186727[/C][/ROW]
[ROW][C]29[/C][C]-0.103184[/C][C]-0.8755[/C][C]0.192094[/C][/ROW]
[ROW][C]30[/C][C]-0.100821[/C][C]-0.8555[/C][C]0.197557[/C][/ROW]
[ROW][C]31[/C][C]-0.098458[/C][C]-0.8354[/C][C]0.203115[/C][/ROW]
[ROW][C]32[/C][C]-0.096096[/C][C]-0.8154[/C][C]0.208767[/C][/ROW]
[ROW][C]33[/C][C]-0.093733[/C][C]-0.7953[/C][C]0.214512[/C][/ROW]
[ROW][C]34[/C][C]-0.09137[/C][C]-0.7753[/C][C]0.220351[/C][/ROW]
[ROW][C]35[/C][C]-0.089007[/C][C]-0.7552[/C][C]0.226281[/C][/ROW]
[ROW][C]36[/C][C]-0.087469[/C][C]-0.7422[/C][C]0.230191[/C][/ROW]
[ROW][C]37[/C][C]-0.081987[/C][C]-0.6957[/C][C]0.244434[/C][/ROW]
[ROW][C]38[/C][C]-0.084396[/C][C]-0.7161[/C][C]0.238116[/C][/ROW]
[ROW][C]39[/C][C]-0.086805[/C][C]-0.7366[/C][C]0.23189[/C][/ROW]
[ROW][C]40[/C][C]-0.089214[/C][C]-0.757[/C][C]0.225757[/C][/ROW]
[ROW][C]41[/C][C]-0.091623[/C][C]-0.7775[/C][C]0.21972[/C][/ROW]
[ROW][C]42[/C][C]-0.094033[/C][C]-0.7979[/C][C]0.213778[/C][/ROW]
[ROW][C]43[/C][C]-0.096442[/C][C]-0.8183[/C][C]0.207933[/C][/ROW]
[ROW][C]44[/C][C]-0.098851[/C][C]-0.8388[/C][C]0.202185[/C][/ROW]
[ROW][C]45[/C][C]-0.10126[/C][C]-0.8592[/C][C]0.196535[/C][/ROW]
[ROW][C]46[/C][C]-0.103669[/C][C]-0.8797[/C][C]0.190984[/C][/ROW]
[ROW][C]47[/C][C]-0.106078[/C][C]-0.9001[/C][C]0.185533[/C][/ROW]
[ROW][C]48[/C][C]-0.108762[/C][C]-0.9229[/C][C]0.179576[/C][/ROW]
[/TABLE]
Source: https://freestatistics.org/blog/index.php?pk=189991&T=1

Globally Unique Identifier (entire table): ba.freestatistics.org/blog/index.php?pk=189991&T=1

As an alternative you can also use a QR Code:  

The GUIDs for individual cells are displayed in the table below:

Autocorrelation Function
Time lag kACF(k)T-STATP-value
10.8577457.27820
20.7824156.6390
30.7070865.99980
40.6317565.36060
50.5564274.72146e-06
60.4810974.08225.7e-05
70.4057683.44310.000481
80.3304382.80390.003243
90.2551092.16470.016865
100.1797791.52550.06576
110.104450.88630.189207
120.0290290.24630.403069
13-0.095707-0.81210.209705
14-0.097692-0.82890.204939
15-0.099676-0.84580.200239
16-0.101661-0.86260.195605
17-0.103645-0.87950.191039
18-0.10563-0.89630.18654
19-0.107614-0.91310.182109
20-0.109599-0.930.177745
21-0.111583-0.94680.173449
22-0.113568-0.96370.169222
23-0.115553-0.98050.165062
24-0.117629-0.99810.160784
25-0.112635-0.95570.1712
26-0.110273-0.93570.176279
27-0.10791-0.91560.181455
28-0.105547-0.89560.186727
29-0.103184-0.87550.192094
30-0.100821-0.85550.197557
31-0.098458-0.83540.203115
32-0.096096-0.81540.208767
33-0.093733-0.79530.214512
34-0.09137-0.77530.220351
35-0.089007-0.75520.226281
36-0.087469-0.74220.230191
37-0.081987-0.69570.244434
38-0.084396-0.71610.238116
39-0.086805-0.73660.23189
40-0.089214-0.7570.225757
41-0.091623-0.77750.21972
42-0.094033-0.79790.213778
43-0.096442-0.81830.207933
44-0.098851-0.83880.202185
45-0.10126-0.85920.196535
46-0.103669-0.87970.190984
47-0.106078-0.90010.185533
48-0.108762-0.92290.179576


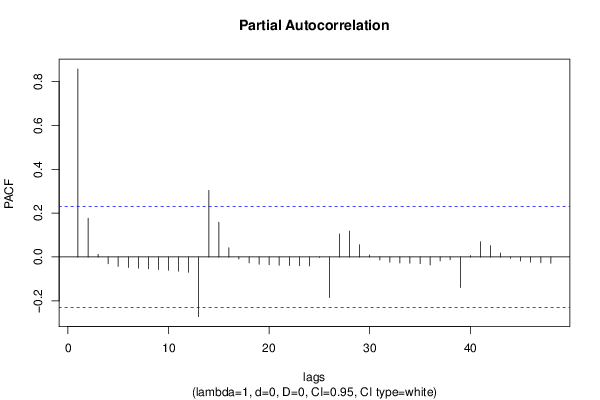
Partial Autocorrelation Function
Time lag kPACF(k)T-STATP-value
10.8577457.27820
20.176671.49910.069111
30.0117210.09950.460525
4-0.030997-0.2630.396644
5-0.043263-0.36710.357312
6-0.048083-0.4080.342242
7-0.051232-0.43470.332533
8-0.054179-0.45970.323549
9-0.057328-0.48640.314065
10-0.060826-0.51610.303675
11-0.064768-0.54960.292156
12-0.06962-0.59070.278271
13-0.272517-2.31240.011809
140.3038912.57860.005982
150.1584481.34450.091507
160.0417490.35420.362094
17-0.009207-0.07810.468974
18-0.027364-0.23220.408525
19-0.033536-0.28460.3884
20-0.03607-0.30610.380221
21-0.037686-0.31980.37503
22-0.03911-0.33190.37048
23-0.040318-0.34210.366632
24-0.040926-0.34730.364701
25-0.00196-0.01660.493388
26-0.185097-1.57060.06033
270.10490.89010.188187
280.1179381.00070.160153
290.0556450.47220.31912
300.0088750.07530.47009
31-0.014183-0.12030.452272
32-0.023673-0.20090.420684
33-0.027449-0.23290.408244
34-0.029254-0.24820.402331
35-0.030595-0.25960.397953
36-0.036644-0.31090.378374
37-0.018149-0.1540.439019
38-0.012244-0.10390.458772
39-0.139629-1.18480.119999
400.0067530.05730.477233
410.0692550.58760.279303
420.0515710.43760.331496
430.0177650.15070.440299
44-0.005968-0.05060.479875
45-0.01829-0.15520.438549
46-0.02389-0.20270.419966
47-0.026388-0.22390.411729
48-0.029272-0.24840.402274

\begin{tabular}{lllllllll}
\hline
Partial Autocorrelation Function \tabularnewline
Time lag k & PACF(k) & T-STAT & P-value \tabularnewline
1 & 0.857745 & 7.2782 & 0 \tabularnewline
2 & 0.17667 & 1.4991 & 0.069111 \tabularnewline
3 & 0.011721 & 0.0995 & 0.460525 \tabularnewline
4 & -0.030997 & -0.263 & 0.396644 \tabularnewline
5 & -0.043263 & -0.3671 & 0.357312 \tabularnewline
6 & -0.048083 & -0.408 & 0.342242 \tabularnewline
7 & -0.051232 & -0.4347 & 0.332533 \tabularnewline
8 & -0.054179 & -0.4597 & 0.323549 \tabularnewline
9 & -0.057328 & -0.4864 & 0.314065 \tabularnewline
10 & -0.060826 & -0.5161 & 0.303675 \tabularnewline
11 & -0.064768 & -0.5496 & 0.292156 \tabularnewline
12 & -0.06962 & -0.5907 & 0.278271 \tabularnewline
13 & -0.272517 & -2.3124 & 0.011809 \tabularnewline
14 & 0.303891 & 2.5786 & 0.005982 \tabularnewline
15 & 0.158448 & 1.3445 & 0.091507 \tabularnewline
16 & 0.041749 & 0.3542 & 0.362094 \tabularnewline
17 & -0.009207 & -0.0781 & 0.468974 \tabularnewline
18 & -0.027364 & -0.2322 & 0.408525 \tabularnewline
19 & -0.033536 & -0.2846 & 0.3884 \tabularnewline
20 & -0.03607 & -0.3061 & 0.380221 \tabularnewline
21 & -0.037686 & -0.3198 & 0.37503 \tabularnewline
22 & -0.03911 & -0.3319 & 0.37048 \tabularnewline
23 & -0.040318 & -0.3421 & 0.366632 \tabularnewline
24 & -0.040926 & -0.3473 & 0.364701 \tabularnewline
25 & -0.00196 & -0.0166 & 0.493388 \tabularnewline
26 & -0.185097 & -1.5706 & 0.06033 \tabularnewline
27 & 0.1049 & 0.8901 & 0.188187 \tabularnewline
28 & 0.117938 & 1.0007 & 0.160153 \tabularnewline
29 & 0.055645 & 0.4722 & 0.31912 \tabularnewline
30 & 0.008875 & 0.0753 & 0.47009 \tabularnewline
31 & -0.014183 & -0.1203 & 0.452272 \tabularnewline
32 & -0.023673 & -0.2009 & 0.420684 \tabularnewline
33 & -0.027449 & -0.2329 & 0.408244 \tabularnewline
34 & -0.029254 & -0.2482 & 0.402331 \tabularnewline
35 & -0.030595 & -0.2596 & 0.397953 \tabularnewline
36 & -0.036644 & -0.3109 & 0.378374 \tabularnewline
37 & -0.018149 & -0.154 & 0.439019 \tabularnewline
38 & -0.012244 & -0.1039 & 0.458772 \tabularnewline
39 & -0.139629 & -1.1848 & 0.119999 \tabularnewline
40 & 0.006753 & 0.0573 & 0.477233 \tabularnewline
41 & 0.069255 & 0.5876 & 0.279303 \tabularnewline
42 & 0.051571 & 0.4376 & 0.331496 \tabularnewline
43 & 0.017765 & 0.1507 & 0.440299 \tabularnewline
44 & -0.005968 & -0.0506 & 0.479875 \tabularnewline
45 & -0.01829 & -0.1552 & 0.438549 \tabularnewline
46 & -0.02389 & -0.2027 & 0.419966 \tabularnewline
47 & -0.026388 & -0.2239 & 0.411729 \tabularnewline
48 & -0.029272 & -0.2484 & 0.402274 \tabularnewline
\hline
\end{tabular}
%Source: https://freestatistics.org/blog/index.php?pk=189991&T=2

[TABLE]
[ROW][C]Partial Autocorrelation Function[/C][/ROW]
[ROW][C]Time lag k[/C][C]PACF(k)[/C][C]T-STAT[/C][C]P-value[/C][/ROW]
[ROW][C]1[/C][C]0.857745[/C][C]7.2782[/C][C]0[/C][/ROW]
[ROW][C]2[/C][C]0.17667[/C][C]1.4991[/C][C]0.069111[/C][/ROW]
[ROW][C]3[/C][C]0.011721[/C][C]0.0995[/C][C]0.460525[/C][/ROW]
[ROW][C]4[/C][C]-0.030997[/C][C]-0.263[/C][C]0.396644[/C][/ROW]
[ROW][C]5[/C][C]-0.043263[/C][C]-0.3671[/C][C]0.357312[/C][/ROW]
[ROW][C]6[/C][C]-0.048083[/C][C]-0.408[/C][C]0.342242[/C][/ROW]
[ROW][C]7[/C][C]-0.051232[/C][C]-0.4347[/C][C]0.332533[/C][/ROW]
[ROW][C]8[/C][C]-0.054179[/C][C]-0.4597[/C][C]0.323549[/C][/ROW]
[ROW][C]9[/C][C]-0.057328[/C][C]-0.4864[/C][C]0.314065[/C][/ROW]
[ROW][C]10[/C][C]-0.060826[/C][C]-0.5161[/C][C]0.303675[/C][/ROW]
[ROW][C]11[/C][C]-0.064768[/C][C]-0.5496[/C][C]0.292156[/C][/ROW]
[ROW][C]12[/C][C]-0.06962[/C][C]-0.5907[/C][C]0.278271[/C][/ROW]
[ROW][C]13[/C][C]-0.272517[/C][C]-2.3124[/C][C]0.011809[/C][/ROW]
[ROW][C]14[/C][C]0.303891[/C][C]2.5786[/C][C]0.005982[/C][/ROW]
[ROW][C]15[/C][C]0.158448[/C][C]1.3445[/C][C]0.091507[/C][/ROW]
[ROW][C]16[/C][C]0.041749[/C][C]0.3542[/C][C]0.362094[/C][/ROW]
[ROW][C]17[/C][C]-0.009207[/C][C]-0.0781[/C][C]0.468974[/C][/ROW]
[ROW][C]18[/C][C]-0.027364[/C][C]-0.2322[/C][C]0.408525[/C][/ROW]
[ROW][C]19[/C][C]-0.033536[/C][C]-0.2846[/C][C]0.3884[/C][/ROW]
[ROW][C]20[/C][C]-0.03607[/C][C]-0.3061[/C][C]0.380221[/C][/ROW]
[ROW][C]21[/C][C]-0.037686[/C][C]-0.3198[/C][C]0.37503[/C][/ROW]
[ROW][C]22[/C][C]-0.03911[/C][C]-0.3319[/C][C]0.37048[/C][/ROW]
[ROW][C]23[/C][C]-0.040318[/C][C]-0.3421[/C][C]0.366632[/C][/ROW]
[ROW][C]24[/C][C]-0.040926[/C][C]-0.3473[/C][C]0.364701[/C][/ROW]
[ROW][C]25[/C][C]-0.00196[/C][C]-0.0166[/C][C]0.493388[/C][/ROW]
[ROW][C]26[/C][C]-0.185097[/C][C]-1.5706[/C][C]0.06033[/C][/ROW]
[ROW][C]27[/C][C]0.1049[/C][C]0.8901[/C][C]0.188187[/C][/ROW]
[ROW][C]28[/C][C]0.117938[/C][C]1.0007[/C][C]0.160153[/C][/ROW]
[ROW][C]29[/C][C]0.055645[/C][C]0.4722[/C][C]0.31912[/C][/ROW]
[ROW][C]30[/C][C]0.008875[/C][C]0.0753[/C][C]0.47009[/C][/ROW]
[ROW][C]31[/C][C]-0.014183[/C][C]-0.1203[/C][C]0.452272[/C][/ROW]
[ROW][C]32[/C][C]-0.023673[/C][C]-0.2009[/C][C]0.420684[/C][/ROW]
[ROW][C]33[/C][C]-0.027449[/C][C]-0.2329[/C][C]0.408244[/C][/ROW]
[ROW][C]34[/C][C]-0.029254[/C][C]-0.2482[/C][C]0.402331[/C][/ROW]
[ROW][C]35[/C][C]-0.030595[/C][C]-0.2596[/C][C]0.397953[/C][/ROW]
[ROW][C]36[/C][C]-0.036644[/C][C]-0.3109[/C][C]0.378374[/C][/ROW]
[ROW][C]37[/C][C]-0.018149[/C][C]-0.154[/C][C]0.439019[/C][/ROW]
[ROW][C]38[/C][C]-0.012244[/C][C]-0.1039[/C][C]0.458772[/C][/ROW]
[ROW][C]39[/C][C]-0.139629[/C][C]-1.1848[/C][C]0.119999[/C][/ROW]
[ROW][C]40[/C][C]0.006753[/C][C]0.0573[/C][C]0.477233[/C][/ROW]
[ROW][C]41[/C][C]0.069255[/C][C]0.5876[/C][C]0.279303[/C][/ROW]
[ROW][C]42[/C][C]0.051571[/C][C]0.4376[/C][C]0.331496[/C][/ROW]
[ROW][C]43[/C][C]0.017765[/C][C]0.1507[/C][C]0.440299[/C][/ROW]
[ROW][C]44[/C][C]-0.005968[/C][C]-0.0506[/C][C]0.479875[/C][/ROW]
[ROW][C]45[/C][C]-0.01829[/C][C]-0.1552[/C][C]0.438549[/C][/ROW]
[ROW][C]46[/C][C]-0.02389[/C][C]-0.2027[/C][C]0.419966[/C][/ROW]
[ROW][C]47[/C][C]-0.026388[/C][C]-0.2239[/C][C]0.411729[/C][/ROW]
[ROW][C]48[/C][C]-0.029272[/C][C]-0.2484[/C][C]0.402274[/C][/ROW]
[/TABLE]
Source: https://freestatistics.org/blog/index.php?pk=189991&T=2

Globally Unique Identifier (entire table): ba.freestatistics.org/blog/index.php?pk=189991&T=2

As an alternative you can also use a QR Code:  

The GUIDs for individual cells are displayed in the table below:

Partial Autocorrelation Function
Time lag kPACF(k)T-STATP-value
10.8577457.27820
20.176671.49910.069111
30.0117210.09950.460525
4-0.030997-0.2630.396644
5-0.043263-0.36710.357312
6-0.048083-0.4080.342242
7-0.051232-0.43470.332533
8-0.054179-0.45970.323549
9-0.057328-0.48640.314065
10-0.060826-0.51610.303675
11-0.064768-0.54960.292156
12-0.06962-0.59070.278271
13-0.272517-2.31240.011809
140.3038912.57860.005982
150.1584481.34450.091507
160.0417490.35420.362094
17-0.009207-0.07810.468974
18-0.027364-0.23220.408525
19-0.033536-0.28460.3884
20-0.03607-0.30610.380221
21-0.037686-0.31980.37503
22-0.03911-0.33190.37048
23-0.040318-0.34210.366632
24-0.040926-0.34730.364701
25-0.00196-0.01660.493388
26-0.185097-1.57060.06033
270.10490.89010.188187
280.1179381.00070.160153
290.0556450.47220.31912
300.0088750.07530.47009
31-0.014183-0.12030.452272
32-0.023673-0.20090.420684
33-0.027449-0.23290.408244
34-0.029254-0.24820.402331
35-0.030595-0.25960.397953
36-0.036644-0.31090.378374
37-0.018149-0.1540.439019
38-0.012244-0.10390.458772
39-0.139629-1.18480.119999
400.0067530.05730.477233
410.0692550.58760.279303
420.0515710.43760.331496
430.0177650.15070.440299
44-0.005968-0.05060.479875
45-0.01829-0.15520.438549
46-0.02389-0.20270.419966
47-0.026388-0.22390.411729
48-0.029272-0.24840.402274


Parameters (Session):
par1 = 48 ; par2 = 1 ; par3 = 0 ; par4 = 0 ; par5 = 12 ; par6 = White Noise ; par7 = 0.95 ;
Parameters (R input):
par1 = 48 ; par2 = 1 ; par3 = 0 ; par4 = 0 ; par5 = 12 ; par6 = White Noise ; par7 = 0.95 ; par8 = ;
R code (references can be found in the software module):
if (par1 == 'Default') {
par1 = 10*log10(length(x))
} else {
par1 <- as.numeric(par1)
}
par2 <- as.numeric(par2)
par3 <- as.numeric(par3)
par4 <- as.numeric(par4)
par5 <- as.numeric(par5)
if (par6 == 'White Noise') par6 <- 'white' else par6 <- 'ma'
par7 <- as.numeric(par7)
if (par8 != '') par8 <- as.numeric(par8)
ox <- x
if (par8 == '') {
if (par2 == 0) {
x <- log(x)
} else {
x <- (x ^ par2 - 1) / par2
}
} else {
x <- log(x,base=par8)
}
if (par3 > 0) x <- diff(x,lag=1,difference=par3)
if (par4 > 0) x <- diff(x,lag=par5,difference=par4)
bitmap(file='picts.png')
op <- par(mfrow=c(2,1))
plot(ox,type='l',main='Original Time Series',xlab='time',ylab='value')
if (par8=='') {
mytitle <- paste('Working Time Series (lambda=',par2,', d=',par3,', D=',par4,')',sep='')
mysub <- paste('(lambda=',par2,', d=',par3,', D=',par4,', CI=', par7, ', CI type=',par6,')',sep='')
} else {
mytitle <- paste('Working Time Series (base=',par8,', d=',par3,', D=',par4,')',sep='')
mysub <- paste('(base=',par8,', d=',par3,', D=',par4,', CI=', par7, ', CI type=',par6,')',sep='')
}
plot(x,type='l', main=mytitle,xlab='time',ylab='value')
par(op)
dev.off()
bitmap(file='pic1.png')
racf <- acf(x, par1, main='Autocorrelation', xlab='time lag', ylab='ACF', ci.type=par6, ci=par7, sub=mysub)
dev.off()
bitmap(file='pic2.png')
rpacf <- pacf(x,par1,main='Partial Autocorrelation',xlab='lags',ylab='PACF',sub=mysub)
dev.off()
(myacf <- c(racf$acf))
(mypacf <- c(rpacf$acf))
lengthx <- length(x)
sqrtn <- sqrt(lengthx)
load(file='createtable')
a<-table.start()
a<-table.row.start(a)
a<-table.element(a,'Autocorrelation Function',4,TRUE)
a<-table.row.end(a)
a<-table.row.start(a)
a<-table.element(a,'Time lag k',header=TRUE)
a<-table.element(a,hyperlink('basics.htm','ACF(k)','click here for more information about the Autocorrelation Function'),header=TRUE)
a<-table.element(a,'T-STAT',header=TRUE)
a<-table.element(a,'P-value',header=TRUE)
a<-table.row.end(a)
for (i in 2:(par1+1)) {
a<-table.row.start(a)
a<-table.element(a,i-1,header=TRUE)
a<-table.element(a,round(myacf[i],6))
mytstat <- myacf[i]*sqrtn
a<-table.element(a,round(mytstat,4))
a<-table.element(a,round(1-pt(abs(mytstat),lengthx),6))
a<-table.row.end(a)
}
a<-table.end(a)
table.save(a,file='mytable.tab')
a<-table.start()
a<-table.row.start(a)
a<-table.element(a,'Partial Autocorrelation Function',4,TRUE)
a<-table.row.end(a)
a<-table.row.start(a)
a<-table.element(a,'Time lag k',header=TRUE)
a<-table.element(a,hyperlink('basics.htm','PACF(k)','click here for more information about the Partial Autocorrelation Function'),header=TRUE)
a<-table.element(a,'T-STAT',header=TRUE)
a<-table.element(a,'P-value',header=TRUE)
a<-table.row.end(a)
for (i in 1:par1) {
a<-table.row.start(a)
a<-table.element(a,i,header=TRUE)
a<-table.element(a,round(mypacf[i],6))
mytstat <- mypacf[i]*sqrtn
a<-table.element(a,round(mytstat,4))
a<-table.element(a,round(1-pt(abs(mytstat),lengthx),6))
a<-table.row.end(a)
}
a<-table.end(a)
table.save(a,file='mytable1.tab')