| Multiple Linear Regression - Estimated Regression Equation |
| Fondsen[t] = -4.86463515907107 + 0.0122869122501887TotaalCrimFeiten[t] + 0.00578459719973145GerappFeit[t] + 0.279900539728065`Crim25+MD`[t] + 0.626771136239096`Crim16-19ZD`[t] -0.194463485858461`Crim18-24HD`[t] + 0.719450183102083`Crim25+HD`[t] + e[t] |
| Multiple Linear Regression - Ordinary Least Squares | |||||
| Variable | Parameter | S.D. | T-STAT H0: parameter = 0 | 2-tail p-value | 1-tail p-value |
| (Intercept) | -4.86463515907107 | 20.553818 | -0.2367 | 0.814031 | 0.407015 |
| TotaalCrimFeiten | 0.0122869122501887 | 0.008244 | 1.4905 | 0.143399 | 0.071699 |
| GerappFeit | 0.00578459719973145 | 0.004247 | 1.362 | 0.180288 | 0.090144 |
| `Crim25+MD` | 0.279900539728065 | 0.287808 | 0.9725 | 0.336229 | 0.168115 |
| `Crim16-19ZD` | 0.626771136239096 | 0.424625 | 1.4761 | 0.147214 | 0.073607 |
| `Crim18-24HD` | -0.194463485858461 | 0.18889 | -1.0295 | 0.308997 | 0.154499 |
| `Crim25+HD` | 0.719450183102083 | 0.584434 | 1.231 | 0.225006 | 0.112503 |
| Multiple Linear Regression - Regression Statistics | |
| Multiple R | 0.679884178932928 |
| R-squared | 0.462242496763302 |
| Adjusted R-squared | 0.387206566079112 |
| F-TEST (value) | 6.16028204819339 |
| F-TEST (DF numerator) | 6 |
| F-TEST (DF denominator) | 43 |
| p-value | 0.000100998924599915 |
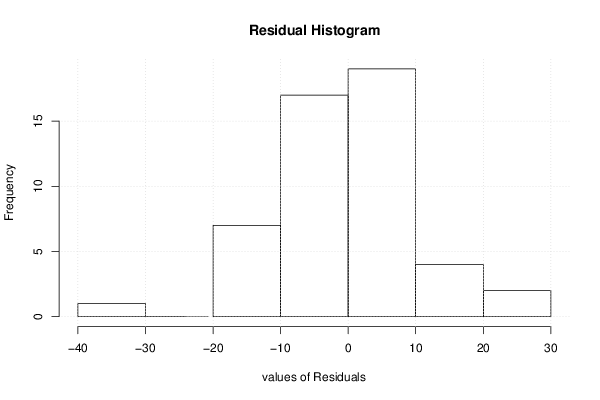
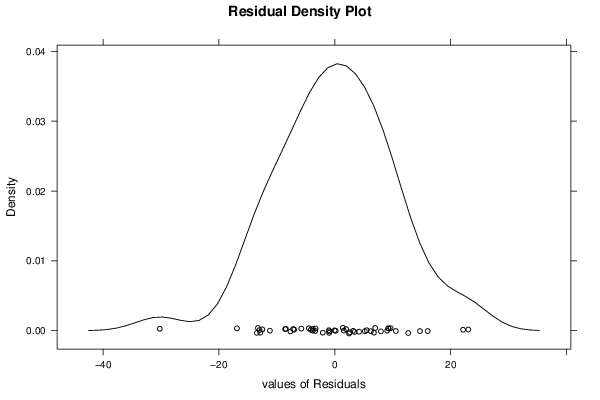
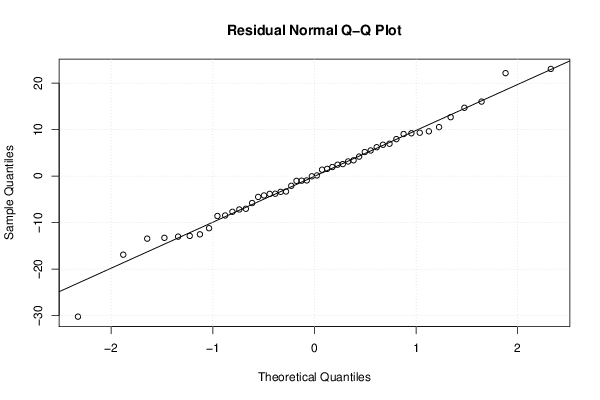
| Multiple Linear Regression - Residual Statistics | |
| Residual Standard Deviation | 10.8187359057102 |
| Sum Squared Residuals | 5032.93700369264 |
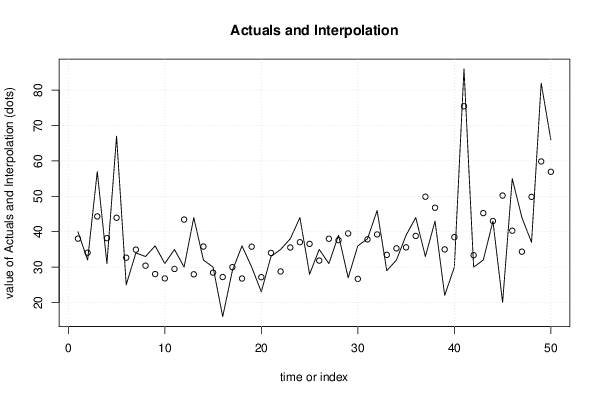
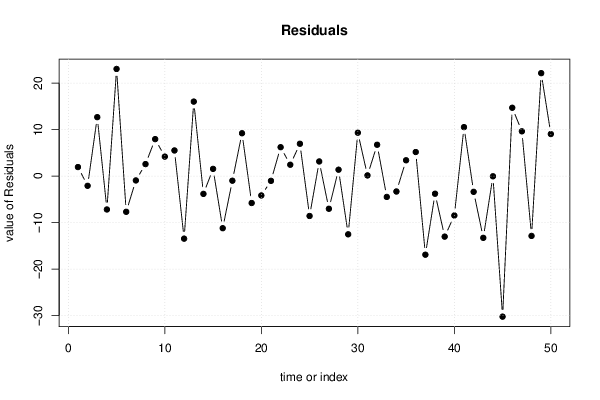
| Multiple Linear Regression - Actuals, Interpolation, and Residuals | |||
| Time or Index | Actuals | Interpolation Forecast | Residuals Prediction Error |
| 1 | 40 | 38.0406328202059 | 1.95936717979409 |
| 2 | 32 | 34.0727134590393 | -2.07271345903932 |
| 3 | 57 | 44.3178100352733 | 12.6821899647267 |
| 4 | 31 | 38.1688864878922 | -7.16888648789223 |
| 5 | 67 | 43.9458536857641 | 23.0541463142359 |
| 6 | 25 | 32.6646951902045 | -7.66469519020454 |
| 7 | 34 | 34.9218936991366 | -0.921893699136615 |
| 8 | 33 | 30.4048804882388 | 2.59511951176118 |
| 9 | 36 | 28.0371805742723 | 7.96281942572767 |
| 10 | 31 | 26.8031581361163 | 4.19684186388374 |
| 11 | 35 | 29.4784078555708 | 5.5215921444292 |
| 12 | 30 | 43.4384087840375 | -13.4384087840375 |
| 13 | 44 | 27.9657345317178 | 16.0342654682822 |
| 14 | 32 | 35.811850503635 | -3.81185050363497 |
| 15 | 30 | 28.4411097825883 | 1.55889021741175 |
| 16 | 16 | 27.197217662044 | -11.197217662044 |
| 17 | 29 | 29.9787230142919 | -0.978723014291905 |
| 18 | 36 | 26.7757098858562 | 9.22429011414381 |
| 19 | 30 | 35.7760776953958 | -5.77607769539584 |
| 20 | 23 | 27.1547771805504 | -4.15477718055036 |
| 21 | 33 | 34.0108662501971 | -1.01086625019713 |
| 22 | 35 | 28.7745980185992 | 6.2254019814008 |
| 23 | 38 | 35.5452060568624 | 2.45479394313755 |
| 24 | 44 | 37.0350026393387 | 6.96499736066128 |
| 25 | 28 | 36.5673374660034 | -8.56733746600342 |
| 26 | 35 | 31.838898723225 | 3.16110127677505 |
| 27 | 31 | 38.0143167714028 | -7.01431677140276 |
| 28 | 39 | 37.6132794753221 | 1.38672052467793 |
| 29 | 27 | 39.5097097615994 | -12.5097097615994 |
| 30 | 36 | 26.6619362463407 | 9.33806375365934 |
| 31 | 38 | 37.8430390168849 | 0.156960983115111 |
| 32 | 46 | 39.2482375554757 | 6.75176244452428 |
| 33 | 29 | 33.4681693211018 | -4.46816932110184 |
| 34 | 32 | 35.301983035604 | -3.30198303560397 |
| 35 | 39 | 35.5846630144913 | 3.41533698550871 |
| 36 | 44 | 38.8117042796599 | 5.18829572034006 |
| 37 | 33 | 49.8932694714816 | -16.8932694714816 |
| 38 | 43 | 46.7786210855798 | -3.77862108557978 |
| 39 | 22 | 35.0045409096612 | -13.0045409096612 |
| 40 | 30 | 38.4571180042982 | -8.45711800429825 |
| 41 | 86 | 75.4551976907843 | 10.5448023092157 |
| 42 | 30 | 33.3734346967697 | -3.37343469676971 |
| 43 | 32 | 45.2655639511873 | -13.2655639511873 |
| 44 | 43 | 43.0326627662332 | -0.0326627662332422 |
| 45 | 20 | 50.2165442008318 | -30.2165442008318 |
| 46 | 55 | 40.2922953068079 | 14.7077046931921 |
| 47 | 44 | 34.3605725405412 | 9.63942745945883 |
| 48 | 37 | 49.8530136133928 | -12.8530136133928 |
| 49 | 82 | 59.8511494977415 | 22.1488505022585 |
| 50 | 66 | 56.9413471607501 | 9.05865283924993 |
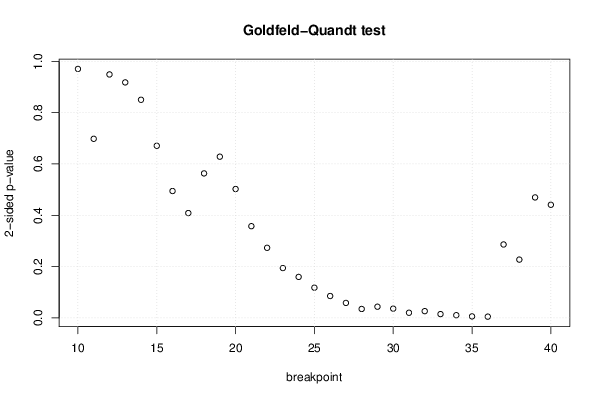
| Goldfeld-Quandt test for Heteroskedasticity | |||
| p-values | Alternative Hypothesis | ||
| breakpoint index | greater | 2-sided | less |
| 10 | 0.514958564605917 | 0.970082870788165 | 0.485041435394083 |
| 11 | 0.349014554351138 | 0.698029108702275 | 0.650985445648862 |
| 12 | 0.474346649146746 | 0.948693298293492 | 0.525653350853254 |
| 13 | 0.541179753126582 | 0.917640493746836 | 0.458820246873418 |
| 14 | 0.424999166017656 | 0.849998332035311 | 0.575000833982344 |
| 15 | 0.335397929782528 | 0.670795859565055 | 0.664602070217472 |
| 16 | 0.247283279036611 | 0.494566558073223 | 0.752716720963389 |
| 17 | 0.204366255987179 | 0.408732511974357 | 0.795633744012821 |
| 18 | 0.281599529086719 | 0.563199058173438 | 0.718400470913281 |
| 19 | 0.314125827843725 | 0.62825165568745 | 0.685874172156275 |
| 20 | 0.251194958831705 | 0.50238991766341 | 0.748805041168295 |
| 21 | 0.178798954284635 | 0.357597908569269 | 0.821201045715365 |
| 22 | 0.136698086427246 | 0.273396172854493 | 0.863301913572754 |
| 23 | 0.09726449219211 | 0.19452898438422 | 0.90273550780789 |
| 24 | 0.0800271396122424 | 0.160054279224485 | 0.919972860387758 |
| 25 | 0.0590287287341666 | 0.118057457468333 | 0.940971271265833 |
| 26 | 0.0428212911449987 | 0.0856425822899974 | 0.957178708855001 |
| 27 | 0.0293120963432408 | 0.0586241926864817 | 0.970687903656759 |
| 28 | 0.0175682082773137 | 0.0351364165546273 | 0.982431791722686 |
| 29 | 0.0219816398491034 | 0.0439632796982069 | 0.978018360150897 |
| 30 | 0.0182171583551525 | 0.0364343167103051 | 0.981782841644847 |
| 31 | 0.0101808099829864 | 0.0203616199659728 | 0.989819190017014 |
| 32 | 0.0133382562610403 | 0.0266765125220806 | 0.98666174373896 |
| 33 | 0.00761341566789316 | 0.0152268313357863 | 0.992386584332107 |
| 34 | 0.00542195613555191 | 0.0108439122711038 | 0.994578043864448 |
| 35 | 0.00308607618702332 | 0.00617215237404665 | 0.996913923812977 |
| 36 | 0.00260964554287145 | 0.00521929108574291 | 0.997390354457129 |
| 37 | 0.143163831400389 | 0.286327662800777 | 0.856836168599612 |
| 38 | 0.113720629611655 | 0.22744125922331 | 0.886279370388345 |
| 39 | 0.234809679124191 | 0.469619358248381 | 0.765190320875809 |
| 40 | 0.220463894646767 | 0.440927789293533 | 0.779536105353233 |
| Meta Analysis of Goldfeld-Quandt test for Heteroskedasticity | |||
| Description | # significant tests | % significant tests | OK/NOK |
| 1% type I error level | 2 | 0.0645161290322581 | NOK |
| 5% type I error level | 9 | 0.290322580645161 | NOK |
| 10% type I error level | 11 | 0.354838709677419 | NOK |