Free Statistics

of Irreproducible Research!

Author's title

Author*Unverified author*
R Software Modulerwasp_autocorrelation.wasp
Title produced by software(Partial) Autocorrelation Function
Date of computationFri, 16 Nov 2012 11:59:41 -0500
Cite this page as followsStatistical Computations at FreeStatistics.org, Office for Research Development and Education, URL https://freestatistics.org/blog/index.php?v=date/2012/Nov/16/t1353085207e2gi2c8zxhhq0jo.htm/, Retrieved Sat, 27 Apr 2024 09:33:51 +0000
Statistical Computations at FreeStatistics.org, Office for Research Development and Education, URL https://freestatistics.org/blog/index.php?pk=189981, Retrieved Sat, 27 Apr 2024 09:33:51 +0000
QR Codes:

Original text written by user:
IsPrivate?No (this computation is public)
User-defined keywords
Estimated Impact62
Family? (F = Feedback message, R = changed R code, M = changed R Module, P = changed Parameters, D = changed Data)
-       [(Partial) Autocorrelation Function] [Gemiddelde consum...] [2012-11-16 16:59:41] [004c7a2610af8d0adb90cce3a555dd4b] [Current]
Feedback Forum

Post a new message
Dataseries X:
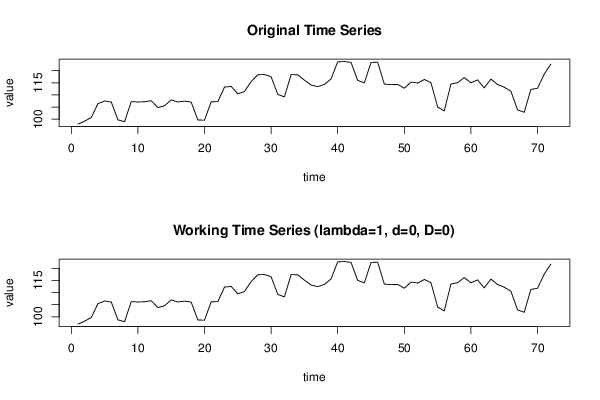
98,01
99,2
100,7
106,41
107,51
107,1
99,75
98,96
107,26
107,11
107,2
107,65
104,78
105,56
107,95
107,11
107,47
107,06
99,71
99,6
107,19
107,26
113,24
113,52
110,48
111,41
115,5
118,32
118,42
117,5
110,23
109,19
118,41
118,3
116,1
114,11
113,41
114,33
116,61
123,64
123,77
123,39
116,03
114,95
123,4
123,53
114,45
114,26
114,35
112,77
115,31
114,93
116,38
115,07
105
103,43
114,52
115,04
117,16
115
116,22
112,92
116,56
114,32
113,22
111,56
103,87
102,85
112,27
112,76
118,55
122,73


Summary of computational transaction
Raw Inputview raw input (R code)
Raw Outputview raw output of R engine
Computing time3 seconds
R Server'Sir Maurice George Kendall' @ kendall.wessa.net

\begin{tabular}{lllllllll}
\hline
Summary of computational transaction \tabularnewline
Raw Input & view raw input (R code)  \tabularnewline
Raw Output & view raw output of R engine  \tabularnewline
Computing time & 3 seconds \tabularnewline
R Server & 'Sir Maurice George Kendall' @ kendall.wessa.net \tabularnewline
\hline
\end{tabular}
%Source: https://freestatistics.org/blog/index.php?pk=189981&T=0

[TABLE]
[ROW][C]Summary of computational transaction[/C][/ROW]
[ROW][C]Raw Input[/C][C]view raw input (R code) [/C][/ROW]
[ROW][C]Raw Output[/C][C]view raw output of R engine [/C][/ROW]
[ROW][C]Computing time[/C][C]3 seconds[/C][/ROW]
[ROW][C]R Server[/C][C]'Sir Maurice George Kendall' @ kendall.wessa.net[/C][/ROW]
[/TABLE]
Source: https://freestatistics.org/blog/index.php?pk=189981&T=0

Globally Unique Identifier (entire table): ba.freestatistics.org/blog/index.php?pk=189981&T=0

As an alternative you can also use a QR Code:  

The GUIDs for individual cells are displayed in the table below:

Summary of computational transaction
Raw Inputview raw input (R code)
Raw Outputview raw output of R engine
Computing time3 seconds
R Server'Sir Maurice George Kendall' @ kendall.wessa.net


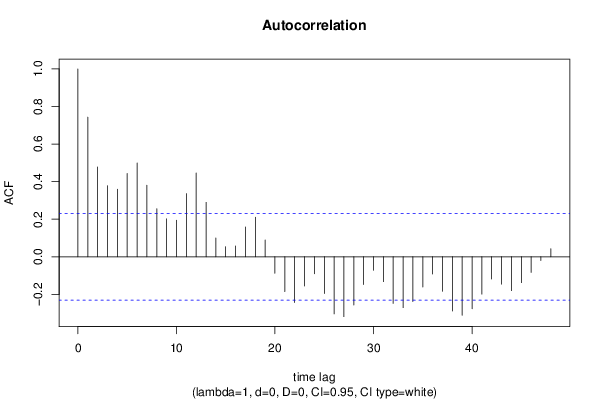
Autocorrelation Function
Time lag kACF(k)T-STATP-value
10.743416.3080
20.4783324.05886.2e-05
30.3779063.20660.001002
40.3598863.05370.001583
50.4436213.76420.000169
60.4993144.23683.3e-05
70.3808183.23130.000929
80.2561522.17350.016515
90.2021481.71530.045297
100.1943041.64870.051781
110.3364752.85510.002809
120.4462683.78670.000157
130.2898822.45970.008153
140.1001820.85010.199052
150.0534520.45360.325757
160.0576410.48910.313128
170.1589441.34870.090833
180.210911.78960.038859
190.0898220.76220.224226
20-0.087866-0.74560.229179
21-0.185239-1.57180.06019
22-0.242961-2.06160.021429
23-0.155281-1.31760.095907
24-0.090242-0.76570.22317
25-0.195386-1.65790.050844
26-0.304008-2.57960.005966
27-0.318603-2.70340.004278
28-0.257026-2.18090.016228
29-0.147547-1.2520.107315
30-0.071293-0.60490.273561
31-0.132063-1.12060.133092
32-0.248154-2.10570.019361
33-0.27065-2.29650.012279
34-0.23839-2.02280.023404
35-0.160386-1.36090.088892
36-0.091991-0.78060.218807
37-0.183729-1.5590.061692
38-0.28853-2.44830.008396
39-0.311414-2.64240.005046
40-0.276709-2.3480.010814
41-0.198892-1.68770.047902
42-0.118084-1.0020.159856
43-0.145629-1.23570.110292
44-0.180162-1.52870.065357
45-0.137634-1.16790.123357
46-0.083056-0.70470.24162
47-0.020053-0.17020.432682
480.0425750.36130.359482

\begin{tabular}{lllllllll}
\hline
Autocorrelation Function \tabularnewline
Time lag k & ACF(k) & T-STAT & P-value \tabularnewline
1 & 0.74341 & 6.308 & 0 \tabularnewline
2 & 0.478332 & 4.0588 & 6.2e-05 \tabularnewline
3 & 0.377906 & 3.2066 & 0.001002 \tabularnewline
4 & 0.359886 & 3.0537 & 0.001583 \tabularnewline
5 & 0.443621 & 3.7642 & 0.000169 \tabularnewline
6 & 0.499314 & 4.2368 & 3.3e-05 \tabularnewline
7 & 0.380818 & 3.2313 & 0.000929 \tabularnewline
8 & 0.256152 & 2.1735 & 0.016515 \tabularnewline
9 & 0.202148 & 1.7153 & 0.045297 \tabularnewline
10 & 0.194304 & 1.6487 & 0.051781 \tabularnewline
11 & 0.336475 & 2.8551 & 0.002809 \tabularnewline
12 & 0.446268 & 3.7867 & 0.000157 \tabularnewline
13 & 0.289882 & 2.4597 & 0.008153 \tabularnewline
14 & 0.100182 & 0.8501 & 0.199052 \tabularnewline
15 & 0.053452 & 0.4536 & 0.325757 \tabularnewline
16 & 0.057641 & 0.4891 & 0.313128 \tabularnewline
17 & 0.158944 & 1.3487 & 0.090833 \tabularnewline
18 & 0.21091 & 1.7896 & 0.038859 \tabularnewline
19 & 0.089822 & 0.7622 & 0.224226 \tabularnewline
20 & -0.087866 & -0.7456 & 0.229179 \tabularnewline
21 & -0.185239 & -1.5718 & 0.06019 \tabularnewline
22 & -0.242961 & -2.0616 & 0.021429 \tabularnewline
23 & -0.155281 & -1.3176 & 0.095907 \tabularnewline
24 & -0.090242 & -0.7657 & 0.22317 \tabularnewline
25 & -0.195386 & -1.6579 & 0.050844 \tabularnewline
26 & -0.304008 & -2.5796 & 0.005966 \tabularnewline
27 & -0.318603 & -2.7034 & 0.004278 \tabularnewline
28 & -0.257026 & -2.1809 & 0.016228 \tabularnewline
29 & -0.147547 & -1.252 & 0.107315 \tabularnewline
30 & -0.071293 & -0.6049 & 0.273561 \tabularnewline
31 & -0.132063 & -1.1206 & 0.133092 \tabularnewline
32 & -0.248154 & -2.1057 & 0.019361 \tabularnewline
33 & -0.27065 & -2.2965 & 0.012279 \tabularnewline
34 & -0.23839 & -2.0228 & 0.023404 \tabularnewline
35 & -0.160386 & -1.3609 & 0.088892 \tabularnewline
36 & -0.091991 & -0.7806 & 0.218807 \tabularnewline
37 & -0.183729 & -1.559 & 0.061692 \tabularnewline
38 & -0.28853 & -2.4483 & 0.008396 \tabularnewline
39 & -0.311414 & -2.6424 & 0.005046 \tabularnewline
40 & -0.276709 & -2.348 & 0.010814 \tabularnewline
41 & -0.198892 & -1.6877 & 0.047902 \tabularnewline
42 & -0.118084 & -1.002 & 0.159856 \tabularnewline
43 & -0.145629 & -1.2357 & 0.110292 \tabularnewline
44 & -0.180162 & -1.5287 & 0.065357 \tabularnewline
45 & -0.137634 & -1.1679 & 0.123357 \tabularnewline
46 & -0.083056 & -0.7047 & 0.24162 \tabularnewline
47 & -0.020053 & -0.1702 & 0.432682 \tabularnewline
48 & 0.042575 & 0.3613 & 0.359482 \tabularnewline
\hline
\end{tabular}
%Source: https://freestatistics.org/blog/index.php?pk=189981&T=1

[TABLE]
[ROW][C]Autocorrelation Function[/C][/ROW]
[ROW][C]Time lag k[/C][C]ACF(k)[/C][C]T-STAT[/C][C]P-value[/C][/ROW]
[ROW][C]1[/C][C]0.74341[/C][C]6.308[/C][C]0[/C][/ROW]
[ROW][C]2[/C][C]0.478332[/C][C]4.0588[/C][C]6.2e-05[/C][/ROW]
[ROW][C]3[/C][C]0.377906[/C][C]3.2066[/C][C]0.001002[/C][/ROW]
[ROW][C]4[/C][C]0.359886[/C][C]3.0537[/C][C]0.001583[/C][/ROW]
[ROW][C]5[/C][C]0.443621[/C][C]3.7642[/C][C]0.000169[/C][/ROW]
[ROW][C]6[/C][C]0.499314[/C][C]4.2368[/C][C]3.3e-05[/C][/ROW]
[ROW][C]7[/C][C]0.380818[/C][C]3.2313[/C][C]0.000929[/C][/ROW]
[ROW][C]8[/C][C]0.256152[/C][C]2.1735[/C][C]0.016515[/C][/ROW]
[ROW][C]9[/C][C]0.202148[/C][C]1.7153[/C][C]0.045297[/C][/ROW]
[ROW][C]10[/C][C]0.194304[/C][C]1.6487[/C][C]0.051781[/C][/ROW]
[ROW][C]11[/C][C]0.336475[/C][C]2.8551[/C][C]0.002809[/C][/ROW]
[ROW][C]12[/C][C]0.446268[/C][C]3.7867[/C][C]0.000157[/C][/ROW]
[ROW][C]13[/C][C]0.289882[/C][C]2.4597[/C][C]0.008153[/C][/ROW]
[ROW][C]14[/C][C]0.100182[/C][C]0.8501[/C][C]0.199052[/C][/ROW]
[ROW][C]15[/C][C]0.053452[/C][C]0.4536[/C][C]0.325757[/C][/ROW]
[ROW][C]16[/C][C]0.057641[/C][C]0.4891[/C][C]0.313128[/C][/ROW]
[ROW][C]17[/C][C]0.158944[/C][C]1.3487[/C][C]0.090833[/C][/ROW]
[ROW][C]18[/C][C]0.21091[/C][C]1.7896[/C][C]0.038859[/C][/ROW]
[ROW][C]19[/C][C]0.089822[/C][C]0.7622[/C][C]0.224226[/C][/ROW]
[ROW][C]20[/C][C]-0.087866[/C][C]-0.7456[/C][C]0.229179[/C][/ROW]
[ROW][C]21[/C][C]-0.185239[/C][C]-1.5718[/C][C]0.06019[/C][/ROW]
[ROW][C]22[/C][C]-0.242961[/C][C]-2.0616[/C][C]0.021429[/C][/ROW]
[ROW][C]23[/C][C]-0.155281[/C][C]-1.3176[/C][C]0.095907[/C][/ROW]
[ROW][C]24[/C][C]-0.090242[/C][C]-0.7657[/C][C]0.22317[/C][/ROW]
[ROW][C]25[/C][C]-0.195386[/C][C]-1.6579[/C][C]0.050844[/C][/ROW]
[ROW][C]26[/C][C]-0.304008[/C][C]-2.5796[/C][C]0.005966[/C][/ROW]
[ROW][C]27[/C][C]-0.318603[/C][C]-2.7034[/C][C]0.004278[/C][/ROW]
[ROW][C]28[/C][C]-0.257026[/C][C]-2.1809[/C][C]0.016228[/C][/ROW]
[ROW][C]29[/C][C]-0.147547[/C][C]-1.252[/C][C]0.107315[/C][/ROW]
[ROW][C]30[/C][C]-0.071293[/C][C]-0.6049[/C][C]0.273561[/C][/ROW]
[ROW][C]31[/C][C]-0.132063[/C][C]-1.1206[/C][C]0.133092[/C][/ROW]
[ROW][C]32[/C][C]-0.248154[/C][C]-2.1057[/C][C]0.019361[/C][/ROW]
[ROW][C]33[/C][C]-0.27065[/C][C]-2.2965[/C][C]0.012279[/C][/ROW]
[ROW][C]34[/C][C]-0.23839[/C][C]-2.0228[/C][C]0.023404[/C][/ROW]
[ROW][C]35[/C][C]-0.160386[/C][C]-1.3609[/C][C]0.088892[/C][/ROW]
[ROW][C]36[/C][C]-0.091991[/C][C]-0.7806[/C][C]0.218807[/C][/ROW]
[ROW][C]37[/C][C]-0.183729[/C][C]-1.559[/C][C]0.061692[/C][/ROW]
[ROW][C]38[/C][C]-0.28853[/C][C]-2.4483[/C][C]0.008396[/C][/ROW]
[ROW][C]39[/C][C]-0.311414[/C][C]-2.6424[/C][C]0.005046[/C][/ROW]
[ROW][C]40[/C][C]-0.276709[/C][C]-2.348[/C][C]0.010814[/C][/ROW]
[ROW][C]41[/C][C]-0.198892[/C][C]-1.6877[/C][C]0.047902[/C][/ROW]
[ROW][C]42[/C][C]-0.118084[/C][C]-1.002[/C][C]0.159856[/C][/ROW]
[ROW][C]43[/C][C]-0.145629[/C][C]-1.2357[/C][C]0.110292[/C][/ROW]
[ROW][C]44[/C][C]-0.180162[/C][C]-1.5287[/C][C]0.065357[/C][/ROW]
[ROW][C]45[/C][C]-0.137634[/C][C]-1.1679[/C][C]0.123357[/C][/ROW]
[ROW][C]46[/C][C]-0.083056[/C][C]-0.7047[/C][C]0.24162[/C][/ROW]
[ROW][C]47[/C][C]-0.020053[/C][C]-0.1702[/C][C]0.432682[/C][/ROW]
[ROW][C]48[/C][C]0.042575[/C][C]0.3613[/C][C]0.359482[/C][/ROW]
[/TABLE]
Source: https://freestatistics.org/blog/index.php?pk=189981&T=1

Globally Unique Identifier (entire table): ba.freestatistics.org/blog/index.php?pk=189981&T=1

As an alternative you can also use a QR Code:  

The GUIDs for individual cells are displayed in the table below:

Autocorrelation Function
Time lag kACF(k)T-STATP-value
10.743416.3080
20.4783324.05886.2e-05
30.3779063.20660.001002
40.3598863.05370.001583
50.4436213.76420.000169
60.4993144.23683.3e-05
70.3808183.23130.000929
80.2561522.17350.016515
90.2021481.71530.045297
100.1943041.64870.051781
110.3364752.85510.002809
120.4462683.78670.000157
130.2898822.45970.008153
140.1001820.85010.199052
150.0534520.45360.325757
160.0576410.48910.313128
170.1589441.34870.090833
180.210911.78960.038859
190.0898220.76220.224226
20-0.087866-0.74560.229179
21-0.185239-1.57180.06019
22-0.242961-2.06160.021429
23-0.155281-1.31760.095907
24-0.090242-0.76570.22317
25-0.195386-1.65790.050844
26-0.304008-2.57960.005966
27-0.318603-2.70340.004278
28-0.257026-2.18090.016228
29-0.147547-1.2520.107315
30-0.071293-0.60490.273561
31-0.132063-1.12060.133092
32-0.248154-2.10570.019361
33-0.27065-2.29650.012279
34-0.23839-2.02280.023404
35-0.160386-1.36090.088892
36-0.091991-0.78060.218807
37-0.183729-1.5590.061692
38-0.28853-2.44830.008396
39-0.311414-2.64240.005046
40-0.276709-2.3480.010814
41-0.198892-1.68770.047902
42-0.118084-1.0020.159856
43-0.145629-1.23570.110292
44-0.180162-1.52870.065357
45-0.137634-1.16790.123357
46-0.083056-0.70470.24162
47-0.020053-0.17020.432682
480.0425750.36130.359482


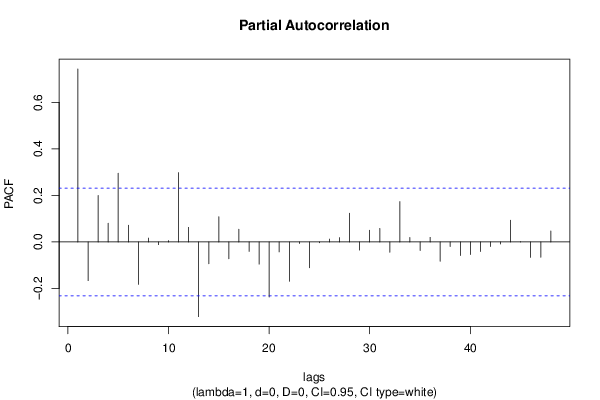
Partial Autocorrelation Function
Time lag kPACF(k)T-STATP-value
10.743416.3080
2-0.16615-1.40980.081448
30.1994171.69210.047475
40.0806040.6840.248101
50.2956132.50840.007191
60.0721330.61210.271209
7-0.182084-1.5450.063361
80.0166360.14120.444068
9-0.011269-0.09560.462042
100.0060140.0510.479721
110.2979722.52840.006826
120.0629740.53430.297373
13-0.320792-2.7220.004066
14-0.093446-0.79290.215217
150.1082280.91830.180752
16-0.071848-0.60970.272005
170.0547240.46440.321898
18-0.040281-0.34180.366749
19-0.09525-0.80820.210812
20-0.236597-2.00760.02422
21-0.042668-0.3620.359188
22-0.168664-1.43120.078355
23-0.006276-0.05320.47884
24-0.110498-0.93760.17579
25-0.003556-0.03020.488007
260.0124470.10560.45809
270.0186480.15820.437357
280.1237081.04970.148684
29-0.034867-0.29590.384095
300.0502470.42640.335559
310.0583570.49520.310993
32-0.044143-0.37460.354541
330.1733661.47110.072816
340.0191790.16270.43559
35-0.036509-0.30980.37881
360.0199290.16910.433096
37-0.082819-0.70270.242241
38-0.019683-0.1670.433912
39-0.058075-0.49280.311833
40-0.053807-0.45660.324679
41-0.04104-0.34820.36434
42-0.019595-0.16630.434206
43-0.008814-0.07480.470294
440.0937110.79520.214567
450.0009930.00840.49665
46-0.066255-0.56220.287864
47-0.065548-0.55620.289902
480.0475880.40380.34378

\begin{tabular}{lllllllll}
\hline
Partial Autocorrelation Function \tabularnewline
Time lag k & PACF(k) & T-STAT & P-value \tabularnewline
1 & 0.74341 & 6.308 & 0 \tabularnewline
2 & -0.16615 & -1.4098 & 0.081448 \tabularnewline
3 & 0.199417 & 1.6921 & 0.047475 \tabularnewline
4 & 0.080604 & 0.684 & 0.248101 \tabularnewline
5 & 0.295613 & 2.5084 & 0.007191 \tabularnewline
6 & 0.072133 & 0.6121 & 0.271209 \tabularnewline
7 & -0.182084 & -1.545 & 0.063361 \tabularnewline
8 & 0.016636 & 0.1412 & 0.444068 \tabularnewline
9 & -0.011269 & -0.0956 & 0.462042 \tabularnewline
10 & 0.006014 & 0.051 & 0.479721 \tabularnewline
11 & 0.297972 & 2.5284 & 0.006826 \tabularnewline
12 & 0.062974 & 0.5343 & 0.297373 \tabularnewline
13 & -0.320792 & -2.722 & 0.004066 \tabularnewline
14 & -0.093446 & -0.7929 & 0.215217 \tabularnewline
15 & 0.108228 & 0.9183 & 0.180752 \tabularnewline
16 & -0.071848 & -0.6097 & 0.272005 \tabularnewline
17 & 0.054724 & 0.4644 & 0.321898 \tabularnewline
18 & -0.040281 & -0.3418 & 0.366749 \tabularnewline
19 & -0.09525 & -0.8082 & 0.210812 \tabularnewline
20 & -0.236597 & -2.0076 & 0.02422 \tabularnewline
21 & -0.042668 & -0.362 & 0.359188 \tabularnewline
22 & -0.168664 & -1.4312 & 0.078355 \tabularnewline
23 & -0.006276 & -0.0532 & 0.47884 \tabularnewline
24 & -0.110498 & -0.9376 & 0.17579 \tabularnewline
25 & -0.003556 & -0.0302 & 0.488007 \tabularnewline
26 & 0.012447 & 0.1056 & 0.45809 \tabularnewline
27 & 0.018648 & 0.1582 & 0.437357 \tabularnewline
28 & 0.123708 & 1.0497 & 0.148684 \tabularnewline
29 & -0.034867 & -0.2959 & 0.384095 \tabularnewline
30 & 0.050247 & 0.4264 & 0.335559 \tabularnewline
31 & 0.058357 & 0.4952 & 0.310993 \tabularnewline
32 & -0.044143 & -0.3746 & 0.354541 \tabularnewline
33 & 0.173366 & 1.4711 & 0.072816 \tabularnewline
34 & 0.019179 & 0.1627 & 0.43559 \tabularnewline
35 & -0.036509 & -0.3098 & 0.37881 \tabularnewline
36 & 0.019929 & 0.1691 & 0.433096 \tabularnewline
37 & -0.082819 & -0.7027 & 0.242241 \tabularnewline
38 & -0.019683 & -0.167 & 0.433912 \tabularnewline
39 & -0.058075 & -0.4928 & 0.311833 \tabularnewline
40 & -0.053807 & -0.4566 & 0.324679 \tabularnewline
41 & -0.04104 & -0.3482 & 0.36434 \tabularnewline
42 & -0.019595 & -0.1663 & 0.434206 \tabularnewline
43 & -0.008814 & -0.0748 & 0.470294 \tabularnewline
44 & 0.093711 & 0.7952 & 0.214567 \tabularnewline
45 & 0.000993 & 0.0084 & 0.49665 \tabularnewline
46 & -0.066255 & -0.5622 & 0.287864 \tabularnewline
47 & -0.065548 & -0.5562 & 0.289902 \tabularnewline
48 & 0.047588 & 0.4038 & 0.34378 \tabularnewline
\hline
\end{tabular}
%Source: https://freestatistics.org/blog/index.php?pk=189981&T=2

[TABLE]
[ROW][C]Partial Autocorrelation Function[/C][/ROW]
[ROW][C]Time lag k[/C][C]PACF(k)[/C][C]T-STAT[/C][C]P-value[/C][/ROW]
[ROW][C]1[/C][C]0.74341[/C][C]6.308[/C][C]0[/C][/ROW]
[ROW][C]2[/C][C]-0.16615[/C][C]-1.4098[/C][C]0.081448[/C][/ROW]
[ROW][C]3[/C][C]0.199417[/C][C]1.6921[/C][C]0.047475[/C][/ROW]
[ROW][C]4[/C][C]0.080604[/C][C]0.684[/C][C]0.248101[/C][/ROW]
[ROW][C]5[/C][C]0.295613[/C][C]2.5084[/C][C]0.007191[/C][/ROW]
[ROW][C]6[/C][C]0.072133[/C][C]0.6121[/C][C]0.271209[/C][/ROW]
[ROW][C]7[/C][C]-0.182084[/C][C]-1.545[/C][C]0.063361[/C][/ROW]
[ROW][C]8[/C][C]0.016636[/C][C]0.1412[/C][C]0.444068[/C][/ROW]
[ROW][C]9[/C][C]-0.011269[/C][C]-0.0956[/C][C]0.462042[/C][/ROW]
[ROW][C]10[/C][C]0.006014[/C][C]0.051[/C][C]0.479721[/C][/ROW]
[ROW][C]11[/C][C]0.297972[/C][C]2.5284[/C][C]0.006826[/C][/ROW]
[ROW][C]12[/C][C]0.062974[/C][C]0.5343[/C][C]0.297373[/C][/ROW]
[ROW][C]13[/C][C]-0.320792[/C][C]-2.722[/C][C]0.004066[/C][/ROW]
[ROW][C]14[/C][C]-0.093446[/C][C]-0.7929[/C][C]0.215217[/C][/ROW]
[ROW][C]15[/C][C]0.108228[/C][C]0.9183[/C][C]0.180752[/C][/ROW]
[ROW][C]16[/C][C]-0.071848[/C][C]-0.6097[/C][C]0.272005[/C][/ROW]
[ROW][C]17[/C][C]0.054724[/C][C]0.4644[/C][C]0.321898[/C][/ROW]
[ROW][C]18[/C][C]-0.040281[/C][C]-0.3418[/C][C]0.366749[/C][/ROW]
[ROW][C]19[/C][C]-0.09525[/C][C]-0.8082[/C][C]0.210812[/C][/ROW]
[ROW][C]20[/C][C]-0.236597[/C][C]-2.0076[/C][C]0.02422[/C][/ROW]
[ROW][C]21[/C][C]-0.042668[/C][C]-0.362[/C][C]0.359188[/C][/ROW]
[ROW][C]22[/C][C]-0.168664[/C][C]-1.4312[/C][C]0.078355[/C][/ROW]
[ROW][C]23[/C][C]-0.006276[/C][C]-0.0532[/C][C]0.47884[/C][/ROW]
[ROW][C]24[/C][C]-0.110498[/C][C]-0.9376[/C][C]0.17579[/C][/ROW]
[ROW][C]25[/C][C]-0.003556[/C][C]-0.0302[/C][C]0.488007[/C][/ROW]
[ROW][C]26[/C][C]0.012447[/C][C]0.1056[/C][C]0.45809[/C][/ROW]
[ROW][C]27[/C][C]0.018648[/C][C]0.1582[/C][C]0.437357[/C][/ROW]
[ROW][C]28[/C][C]0.123708[/C][C]1.0497[/C][C]0.148684[/C][/ROW]
[ROW][C]29[/C][C]-0.034867[/C][C]-0.2959[/C][C]0.384095[/C][/ROW]
[ROW][C]30[/C][C]0.050247[/C][C]0.4264[/C][C]0.335559[/C][/ROW]
[ROW][C]31[/C][C]0.058357[/C][C]0.4952[/C][C]0.310993[/C][/ROW]
[ROW][C]32[/C][C]-0.044143[/C][C]-0.3746[/C][C]0.354541[/C][/ROW]
[ROW][C]33[/C][C]0.173366[/C][C]1.4711[/C][C]0.072816[/C][/ROW]
[ROW][C]34[/C][C]0.019179[/C][C]0.1627[/C][C]0.43559[/C][/ROW]
[ROW][C]35[/C][C]-0.036509[/C][C]-0.3098[/C][C]0.37881[/C][/ROW]
[ROW][C]36[/C][C]0.019929[/C][C]0.1691[/C][C]0.433096[/C][/ROW]
[ROW][C]37[/C][C]-0.082819[/C][C]-0.7027[/C][C]0.242241[/C][/ROW]
[ROW][C]38[/C][C]-0.019683[/C][C]-0.167[/C][C]0.433912[/C][/ROW]
[ROW][C]39[/C][C]-0.058075[/C][C]-0.4928[/C][C]0.311833[/C][/ROW]
[ROW][C]40[/C][C]-0.053807[/C][C]-0.4566[/C][C]0.324679[/C][/ROW]
[ROW][C]41[/C][C]-0.04104[/C][C]-0.3482[/C][C]0.36434[/C][/ROW]
[ROW][C]42[/C][C]-0.019595[/C][C]-0.1663[/C][C]0.434206[/C][/ROW]
[ROW][C]43[/C][C]-0.008814[/C][C]-0.0748[/C][C]0.470294[/C][/ROW]
[ROW][C]44[/C][C]0.093711[/C][C]0.7952[/C][C]0.214567[/C][/ROW]
[ROW][C]45[/C][C]0.000993[/C][C]0.0084[/C][C]0.49665[/C][/ROW]
[ROW][C]46[/C][C]-0.066255[/C][C]-0.5622[/C][C]0.287864[/C][/ROW]
[ROW][C]47[/C][C]-0.065548[/C][C]-0.5562[/C][C]0.289902[/C][/ROW]
[ROW][C]48[/C][C]0.047588[/C][C]0.4038[/C][C]0.34378[/C][/ROW]
[/TABLE]
Source: https://freestatistics.org/blog/index.php?pk=189981&T=2

Globally Unique Identifier (entire table): ba.freestatistics.org/blog/index.php?pk=189981&T=2

As an alternative you can also use a QR Code:  

The GUIDs for individual cells are displayed in the table below:

Partial Autocorrelation Function
Time lag kPACF(k)T-STATP-value
10.743416.3080
2-0.16615-1.40980.081448
30.1994171.69210.047475
40.0806040.6840.248101
50.2956132.50840.007191
60.0721330.61210.271209
7-0.182084-1.5450.063361
80.0166360.14120.444068
9-0.011269-0.09560.462042
100.0060140.0510.479721
110.2979722.52840.006826
120.0629740.53430.297373
13-0.320792-2.7220.004066
14-0.093446-0.79290.215217
150.1082280.91830.180752
16-0.071848-0.60970.272005
170.0547240.46440.321898
18-0.040281-0.34180.366749
19-0.09525-0.80820.210812
20-0.236597-2.00760.02422
21-0.042668-0.3620.359188
22-0.168664-1.43120.078355
23-0.006276-0.05320.47884
24-0.110498-0.93760.17579
25-0.003556-0.03020.488007
260.0124470.10560.45809
270.0186480.15820.437357
280.1237081.04970.148684
29-0.034867-0.29590.384095
300.0502470.42640.335559
310.0583570.49520.310993
32-0.044143-0.37460.354541
330.1733661.47110.072816
340.0191790.16270.43559
35-0.036509-0.30980.37881
360.0199290.16910.433096
37-0.082819-0.70270.242241
38-0.019683-0.1670.433912
39-0.058075-0.49280.311833
40-0.053807-0.45660.324679
41-0.04104-0.34820.36434
42-0.019595-0.16630.434206
43-0.008814-0.07480.470294
440.0937110.79520.214567
450.0009930.00840.49665
46-0.066255-0.56220.287864
47-0.065548-0.55620.289902
480.0475880.40380.34378


Parameters (Session):
par1 = 48 ; par2 = 1 ; par3 = 0 ; par4 = 0 ; par5 = 12 ; par6 = White Noise ; par7 = 0.95 ;
Parameters (R input):
par1 = 48 ; par2 = 1 ; par3 = 0 ; par4 = 0 ; par5 = 12 ; par6 = White Noise ; par7 = 0.95 ; par8 = ;
R code (references can be found in the software module):
if (par1 == 'Default') {
par1 = 10*log10(length(x))
} else {
par1 <- as.numeric(par1)
}
par2 <- as.numeric(par2)
par3 <- as.numeric(par3)
par4 <- as.numeric(par4)
par5 <- as.numeric(par5)
if (par6 == 'White Noise') par6 <- 'white' else par6 <- 'ma'
par7 <- as.numeric(par7)
if (par8 != '') par8 <- as.numeric(par8)
ox <- x
if (par8 == '') {
if (par2 == 0) {
x <- log(x)
} else {
x <- (x ^ par2 - 1) / par2
}
} else {
x <- log(x,base=par8)
}
if (par3 > 0) x <- diff(x,lag=1,difference=par3)
if (par4 > 0) x <- diff(x,lag=par5,difference=par4)
bitmap(file='picts.png')
op <- par(mfrow=c(2,1))
plot(ox,type='l',main='Original Time Series',xlab='time',ylab='value')
if (par8=='') {
mytitle <- paste('Working Time Series (lambda=',par2,', d=',par3,', D=',par4,')',sep='')
mysub <- paste('(lambda=',par2,', d=',par3,', D=',par4,', CI=', par7, ', CI type=',par6,')',sep='')
} else {
mytitle <- paste('Working Time Series (base=',par8,', d=',par3,', D=',par4,')',sep='')
mysub <- paste('(base=',par8,', d=',par3,', D=',par4,', CI=', par7, ', CI type=',par6,')',sep='')
}
plot(x,type='l', main=mytitle,xlab='time',ylab='value')
par(op)
dev.off()
bitmap(file='pic1.png')
racf <- acf(x, par1, main='Autocorrelation', xlab='time lag', ylab='ACF', ci.type=par6, ci=par7, sub=mysub)
dev.off()
bitmap(file='pic2.png')
rpacf <- pacf(x,par1,main='Partial Autocorrelation',xlab='lags',ylab='PACF',sub=mysub)
dev.off()
(myacf <- c(racf$acf))
(mypacf <- c(rpacf$acf))
lengthx <- length(x)
sqrtn <- sqrt(lengthx)
load(file='createtable')
a<-table.start()
a<-table.row.start(a)
a<-table.element(a,'Autocorrelation Function',4,TRUE)
a<-table.row.end(a)
a<-table.row.start(a)
a<-table.element(a,'Time lag k',header=TRUE)
a<-table.element(a,hyperlink('basics.htm','ACF(k)','click here for more information about the Autocorrelation Function'),header=TRUE)
a<-table.element(a,'T-STAT',header=TRUE)
a<-table.element(a,'P-value',header=TRUE)
a<-table.row.end(a)
for (i in 2:(par1+1)) {
a<-table.row.start(a)
a<-table.element(a,i-1,header=TRUE)
a<-table.element(a,round(myacf[i],6))
mytstat <- myacf[i]*sqrtn
a<-table.element(a,round(mytstat,4))
a<-table.element(a,round(1-pt(abs(mytstat),lengthx),6))
a<-table.row.end(a)
}
a<-table.end(a)
table.save(a,file='mytable.tab')
a<-table.start()
a<-table.row.start(a)
a<-table.element(a,'Partial Autocorrelation Function',4,TRUE)
a<-table.row.end(a)
a<-table.row.start(a)
a<-table.element(a,'Time lag k',header=TRUE)
a<-table.element(a,hyperlink('basics.htm','PACF(k)','click here for more information about the Partial Autocorrelation Function'),header=TRUE)
a<-table.element(a,'T-STAT',header=TRUE)
a<-table.element(a,'P-value',header=TRUE)
a<-table.row.end(a)
for (i in 1:par1) {
a<-table.row.start(a)
a<-table.element(a,i,header=TRUE)
a<-table.element(a,round(mypacf[i],6))
mytstat <- mypacf[i]*sqrtn
a<-table.element(a,round(mytstat,4))
a<-table.element(a,round(1-pt(abs(mytstat),lengthx),6))
a<-table.row.end(a)
}
a<-table.end(a)
table.save(a,file='mytable1.tab')