| Multiple Linear Regression - Estimated Regression Equation |
| Vervoer[t] = + 571.904681422643 -1.40459287981778VoedingsmiddelenEnDranken[t] + 0.484331344917395Tabak[t] -3.36887528975686KledingEnSchoeisel[t] + 0.597116854081499`Huisvesting,water,elektriciteit,gas`[t] + 0.367282982725115StofferingEnOnderhoudVanWoning[t] -1.80583285610949Gezondheidsuitgaven[t] -0.812407529113463Communicatie[t] -1.03263668282893RecreatieEnCultuur[t] + 0.114569379912798Onderwijs[t] -0.899373119097168`Hotels,caf\303\251sEnRestaurants`[t] + 2.94648422505312DiverseGoederenEnDiensten[t] + e[t] |
| Multiple Linear Regression - Ordinary Least Squares | |||||
| Variable | Parameter | S.D. | T-STAT H0: parameter = 0 | 2-tail p-value | 1-tail p-value |
| (Intercept) | 571.904681422643 | 107.064686 | 5.3417 | 2e-06 | 1e-06 |
| VoedingsmiddelenEnDranken | -1.40459287981778 | 0.449075 | -3.1277 | 0.002963 | 0.001481 |
| Tabak | 0.484331344917395 | 0.285363 | 1.6972 | 0.095994 | 0.047997 |
| KledingEnSchoeisel | -3.36887528975686 | 0.784846 | -4.2924 | 8.3e-05 | 4.2e-05 |
| `Huisvesting,water,elektriciteit,gas` | 0.597116854081499 | 0.136069 | 4.3883 | 6.1e-05 | 3e-05 |
| StofferingEnOnderhoudVanWoning | 0.367282982725115 | 1.027822 | 0.3573 | 0.722371 | 0.361186 |
| Gezondheidsuitgaven | -1.80583285610949 | 0.710747 | -2.5408 | 0.014279 | 0.00714 |
| Communicatie | -0.812407529113463 | 0.363962 | -2.2321 | 0.030211 | 0.015106 |
| RecreatieEnCultuur | -1.03263668282893 | 0.317068 | -3.2568 | 0.002048 | 0.001024 |
| Onderwijs | 0.114569379912798 | 0.254405 | 0.4503 | 0.65445 | 0.327225 |
| `Hotels,caf\303\251sEnRestaurants` | -0.899373119097168 | 0.265902 | -3.3823 | 0.00142 | 0.00071 |
| DiverseGoederenEnDiensten | 2.94648422505312 | 0.634157 | 4.6463 | 2.6e-05 | 1.3e-05 |
| Multiple Linear Regression - Regression Statistics | |
| Multiple R | 0.971939109628318 |
| R-squared | 0.944665632825087 |
| Adjusted R-squared | 0.932243632030719 |
| F-TEST (value) | 76.0477839651538 |
| F-TEST (DF numerator) | 11 |
| F-TEST (DF denominator) | 49 |
| p-value | 0 |
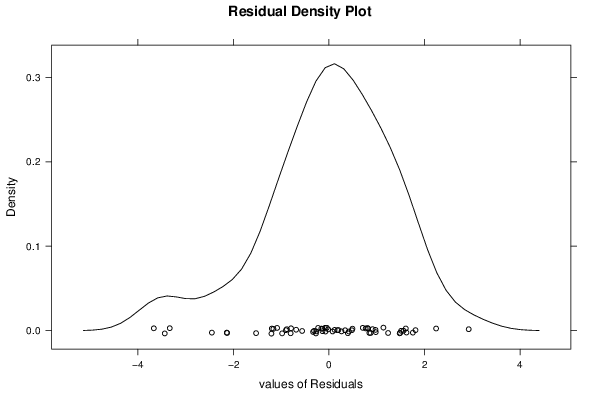
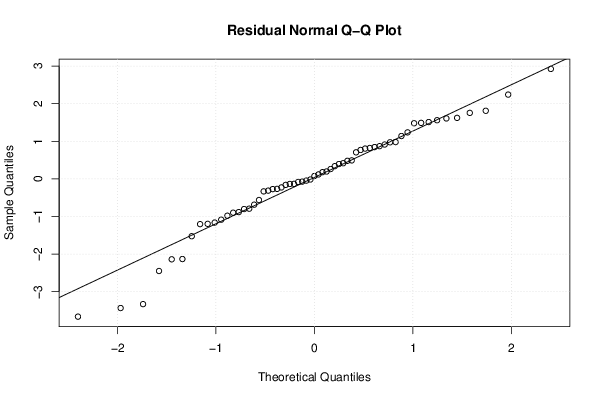
| Multiple Linear Regression - Residual Statistics | |
| Residual Standard Deviation | 1.49156339063183 |
| Sum Squared Residuals | 109.013306065383 |
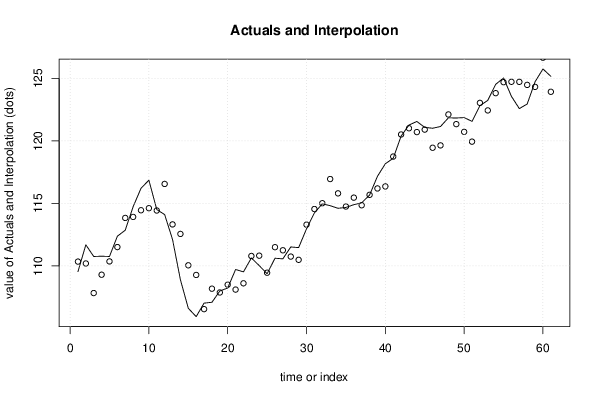
| Multiple Linear Regression - Actuals, Interpolation, and Residuals | |||
| Time or Index | Actuals | Interpolation Forecast | Residuals Prediction Error |
| 1 | 109.55 | 110.351923884357 | -0.801923884357248 |
| 2 | 111.69 | 110.201725418473 | 1.4882745815275 |
| 3 | 110.76 | 107.837661033197 | 2.9223389668034 |
| 4 | 110.78 | 109.30145490144 | 1.47854509856033 |
| 5 | 110.76 | 110.365722355334 | 0.394277644665746 |
| 6 | 112.38 | 111.510478582187 | 0.869521417813132 |
| 7 | 112.86 | 113.83985569357 | -0.979855693569853 |
| 8 | 114.74 | 113.919476952219 | 0.820523047780867 |
| 9 | 116.21 | 114.455580768667 | 1.75441923133334 |
| 10 | 116.86 | 114.619394288104 | 2.24060571189649 |
| 11 | 114.51 | 114.43433605778 | 0.0756639422197657 |
| 12 | 114.11 | 116.559597682955 | -2.44959768295472 |
| 13 | 112.12 | 113.323740723213 | -1.20374072321267 |
| 14 | 108.9 | 112.563714527409 | -3.66371452740855 |
| 15 | 106.62 | 110.055119247637 | -3.43511924763663 |
| 16 | 105.95 | 109.28060831275 | -3.33060831274986 |
| 17 | 107.03 | 106.550358241496 | 0.479641758504378 |
| 18 | 107.1 | 108.184941803012 | -1.0849418030118 |
| 19 | 108 | 107.882549737156 | 0.117450262844414 |
| 20 | 108.24 | 108.506896628461 | -0.266896628460748 |
| 21 | 109.72 | 108.113465539267 | 1.60653446073319 |
| 22 | 109.53 | 108.616618985072 | 0.91338101492844 |
| 23 | 110.64 | 110.800383369623 | -0.160383369622901 |
| 24 | 110.03 | 110.823456665713 | -0.793456665712766 |
| 25 | 109.38 | 109.462636089023 | -0.0826360890230147 |
| 26 | 110.62 | 111.5033320627 | -0.883332062700039 |
| 27 | 110.57 | 111.257044158977 | -0.68704415897735 |
| 28 | 111.52 | 110.752101248847 | 0.767898751153374 |
| 29 | 111.47 | 110.491619939942 | 0.978380060057787 |
| 30 | 112.97 | 113.302953214414 | -0.332953214413522 |
| 31 | 114.24 | 114.553045331646 | -0.313045331645642 |
| 32 | 114.97 | 115.016944240825 | -0.0469442408254123 |
| 33 | 114.82 | 116.951447869086 | -2.1314478690865 |
| 34 | 114.61 | 115.806050481387 | -1.19605048138658 |
| 35 | 114.68 | 114.753002288706 | -0.0730022887059389 |
| 36 | 114.9 | 115.46228168678 | -0.562281686779621 |
| 37 | 115.05 | 114.854147638772 | 0.195852361228369 |
| 38 | 115.67 | 115.687019590986 | -0.0170195909858736 |
| 39 | 117.17 | 116.197316340107 | 0.972683659893121 |
| 40 | 118.17 | 116.359911971293 | 1.81008802870705 |
| 41 | 118.61 | 118.7459478411 | -0.135947841100022 |
| 42 | 120.38 | 120.512814345172 | -0.132814345171606 |
| 43 | 121.27 | 121.008808281177 | 0.261191718823401 |
| 44 | 121.55 | 120.705077902259 | 0.844922097740817 |
| 45 | 121.08 | 120.901904089445 | 0.178095910555354 |
| 46 | 121.01 | 119.451099182288 | 1.55890081771225 |
| 47 | 121.15 | 119.64017978635 | 1.50982021365017 |
| 48 | 121.84 | 122.112501441164 | -0.272501441163655 |
| 49 | 121.83 | 121.338886376253 | 0.491113623746687 |
| 50 | 121.86 | 120.721110499459 | 1.1388895005405 |
| 51 | 121.56 | 119.938501521447 | 1.621498478553 |
| 52 | 122.81 | 123.037569515936 | -0.227569515935824 |
| 53 | 123.24 | 122.434587031555 | 0.805412968444895 |
| 54 | 124.52 | 123.814258415135 | 0.705741584865156 |
| 55 | 125.03 | 124.691836022836 | 0.338163977163633 |
| 56 | 123.56 | 124.72252622794 | -1.16252622793953 |
| 57 | 122.58 | 124.718947845749 | -2.13894784574863 |
| 58 | 122.95 | 124.47516557072 | -1.52516557072043 |
| 59 | 124.73 | 124.314189970776 | 0.41581002922382 |
| 60 | 125.75 | 126.650367311606 | -0.900367311605812 |
| 61 | 125.16 | 123.923805269058 | 1.23619473094239 |
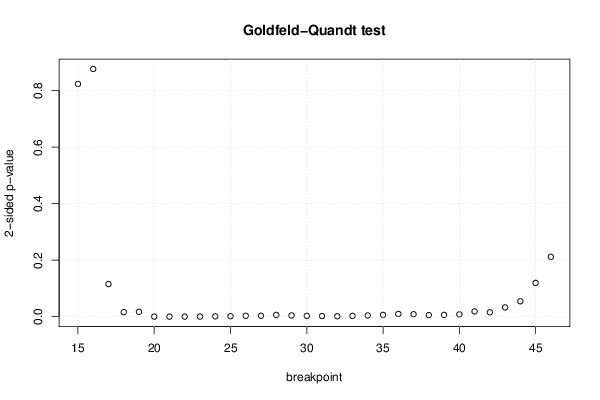
| Goldfeld-Quandt test for Heteroskedasticity | |||
| p-values | Alternative Hypothesis | ||
| breakpoint index | greater | 2-sided | less |
| 15 | 0.411954290484346 | 0.823908580968692 | 0.588045709515654 |
| 16 | 0.438480909080976 | 0.876961818161951 | 0.561519090919024 |
| 17 | 0.94223958632214 | 0.11552082735572 | 0.0577604136778598 |
| 18 | 0.991922356311582 | 0.0161552873768356 | 0.00807764368841781 |
| 19 | 0.991408723838584 | 0.0171825523228319 | 0.00859127616141594 |
| 20 | 0.999802837069831 | 0.000394325860338328 | 0.000197162930169164 |
| 21 | 0.999912472233093 | 0.000175055533814662 | 8.75277669073311e-05 |
| 22 | 0.999851952887851 | 0.000296094224297828 | 0.000148047112148914 |
| 23 | 0.999710164651362 | 0.000579670697275073 | 0.000289835348637537 |
| 24 | 0.999439855331897 | 0.00112028933620608 | 0.000560144668103042 |
| 25 | 0.999160065214558 | 0.00167986957088491 | 0.000839934785442457 |
| 26 | 0.998392138274965 | 0.00321572345007074 | 0.00160786172503537 |
| 27 | 0.998325028025902 | 0.00334994394819616 | 0.00167497197409808 |
| 28 | 0.996854884919245 | 0.00629023016151069 | 0.00314511508075534 |
| 29 | 0.997822430084716 | 0.00435513983056882 | 0.00217756991528441 |
| 30 | 0.998434603134694 | 0.00313079373061128 | 0.00156539686530564 |
| 31 | 0.998861380589547 | 0.00227723882090547 | 0.00113861941045273 |
| 32 | 0.999211211517541 | 0.00157757696491805 | 0.000788788482459027 |
| 33 | 0.998512958042585 | 0.00297408391483075 | 0.00148704195741537 |
| 34 | 0.997858852132172 | 0.00428229573565679 | 0.00214114786782839 |
| 35 | 0.996760658110484 | 0.00647868377903182 | 0.00323934188951591 |
| 36 | 0.99517639694831 | 0.00964720610338097 | 0.00482360305169048 |
| 37 | 0.995585276351346 | 0.00882944729730854 | 0.00441472364865427 |
| 38 | 0.997120059611454 | 0.00575988077709139 | 0.0028799403885457 |
| 39 | 0.996783571260913 | 0.00643285747817385 | 0.00321642873908692 |
| 40 | 0.995841390384951 | 0.00831721923009866 | 0.00415860961504933 |
| 41 | 0.990676772763132 | 0.0186464544737362 | 0.00932322723686812 |
| 42 | 0.992201423692312 | 0.0155971526153759 | 0.00779857630768795 |
| 43 | 0.983530277215796 | 0.0329394455684089 | 0.0164697227842044 |
| 44 | 0.972726296447211 | 0.0545474071055775 | 0.0272737035527887 |
| 45 | 0.940132190467732 | 0.119735619064537 | 0.0598678095322683 |
| 46 | 0.894008968564947 | 0.211982062870106 | 0.105991031435053 |
| Meta Analysis of Goldfeld-Quandt test for Heteroskedasticity | |||
| Description | # significant tests | % significant tests | OK/NOK |
| 1% type I error level | 21 | 0.65625 | NOK |
| 5% type I error level | 26 | 0.8125 | NOK |
| 10% type I error level | 27 | 0.84375 | NOK |