Free Statistics

of Irreproducible Research!

Author's title

Author*The author of this computation has been verified*
R Software Modulerwasp_multipleregression.wasp
Title produced by softwareMultiple Regression
Date of computationFri, 16 Nov 2012 10:49:30 -0500
Cite this page as followsStatistical Computations at FreeStatistics.org, Office for Research Development and Education, URL https://freestatistics.org/blog/index.php?v=date/2012/Nov/16/t1353081194t1fv0072cm2hw3h.htm/, Retrieved Sat, 27 Apr 2024 12:53:23 +0000
Statistical Computations at FreeStatistics.org, Office for Research Development and Education, URL https://freestatistics.org/blog/index.php?pk=189971, Retrieved Sat, 27 Apr 2024 12:53:23 +0000
QR Codes:

Original text written by user:
IsPrivate?No (this computation is public)
User-defined keywords
Estimated Impact90
Family? (F = Feedback message, R = changed R code, M = changed R Module, P = changed Parameters, D = changed Data)
-     [Bivariate Data Series] [Bivariate dataset] [2008-01-05 23:51:08] [74be16979710d4c4e7c6647856088456]
F RMPD  [Mean Plot] [Colombia Coffee] [2008-01-07 13:38:24] [74be16979710d4c4e7c6647856088456]
- RMPD    [Chi-Squared Test, McNemar Test, and Fisher Exact Test] [Happiness - Depre...] [2011-11-14 20:01:00] [f2faabc3a2466a29562900bc59f67898]
- R P       [Chi-Squared Test, McNemar Test, and Fisher Exact Test] [Connected - Separ...] [2011-11-14 20:24:26] [f2faabc3a2466a29562900bc59f67898]
-             [Chi-Squared Test, McNemar Test, and Fisher Exact Test] [] [2012-11-06 14:08:14] [74be16979710d4c4e7c6647856088456]
- RMPD            [Multiple Regression] [WS7] [2012-11-16 15:49:30] [3335f298c0b702cf6bacf0a9219000f9] [Current]
Feedback Forum

Post a new message
Dataseries X:
109.08	119.73	101.52	112.47	104.49	104	109.55	90.14	101.33	109.47	108.81	108.99
110.4	119.77	101.61	114.97	104.62	104.03	111.69	89.96	101.3	109.47	108.81	109.1
111.03	119.77	101.65	115.65	104.76	104.1	110.76	89.97	102.39	109.47	109.74	109.2
112.05	119.78	101.66	117.44	104.88	104.36	110.78	89.98	101.69	109.47	109.57	109.68
112.28	119.78	101.56	120.13	105.09	103.6	110.76	90.1	103.75	109.47	110.44	110.02
112.8	119.78	101.75	122.87	105.31	103.69	112.38	90.13	102.99	109.47	111.2	110.32
114.17	121.28	101.83	123.67	105.48	103.78	112.86	89.6	100.8	109.47	111.44	110.64
114.92	122.44	101.98	125.68	105.71	103.27	114.74	89.6	102.21	109.47	111.83	110.87
114.65	122.72	102.06	127.68	105.87	103.29	116.21	89.61	102.45	109.47	112.87	110.96
115.49	122.75	102.07	128.41	105.94	103.3	116.86	89.22	102.49	109.47	115.07	111.85
114.67	122.8	102.1	127.03	106.14	103.47	114.51	89.6	102.4	109.47	115.35	111.94
114.71	122.81	102.42	128.57	106.49	103.27	114.11	88.9	102.99	109.47	113.81	112.11
115.15	122.83	102.91	127.54	106.79	103.3	112.12	89.6	103.19	111.29	114.66	112.42
115.03	122.83	103.14	126.27	107.02	103.38	108.9	89.47	103.35	111.29	114.51	112.62
115.07	122.83	103.23	125.69	107.14	103.38	106.62	89.73	104.44	111.29	115.11	112.63
116.46	122.84	103.23	125.8	107.31	105.22	105.95	88.53	103.42	111.29	114.54	113.25
116.37	122.85	102.91	124.36	107.67	105.29	107.03	90.09	105.81	111.29	115.39	113.73
116.2	123.61	103.11	121.18	108.03	104.85	107.1	90.09	104.25	111.29	115.65	114.17
116.5	124.74	103.14	121.08	108.27	104.99	108	90.28	103.78	111.29	116.46	114.27
116.38	125.1	103.26	119.98	108.41	104.61	108.24	89.69	104.53	111.29	116.18	114.49
115.44	125.29	103.3	117.58	108.56	104.6	109.72	89.69	105.01	111.29	116.63	114.69
114.96	125.45	103.32	117.29	108.62	103.53	109.53	89.67	104.83	111.29	118.84	114.63
114.48	125.51	103.44	119.02	108.83	103.48	110.64	89.66	104.55	111.29	118.77	114.74
114.3	125.55	103.54	117.76	109	103.54	110.03	89.56	105.16	111.29	117.83	114.94
114.66	125.57	103.98	118.06	109.21	103.52	109.38	89.6	105.06	116.29	117.66	114.78
114.97	125.81	104.24	118.76	109.45	103.5	110.62	86.62	105.2	116.29	117.36	114.83
114.79	127.41	104.29	119.04	109.59	103.5	110.57	86.98	105.87	116.29	118	114.91
116.16	127.75	104.29	120.34	109.57	103.83	111.52	86.71	105.41	116.29	117.34	114.84
116.52	127.76	103.98	120.74	109.75	103.2	111.47	86.6	107.89	116.29	118.04	115.13
117.14	127.8	103.98	122.26	110.01	103.24	112.97	86.58	106.06	116.29	118.17	115.45
117.27	128.23	103.89	123.41	110.09	103.11	114.24	86.79	105.5	116.29	118.82	115.5
117.58	130.01	103.86	124.12	110.25	103.13	114.97	86.08	106.71	116.29	119	115.61
117.21	130.07	103.88	124.29	110.28	103.15	114.82	87.48	106.34	116.29	118.89	116.3
117.08	130.17	103.88	124.02	110.26	103.03	114.61	87.4	106.11	116.29	121.4	116.48
117.06	130.21	104.31	124.35	110.38	103.06	114.68	87.51	106.15	116.29	121.01	116.46
117.55	130.22	104.41	125.56	110.37	103.11	114.9	87.58	106.61	116.29	120.21	116.77
117.61	130.23	104.8	125.99	110.5	103.11	115.05	87.59	106.63	115.72	120.39	117.02
117.74	130.23	104.89	126.35	110.51	103.12	115.67	87.62	106.27	115.72	120.09	117.19
117.87	130.23	104.9	127.53	110.71	103.12	117.17	88.35	105.59	115.72	120.76	117.34
118.59	130.23	104.9	128.42	110.62	103.28	118.17	88.67	107.09	115.72	120.33	118.15
119.09	130.24	104.54	130.11	110.81	103.44	118.61	87.81	108.53	115.72	120.84	118.94
118.93	130.13	104.67	132.15	110.97	103.37	120.38	87.81	108.01	115.72	121.49	119.17
119.62	130.14	104.87	132.91	111.06	103.15	121.27	87.86	106.52	115.72	122.29	119.33
120.09	130.79	105.04	133.84	111.33	103.21	121.55	87.86	107.27	115.72	121.91	119.5
120.38	131.38	105.09	135.52	111.55	103.22	121.08	87.86	107.58	115.72	122.46	119.58
120.49	131.61	105.1	135.29	111.67	103.32	121.01	87.51	107.36	115.72	124.94	119.79
120.02	131.72	105.46	135.13	111.72	103.34	121.15	87.5	107.23	115.72	124.6	119.91
120.17	131.89	105.83	136.43	112	103.34	121.84	86.72	107.54	115.72	123.09	120.35
120.58	131.89	106.27	136.29	112.42	103.3	121.83	86.74	107.64	119.24	123.25	120.69
121.54	131.96	106.46	137.32	112.84	103.29	121.86	86.74	108.23	119.24	123.01	121.01
121.52	131.99	106.52	137.3	112.99	103.35	121.56	86.76	108.42	119.24	123.82	121.14
121.81	132	106.53	138.38	113.11	104.02	122.81	90.75	109.33	119.24	123.31	123.78
122.85	132.06	105.96	139.39	113.51	104.07	123.24	90.21	111.3	119.24	124.04	123.95
122.97	132.11	106	140.03	113.42	104.23	124.52	90.2	110.52	119.24	124.15	124.25
122.96	132.88	106.15	140.05	113.6	103.96	125.03	89.34	109.86	119.24	125.37	124.3
123.4	135.48	106.32	139.47	113.65	103.81	123.56	89.35	110.94	119.24	125.41	124.7
123.23	136.56	106.41	138.31	113.76	103.38	122.58	88.94	111.35	119.24	126.06	124.73
123.24	136.96	106.41	138.5	113.74	103.29	122.95	88.94	111.01	119.24	128.17	125.02
123.72	137.4	106.81	139.31	114.02	103.24	124.73	88.77	110.84	119.24	128.16	125.24
123.99	138.32	106.99	139.66	114.08	103.26	125.75	88.72	110.79	119.24	126.69	125.67
125.1	138.82	107.35	139.63	114.29	103.4	125.16	89.25	110.87	119.79	126.75	125.84


Summary of computational transaction
Raw Inputview raw input (R code)
Raw Outputview raw output of R engine
Computing time8 seconds
R Server'Sir Ronald Aylmer Fisher' @ fisher.wessa.net

\begin{tabular}{lllllllll}
\hline
Summary of computational transaction \tabularnewline
Raw Input & view raw input (R code)  \tabularnewline
Raw Output & view raw output of R engine  \tabularnewline
Computing time & 8 seconds \tabularnewline
R Server & 'Sir Ronald Aylmer Fisher' @ fisher.wessa.net \tabularnewline
\hline
\end{tabular}
%Source: https://freestatistics.org/blog/index.php?pk=189971&T=0

[TABLE]
[ROW][C]Summary of computational transaction[/C][/ROW]
[ROW][C]Raw Input[/C][C]view raw input (R code) [/C][/ROW]
[ROW][C]Raw Output[/C][C]view raw output of R engine [/C][/ROW]
[ROW][C]Computing time[/C][C]8 seconds[/C][/ROW]
[ROW][C]R Server[/C][C]'Sir Ronald Aylmer Fisher' @ fisher.wessa.net[/C][/ROW]
[/TABLE]
Source: https://freestatistics.org/blog/index.php?pk=189971&T=0

Globally Unique Identifier (entire table): ba.freestatistics.org/blog/index.php?pk=189971&T=0

As an alternative you can also use a QR Code:  

The GUIDs for individual cells are displayed in the table below:

Summary of computational transaction
Raw Inputview raw input (R code)
Raw Outputview raw output of R engine
Computing time8 seconds
R Server'Sir Ronald Aylmer Fisher' @ fisher.wessa.net


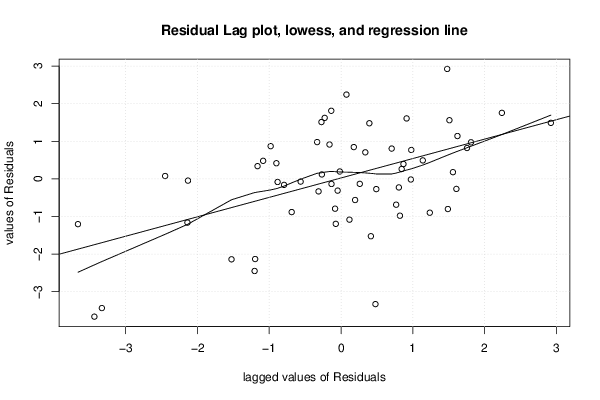
Multiple Linear Regression - Estimated Regression Equation
Vervoer[t] = + 571.904681422643 -1.40459287981778VoedingsmiddelenEnDranken[t] + 0.484331344917395Tabak[t] -3.36887528975686KledingEnSchoeisel[t] + 0.597116854081499`Huisvesting,water,elektriciteit,gas`[t] + 0.367282982725115StofferingEnOnderhoudVanWoning[t] -1.80583285610949Gezondheidsuitgaven[t] -0.812407529113463Communicatie[t] -1.03263668282893RecreatieEnCultuur[t] + 0.114569379912798Onderwijs[t] -0.899373119097168`Hotels,caf\303\251sEnRestaurants`[t] + 2.94648422505312DiverseGoederenEnDiensten[t] + e[t]

\begin{tabular}{lllllllll}
\hline
Multiple Linear Regression - Estimated Regression Equation \tabularnewline
Vervoer[t] =  +  571.904681422643 -1.40459287981778VoedingsmiddelenEnDranken[t] +  0.484331344917395Tabak[t] -3.36887528975686KledingEnSchoeisel[t] +  0.597116854081499`Huisvesting,water,elektriciteit,gas`[t] +  0.367282982725115StofferingEnOnderhoudVanWoning[t] -1.80583285610949Gezondheidsuitgaven[t] -0.812407529113463Communicatie[t] -1.03263668282893RecreatieEnCultuur[t] +  0.114569379912798Onderwijs[t] -0.899373119097168`Hotels,caf\303\251sEnRestaurants`[t] +  2.94648422505312DiverseGoederenEnDiensten[t]  + e[t] \tabularnewline
\hline
\end{tabular}
%Source: https://freestatistics.org/blog/index.php?pk=189971&T=1

[TABLE]
[ROW][C]Multiple Linear Regression - Estimated Regression Equation[/C][/ROW]
[ROW][C]Vervoer[t] =  +  571.904681422643 -1.40459287981778VoedingsmiddelenEnDranken[t] +  0.484331344917395Tabak[t] -3.36887528975686KledingEnSchoeisel[t] +  0.597116854081499`Huisvesting,water,elektriciteit,gas`[t] +  0.367282982725115StofferingEnOnderhoudVanWoning[t] -1.80583285610949Gezondheidsuitgaven[t] -0.812407529113463Communicatie[t] -1.03263668282893RecreatieEnCultuur[t] +  0.114569379912798Onderwijs[t] -0.899373119097168`Hotels,caf\303\251sEnRestaurants`[t] +  2.94648422505312DiverseGoederenEnDiensten[t]  + e[t][/C][/ROW]
[/TABLE]
Source: https://freestatistics.org/blog/index.php?pk=189971&T=1

Globally Unique Identifier (entire table): ba.freestatistics.org/blog/index.php?pk=189971&T=1

As an alternative you can also use a QR Code:  

The GUIDs for individual cells are displayed in the table below:

Multiple Linear Regression - Estimated Regression Equation
Vervoer[t] = + 571.904681422643 -1.40459287981778VoedingsmiddelenEnDranken[t] + 0.484331344917395Tabak[t] -3.36887528975686KledingEnSchoeisel[t] + 0.597116854081499`Huisvesting,water,elektriciteit,gas`[t] + 0.367282982725115StofferingEnOnderhoudVanWoning[t] -1.80583285610949Gezondheidsuitgaven[t] -0.812407529113463Communicatie[t] -1.03263668282893RecreatieEnCultuur[t] + 0.114569379912798Onderwijs[t] -0.899373119097168`Hotels,caf\303\251sEnRestaurants`[t] + 2.94648422505312DiverseGoederenEnDiensten[t] + e[t]


Multiple Linear Regression - Ordinary Least Squares
VariableParameterS.D.T-STATH0: parameter = 02-tail p-value1-tail p-value
(Intercept)571.904681422643107.0646865.34172e-061e-06
VoedingsmiddelenEnDranken-1.404592879817780.449075-3.12770.0029630.001481
Tabak0.4843313449173950.2853631.69720.0959940.047997
KledingEnSchoeisel-3.368875289756860.784846-4.29248.3e-054.2e-05
`Huisvesting,water,elektriciteit,gas`0.5971168540814990.1360694.38836.1e-053e-05
StofferingEnOnderhoudVanWoning0.3672829827251151.0278220.35730.7223710.361186
Gezondheidsuitgaven-1.805832856109490.710747-2.54080.0142790.00714
Communicatie-0.8124075291134630.363962-2.23210.0302110.015106
RecreatieEnCultuur-1.032636682828930.317068-3.25680.0020480.001024
Onderwijs0.1145693799127980.2544050.45030.654450.327225
`Hotels,caf\303\251sEnRestaurants`-0.8993731190971680.265902-3.38230.001420.00071
DiverseGoederenEnDiensten2.946484225053120.6341574.64632.6e-051.3e-05

\begin{tabular}{lllllllll}
\hline
Multiple Linear Regression - Ordinary Least Squares \tabularnewline
Variable & Parameter & S.D. & T-STATH0: parameter = 0 & 2-tail p-value & 1-tail p-value \tabularnewline
(Intercept) & 571.904681422643 & 107.064686 & 5.3417 & 2e-06 & 1e-06 \tabularnewline
VoedingsmiddelenEnDranken & -1.40459287981778 & 0.449075 & -3.1277 & 0.002963 & 0.001481 \tabularnewline
Tabak & 0.484331344917395 & 0.285363 & 1.6972 & 0.095994 & 0.047997 \tabularnewline
KledingEnSchoeisel & -3.36887528975686 & 0.784846 & -4.2924 & 8.3e-05 & 4.2e-05 \tabularnewline
`Huisvesting,water,elektriciteit,gas` & 0.597116854081499 & 0.136069 & 4.3883 & 6.1e-05 & 3e-05 \tabularnewline
StofferingEnOnderhoudVanWoning & 0.367282982725115 & 1.027822 & 0.3573 & 0.722371 & 0.361186 \tabularnewline
Gezondheidsuitgaven & -1.80583285610949 & 0.710747 & -2.5408 & 0.014279 & 0.00714 \tabularnewline
Communicatie & -0.812407529113463 & 0.363962 & -2.2321 & 0.030211 & 0.015106 \tabularnewline
RecreatieEnCultuur & -1.03263668282893 & 0.317068 & -3.2568 & 0.002048 & 0.001024 \tabularnewline
Onderwijs & 0.114569379912798 & 0.254405 & 0.4503 & 0.65445 & 0.327225 \tabularnewline
`Hotels,caf\303\251sEnRestaurants` & -0.899373119097168 & 0.265902 & -3.3823 & 0.00142 & 0.00071 \tabularnewline
DiverseGoederenEnDiensten & 2.94648422505312 & 0.634157 & 4.6463 & 2.6e-05 & 1.3e-05 \tabularnewline
\hline
\end{tabular}
%Source: https://freestatistics.org/blog/index.php?pk=189971&T=2

[TABLE]
[ROW][C]Multiple Linear Regression - Ordinary Least Squares[/C][/ROW]
[ROW][C]Variable[/C][C]Parameter[/C][C]S.D.[/C][C]T-STATH0: parameter = 0[/C][C]2-tail p-value[/C][C]1-tail p-value[/C][/ROW]
[ROW][C](Intercept)[/C][C]571.904681422643[/C][C]107.064686[/C][C]5.3417[/C][C]2e-06[/C][C]1e-06[/C][/ROW]
[ROW][C]VoedingsmiddelenEnDranken[/C][C]-1.40459287981778[/C][C]0.449075[/C][C]-3.1277[/C][C]0.002963[/C][C]0.001481[/C][/ROW]
[ROW][C]Tabak[/C][C]0.484331344917395[/C][C]0.285363[/C][C]1.6972[/C][C]0.095994[/C][C]0.047997[/C][/ROW]
[ROW][C]KledingEnSchoeisel[/C][C]-3.36887528975686[/C][C]0.784846[/C][C]-4.2924[/C][C]8.3e-05[/C][C]4.2e-05[/C][/ROW]
[ROW][C]`Huisvesting,water,elektriciteit,gas`[/C][C]0.597116854081499[/C][C]0.136069[/C][C]4.3883[/C][C]6.1e-05[/C][C]3e-05[/C][/ROW]
[ROW][C]StofferingEnOnderhoudVanWoning[/C][C]0.367282982725115[/C][C]1.027822[/C][C]0.3573[/C][C]0.722371[/C][C]0.361186[/C][/ROW]
[ROW][C]Gezondheidsuitgaven[/C][C]-1.80583285610949[/C][C]0.710747[/C][C]-2.5408[/C][C]0.014279[/C][C]0.00714[/C][/ROW]
[ROW][C]Communicatie[/C][C]-0.812407529113463[/C][C]0.363962[/C][C]-2.2321[/C][C]0.030211[/C][C]0.015106[/C][/ROW]
[ROW][C]RecreatieEnCultuur[/C][C]-1.03263668282893[/C][C]0.317068[/C][C]-3.2568[/C][C]0.002048[/C][C]0.001024[/C][/ROW]
[ROW][C]Onderwijs[/C][C]0.114569379912798[/C][C]0.254405[/C][C]0.4503[/C][C]0.65445[/C][C]0.327225[/C][/ROW]
[ROW][C]`Hotels,caf\303\251sEnRestaurants`[/C][C]-0.899373119097168[/C][C]0.265902[/C][C]-3.3823[/C][C]0.00142[/C][C]0.00071[/C][/ROW]
[ROW][C]DiverseGoederenEnDiensten[/C][C]2.94648422505312[/C][C]0.634157[/C][C]4.6463[/C][C]2.6e-05[/C][C]1.3e-05[/C][/ROW]
[/TABLE]
Source: https://freestatistics.org/blog/index.php?pk=189971&T=2

Globally Unique Identifier (entire table): ba.freestatistics.org/blog/index.php?pk=189971&T=2

As an alternative you can also use a QR Code:  

The GUIDs for individual cells are displayed in the table below:

Multiple Linear Regression - Ordinary Least Squares
VariableParameterS.D.T-STATH0: parameter = 02-tail p-value1-tail p-value
(Intercept)571.904681422643107.0646865.34172e-061e-06
VoedingsmiddelenEnDranken-1.404592879817780.449075-3.12770.0029630.001481
Tabak0.4843313449173950.2853631.69720.0959940.047997
KledingEnSchoeisel-3.368875289756860.784846-4.29248.3e-054.2e-05
`Huisvesting,water,elektriciteit,gas`0.5971168540814990.1360694.38836.1e-053e-05
StofferingEnOnderhoudVanWoning0.3672829827251151.0278220.35730.7223710.361186
Gezondheidsuitgaven-1.805832856109490.710747-2.54080.0142790.00714
Communicatie-0.8124075291134630.363962-2.23210.0302110.015106
RecreatieEnCultuur-1.032636682828930.317068-3.25680.0020480.001024
Onderwijs0.1145693799127980.2544050.45030.654450.327225
`Hotels,caf\303\251sEnRestaurants`-0.8993731190971680.265902-3.38230.001420.00071
DiverseGoederenEnDiensten2.946484225053120.6341574.64632.6e-051.3e-05


Multiple Linear Regression - Regression Statistics
Multiple R0.971939109628318
R-squared0.944665632825087
Adjusted R-squared0.932243632030719
F-TEST (value)76.0477839651538
F-TEST (DF numerator)11
F-TEST (DF denominator)49
p-value0
Multiple Linear Regression - Residual Statistics
Residual Standard Deviation1.49156339063183
Sum Squared Residuals109.013306065383

\begin{tabular}{lllllllll}
\hline
Multiple Linear Regression - Regression Statistics \tabularnewline
Multiple R & 0.971939109628318 \tabularnewline
R-squared & 0.944665632825087 \tabularnewline
Adjusted R-squared & 0.932243632030719 \tabularnewline
F-TEST (value) & 76.0477839651538 \tabularnewline
F-TEST (DF numerator) & 11 \tabularnewline
F-TEST (DF denominator) & 49 \tabularnewline
p-value & 0 \tabularnewline
Multiple Linear Regression - Residual Statistics \tabularnewline
Residual Standard Deviation & 1.49156339063183 \tabularnewline
Sum Squared Residuals & 109.013306065383 \tabularnewline
\hline
\end{tabular}
%Source: https://freestatistics.org/blog/index.php?pk=189971&T=3

[TABLE]
[ROW][C]Multiple Linear Regression - Regression Statistics[/C][/ROW]
[ROW][C]Multiple R[/C][C]0.971939109628318[/C][/ROW]
[ROW][C]R-squared[/C][C]0.944665632825087[/C][/ROW]
[ROW][C]Adjusted R-squared[/C][C]0.932243632030719[/C][/ROW]
[ROW][C]F-TEST (value)[/C][C]76.0477839651538[/C][/ROW]
[ROW][C]F-TEST (DF numerator)[/C][C]11[/C][/ROW]
[ROW][C]F-TEST (DF denominator)[/C][C]49[/C][/ROW]
[ROW][C]p-value[/C][C]0[/C][/ROW]
[ROW][C]Multiple Linear Regression - Residual Statistics[/C][/ROW]
[ROW][C]Residual Standard Deviation[/C][C]1.49156339063183[/C][/ROW]
[ROW][C]Sum Squared Residuals[/C][C]109.013306065383[/C][/ROW]
[/TABLE]
Source: https://freestatistics.org/blog/index.php?pk=189971&T=3

Globally Unique Identifier (entire table): ba.freestatistics.org/blog/index.php?pk=189971&T=3

As an alternative you can also use a QR Code:  

The GUIDs for individual cells are displayed in the table below:

Multiple Linear Regression - Regression Statistics
Multiple R0.971939109628318
R-squared0.944665632825087
Adjusted R-squared0.932243632030719
F-TEST (value)76.0477839651538
F-TEST (DF numerator)11
F-TEST (DF denominator)49
p-value0
Multiple Linear Regression - Residual Statistics
Residual Standard Deviation1.49156339063183
Sum Squared Residuals109.013306065383


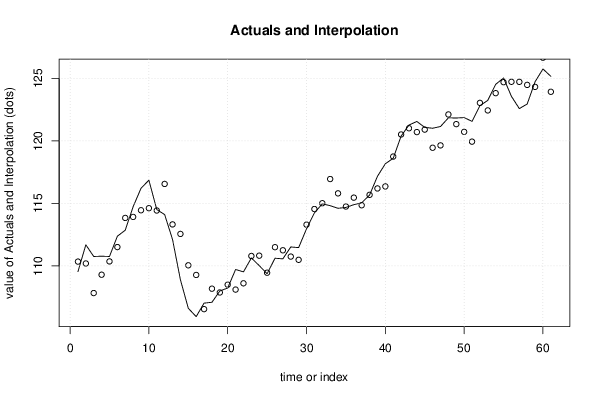
Multiple Linear Regression - Actuals, Interpolation, and Residuals
Time or IndexActualsInterpolationForecastResidualsPrediction Error
1109.55110.351923884357-0.801923884357248
2111.69110.2017254184731.4882745815275
3110.76107.8376610331972.9223389668034
4110.78109.301454901441.47854509856033
5110.76110.3657223553340.394277644665746
6112.38111.5104785821870.869521417813132
7112.86113.83985569357-0.979855693569853
8114.74113.9194769522190.820523047780867
9116.21114.4555807686671.75441923133334
10116.86114.6193942881042.24060571189649
11114.51114.434336057780.0756639422197657
12114.11116.559597682955-2.44959768295472
13112.12113.323740723213-1.20374072321267
14108.9112.563714527409-3.66371452740855
15106.62110.055119247637-3.43511924763663
16105.95109.28060831275-3.33060831274986
17107.03106.5503582414960.479641758504378
18107.1108.184941803012-1.0849418030118
19108107.8825497371560.117450262844414
20108.24108.506896628461-0.266896628460748
21109.72108.1134655392671.60653446073319
22109.53108.6166189850720.91338101492844
23110.64110.800383369623-0.160383369622901
24110.03110.823456665713-0.793456665712766
25109.38109.462636089023-0.0826360890230147
26110.62111.5033320627-0.883332062700039
27110.57111.257044158977-0.68704415897735
28111.52110.7521012488470.767898751153374
29111.47110.4916199399420.978380060057787
30112.97113.302953214414-0.332953214413522
31114.24114.553045331646-0.313045331645642
32114.97115.016944240825-0.0469442408254123
33114.82116.951447869086-2.1314478690865
34114.61115.806050481387-1.19605048138658
35114.68114.753002288706-0.0730022887059389
36114.9115.46228168678-0.562281686779621
37115.05114.8541476387720.195852361228369
38115.67115.687019590986-0.0170195909858736
39117.17116.1973163401070.972683659893121
40118.17116.3599119712931.81008802870705
41118.61118.7459478411-0.135947841100022
42120.38120.512814345172-0.132814345171606
43121.27121.0088082811770.261191718823401
44121.55120.7050779022590.844922097740817
45121.08120.9019040894450.178095910555354
46121.01119.4510991822881.55890081771225
47121.15119.640179786351.50982021365017
48121.84122.112501441164-0.272501441163655
49121.83121.3388863762530.491113623746687
50121.86120.7211104994591.1388895005405
51121.56119.9385015214471.621498478553
52122.81123.037569515936-0.227569515935824
53123.24122.4345870315550.805412968444895
54124.52123.8142584151350.705741584865156
55125.03124.6918360228360.338163977163633
56123.56124.72252622794-1.16252622793953
57122.58124.718947845749-2.13894784574863
58122.95124.47516557072-1.52516557072043
59124.73124.3141899707760.41581002922382
60125.75126.650367311606-0.900367311605812
61125.16123.9238052690581.23619473094239

\begin{tabular}{lllllllll}
\hline
Multiple Linear Regression - Actuals, Interpolation, and Residuals \tabularnewline
Time or Index & Actuals & InterpolationForecast & ResidualsPrediction Error \tabularnewline
1 & 109.55 & 110.351923884357 & -0.801923884357248 \tabularnewline
2 & 111.69 & 110.201725418473 & 1.4882745815275 \tabularnewline
3 & 110.76 & 107.837661033197 & 2.9223389668034 \tabularnewline
4 & 110.78 & 109.30145490144 & 1.47854509856033 \tabularnewline
5 & 110.76 & 110.365722355334 & 0.394277644665746 \tabularnewline
6 & 112.38 & 111.510478582187 & 0.869521417813132 \tabularnewline
7 & 112.86 & 113.83985569357 & -0.979855693569853 \tabularnewline
8 & 114.74 & 113.919476952219 & 0.820523047780867 \tabularnewline
9 & 116.21 & 114.455580768667 & 1.75441923133334 \tabularnewline
10 & 116.86 & 114.619394288104 & 2.24060571189649 \tabularnewline
11 & 114.51 & 114.43433605778 & 0.0756639422197657 \tabularnewline
12 & 114.11 & 116.559597682955 & -2.44959768295472 \tabularnewline
13 & 112.12 & 113.323740723213 & -1.20374072321267 \tabularnewline
14 & 108.9 & 112.563714527409 & -3.66371452740855 \tabularnewline
15 & 106.62 & 110.055119247637 & -3.43511924763663 \tabularnewline
16 & 105.95 & 109.28060831275 & -3.33060831274986 \tabularnewline
17 & 107.03 & 106.550358241496 & 0.479641758504378 \tabularnewline
18 & 107.1 & 108.184941803012 & -1.0849418030118 \tabularnewline
19 & 108 & 107.882549737156 & 0.117450262844414 \tabularnewline
20 & 108.24 & 108.506896628461 & -0.266896628460748 \tabularnewline
21 & 109.72 & 108.113465539267 & 1.60653446073319 \tabularnewline
22 & 109.53 & 108.616618985072 & 0.91338101492844 \tabularnewline
23 & 110.64 & 110.800383369623 & -0.160383369622901 \tabularnewline
24 & 110.03 & 110.823456665713 & -0.793456665712766 \tabularnewline
25 & 109.38 & 109.462636089023 & -0.0826360890230147 \tabularnewline
26 & 110.62 & 111.5033320627 & -0.883332062700039 \tabularnewline
27 & 110.57 & 111.257044158977 & -0.68704415897735 \tabularnewline
28 & 111.52 & 110.752101248847 & 0.767898751153374 \tabularnewline
29 & 111.47 & 110.491619939942 & 0.978380060057787 \tabularnewline
30 & 112.97 & 113.302953214414 & -0.332953214413522 \tabularnewline
31 & 114.24 & 114.553045331646 & -0.313045331645642 \tabularnewline
32 & 114.97 & 115.016944240825 & -0.0469442408254123 \tabularnewline
33 & 114.82 & 116.951447869086 & -2.1314478690865 \tabularnewline
34 & 114.61 & 115.806050481387 & -1.19605048138658 \tabularnewline
35 & 114.68 & 114.753002288706 & -0.0730022887059389 \tabularnewline
36 & 114.9 & 115.46228168678 & -0.562281686779621 \tabularnewline
37 & 115.05 & 114.854147638772 & 0.195852361228369 \tabularnewline
38 & 115.67 & 115.687019590986 & -0.0170195909858736 \tabularnewline
39 & 117.17 & 116.197316340107 & 0.972683659893121 \tabularnewline
40 & 118.17 & 116.359911971293 & 1.81008802870705 \tabularnewline
41 & 118.61 & 118.7459478411 & -0.135947841100022 \tabularnewline
42 & 120.38 & 120.512814345172 & -0.132814345171606 \tabularnewline
43 & 121.27 & 121.008808281177 & 0.261191718823401 \tabularnewline
44 & 121.55 & 120.705077902259 & 0.844922097740817 \tabularnewline
45 & 121.08 & 120.901904089445 & 0.178095910555354 \tabularnewline
46 & 121.01 & 119.451099182288 & 1.55890081771225 \tabularnewline
47 & 121.15 & 119.64017978635 & 1.50982021365017 \tabularnewline
48 & 121.84 & 122.112501441164 & -0.272501441163655 \tabularnewline
49 & 121.83 & 121.338886376253 & 0.491113623746687 \tabularnewline
50 & 121.86 & 120.721110499459 & 1.1388895005405 \tabularnewline
51 & 121.56 & 119.938501521447 & 1.621498478553 \tabularnewline
52 & 122.81 & 123.037569515936 & -0.227569515935824 \tabularnewline
53 & 123.24 & 122.434587031555 & 0.805412968444895 \tabularnewline
54 & 124.52 & 123.814258415135 & 0.705741584865156 \tabularnewline
55 & 125.03 & 124.691836022836 & 0.338163977163633 \tabularnewline
56 & 123.56 & 124.72252622794 & -1.16252622793953 \tabularnewline
57 & 122.58 & 124.718947845749 & -2.13894784574863 \tabularnewline
58 & 122.95 & 124.47516557072 & -1.52516557072043 \tabularnewline
59 & 124.73 & 124.314189970776 & 0.41581002922382 \tabularnewline
60 & 125.75 & 126.650367311606 & -0.900367311605812 \tabularnewline
61 & 125.16 & 123.923805269058 & 1.23619473094239 \tabularnewline
\hline
\end{tabular}
%Source: https://freestatistics.org/blog/index.php?pk=189971&T=4

[TABLE]
[ROW][C]Multiple Linear Regression - Actuals, Interpolation, and Residuals[/C][/ROW]
[ROW][C]Time or Index[/C][C]Actuals[/C][C]InterpolationForecast[/C][C]ResidualsPrediction Error[/C][/ROW]
[ROW][C]1[/C][C]109.55[/C][C]110.351923884357[/C][C]-0.801923884357248[/C][/ROW]
[ROW][C]2[/C][C]111.69[/C][C]110.201725418473[/C][C]1.4882745815275[/C][/ROW]
[ROW][C]3[/C][C]110.76[/C][C]107.837661033197[/C][C]2.9223389668034[/C][/ROW]
[ROW][C]4[/C][C]110.78[/C][C]109.30145490144[/C][C]1.47854509856033[/C][/ROW]
[ROW][C]5[/C][C]110.76[/C][C]110.365722355334[/C][C]0.394277644665746[/C][/ROW]
[ROW][C]6[/C][C]112.38[/C][C]111.510478582187[/C][C]0.869521417813132[/C][/ROW]
[ROW][C]7[/C][C]112.86[/C][C]113.83985569357[/C][C]-0.979855693569853[/C][/ROW]
[ROW][C]8[/C][C]114.74[/C][C]113.919476952219[/C][C]0.820523047780867[/C][/ROW]
[ROW][C]9[/C][C]116.21[/C][C]114.455580768667[/C][C]1.75441923133334[/C][/ROW]
[ROW][C]10[/C][C]116.86[/C][C]114.619394288104[/C][C]2.24060571189649[/C][/ROW]
[ROW][C]11[/C][C]114.51[/C][C]114.43433605778[/C][C]0.0756639422197657[/C][/ROW]
[ROW][C]12[/C][C]114.11[/C][C]116.559597682955[/C][C]-2.44959768295472[/C][/ROW]
[ROW][C]13[/C][C]112.12[/C][C]113.323740723213[/C][C]-1.20374072321267[/C][/ROW]
[ROW][C]14[/C][C]108.9[/C][C]112.563714527409[/C][C]-3.66371452740855[/C][/ROW]
[ROW][C]15[/C][C]106.62[/C][C]110.055119247637[/C][C]-3.43511924763663[/C][/ROW]
[ROW][C]16[/C][C]105.95[/C][C]109.28060831275[/C][C]-3.33060831274986[/C][/ROW]
[ROW][C]17[/C][C]107.03[/C][C]106.550358241496[/C][C]0.479641758504378[/C][/ROW]
[ROW][C]18[/C][C]107.1[/C][C]108.184941803012[/C][C]-1.0849418030118[/C][/ROW]
[ROW][C]19[/C][C]108[/C][C]107.882549737156[/C][C]0.117450262844414[/C][/ROW]
[ROW][C]20[/C][C]108.24[/C][C]108.506896628461[/C][C]-0.266896628460748[/C][/ROW]
[ROW][C]21[/C][C]109.72[/C][C]108.113465539267[/C][C]1.60653446073319[/C][/ROW]
[ROW][C]22[/C][C]109.53[/C][C]108.616618985072[/C][C]0.91338101492844[/C][/ROW]
[ROW][C]23[/C][C]110.64[/C][C]110.800383369623[/C][C]-0.160383369622901[/C][/ROW]
[ROW][C]24[/C][C]110.03[/C][C]110.823456665713[/C][C]-0.793456665712766[/C][/ROW]
[ROW][C]25[/C][C]109.38[/C][C]109.462636089023[/C][C]-0.0826360890230147[/C][/ROW]
[ROW][C]26[/C][C]110.62[/C][C]111.5033320627[/C][C]-0.883332062700039[/C][/ROW]
[ROW][C]27[/C][C]110.57[/C][C]111.257044158977[/C][C]-0.68704415897735[/C][/ROW]
[ROW][C]28[/C][C]111.52[/C][C]110.752101248847[/C][C]0.767898751153374[/C][/ROW]
[ROW][C]29[/C][C]111.47[/C][C]110.491619939942[/C][C]0.978380060057787[/C][/ROW]
[ROW][C]30[/C][C]112.97[/C][C]113.302953214414[/C][C]-0.332953214413522[/C][/ROW]
[ROW][C]31[/C][C]114.24[/C][C]114.553045331646[/C][C]-0.313045331645642[/C][/ROW]
[ROW][C]32[/C][C]114.97[/C][C]115.016944240825[/C][C]-0.0469442408254123[/C][/ROW]
[ROW][C]33[/C][C]114.82[/C][C]116.951447869086[/C][C]-2.1314478690865[/C][/ROW]
[ROW][C]34[/C][C]114.61[/C][C]115.806050481387[/C][C]-1.19605048138658[/C][/ROW]
[ROW][C]35[/C][C]114.68[/C][C]114.753002288706[/C][C]-0.0730022887059389[/C][/ROW]
[ROW][C]36[/C][C]114.9[/C][C]115.46228168678[/C][C]-0.562281686779621[/C][/ROW]
[ROW][C]37[/C][C]115.05[/C][C]114.854147638772[/C][C]0.195852361228369[/C][/ROW]
[ROW][C]38[/C][C]115.67[/C][C]115.687019590986[/C][C]-0.0170195909858736[/C][/ROW]
[ROW][C]39[/C][C]117.17[/C][C]116.197316340107[/C][C]0.972683659893121[/C][/ROW]
[ROW][C]40[/C][C]118.17[/C][C]116.359911971293[/C][C]1.81008802870705[/C][/ROW]
[ROW][C]41[/C][C]118.61[/C][C]118.7459478411[/C][C]-0.135947841100022[/C][/ROW]
[ROW][C]42[/C][C]120.38[/C][C]120.512814345172[/C][C]-0.132814345171606[/C][/ROW]
[ROW][C]43[/C][C]121.27[/C][C]121.008808281177[/C][C]0.261191718823401[/C][/ROW]
[ROW][C]44[/C][C]121.55[/C][C]120.705077902259[/C][C]0.844922097740817[/C][/ROW]
[ROW][C]45[/C][C]121.08[/C][C]120.901904089445[/C][C]0.178095910555354[/C][/ROW]
[ROW][C]46[/C][C]121.01[/C][C]119.451099182288[/C][C]1.55890081771225[/C][/ROW]
[ROW][C]47[/C][C]121.15[/C][C]119.64017978635[/C][C]1.50982021365017[/C][/ROW]
[ROW][C]48[/C][C]121.84[/C][C]122.112501441164[/C][C]-0.272501441163655[/C][/ROW]
[ROW][C]49[/C][C]121.83[/C][C]121.338886376253[/C][C]0.491113623746687[/C][/ROW]
[ROW][C]50[/C][C]121.86[/C][C]120.721110499459[/C][C]1.1388895005405[/C][/ROW]
[ROW][C]51[/C][C]121.56[/C][C]119.938501521447[/C][C]1.621498478553[/C][/ROW]
[ROW][C]52[/C][C]122.81[/C][C]123.037569515936[/C][C]-0.227569515935824[/C][/ROW]
[ROW][C]53[/C][C]123.24[/C][C]122.434587031555[/C][C]0.805412968444895[/C][/ROW]
[ROW][C]54[/C][C]124.52[/C][C]123.814258415135[/C][C]0.705741584865156[/C][/ROW]
[ROW][C]55[/C][C]125.03[/C][C]124.691836022836[/C][C]0.338163977163633[/C][/ROW]
[ROW][C]56[/C][C]123.56[/C][C]124.72252622794[/C][C]-1.16252622793953[/C][/ROW]
[ROW][C]57[/C][C]122.58[/C][C]124.718947845749[/C][C]-2.13894784574863[/C][/ROW]
[ROW][C]58[/C][C]122.95[/C][C]124.47516557072[/C][C]-1.52516557072043[/C][/ROW]
[ROW][C]59[/C][C]124.73[/C][C]124.314189970776[/C][C]0.41581002922382[/C][/ROW]
[ROW][C]60[/C][C]125.75[/C][C]126.650367311606[/C][C]-0.900367311605812[/C][/ROW]
[ROW][C]61[/C][C]125.16[/C][C]123.923805269058[/C][C]1.23619473094239[/C][/ROW]
[/TABLE]
Source: https://freestatistics.org/blog/index.php?pk=189971&T=4

Globally Unique Identifier (entire table): ba.freestatistics.org/blog/index.php?pk=189971&T=4

As an alternative you can also use a QR Code:  

The GUIDs for individual cells are displayed in the table below:

Multiple Linear Regression - Actuals, Interpolation, and Residuals
Time or IndexActualsInterpolationForecastResidualsPrediction Error
1109.55110.351923884357-0.801923884357248
2111.69110.2017254184731.4882745815275
3110.76107.8376610331972.9223389668034
4110.78109.301454901441.47854509856033
5110.76110.3657223553340.394277644665746
6112.38111.5104785821870.869521417813132
7112.86113.83985569357-0.979855693569853
8114.74113.9194769522190.820523047780867
9116.21114.4555807686671.75441923133334
10116.86114.6193942881042.24060571189649
11114.51114.434336057780.0756639422197657
12114.11116.559597682955-2.44959768295472
13112.12113.323740723213-1.20374072321267
14108.9112.563714527409-3.66371452740855
15106.62110.055119247637-3.43511924763663
16105.95109.28060831275-3.33060831274986
17107.03106.5503582414960.479641758504378
18107.1108.184941803012-1.0849418030118
19108107.8825497371560.117450262844414
20108.24108.506896628461-0.266896628460748
21109.72108.1134655392671.60653446073319
22109.53108.6166189850720.91338101492844
23110.64110.800383369623-0.160383369622901
24110.03110.823456665713-0.793456665712766
25109.38109.462636089023-0.0826360890230147
26110.62111.5033320627-0.883332062700039
27110.57111.257044158977-0.68704415897735
28111.52110.7521012488470.767898751153374
29111.47110.4916199399420.978380060057787
30112.97113.302953214414-0.332953214413522
31114.24114.553045331646-0.313045331645642
32114.97115.016944240825-0.0469442408254123
33114.82116.951447869086-2.1314478690865
34114.61115.806050481387-1.19605048138658
35114.68114.753002288706-0.0730022887059389
36114.9115.46228168678-0.562281686779621
37115.05114.8541476387720.195852361228369
38115.67115.687019590986-0.0170195909858736
39117.17116.1973163401070.972683659893121
40118.17116.3599119712931.81008802870705
41118.61118.7459478411-0.135947841100022
42120.38120.512814345172-0.132814345171606
43121.27121.0088082811770.261191718823401
44121.55120.7050779022590.844922097740817
45121.08120.9019040894450.178095910555354
46121.01119.4510991822881.55890081771225
47121.15119.640179786351.50982021365017
48121.84122.112501441164-0.272501441163655
49121.83121.3388863762530.491113623746687
50121.86120.7211104994591.1388895005405
51121.56119.9385015214471.621498478553
52122.81123.037569515936-0.227569515935824
53123.24122.4345870315550.805412968444895
54124.52123.8142584151350.705741584865156
55125.03124.6918360228360.338163977163633
56123.56124.72252622794-1.16252622793953
57122.58124.718947845749-2.13894784574863
58122.95124.47516557072-1.52516557072043
59124.73124.3141899707760.41581002922382
60125.75126.650367311606-0.900367311605812
61125.16123.9238052690581.23619473094239


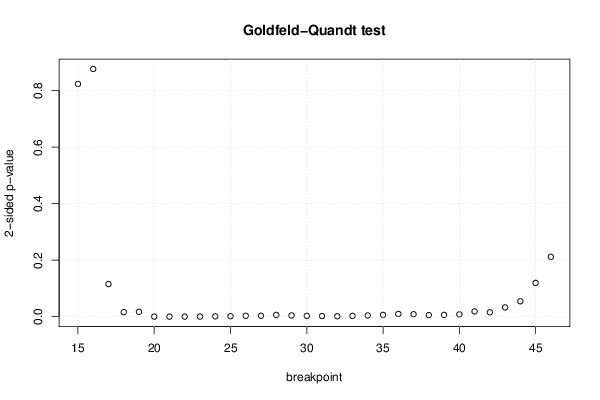
Goldfeld-Quandt test for Heteroskedasticity
p-valuesAlternative Hypothesis
breakpoint indexgreater2-sidedless
150.4119542904843460.8239085809686920.588045709515654
160.4384809090809760.8769618181619510.561519090919024
170.942239586322140.115520827355720.0577604136778598
180.9919223563115820.01615528737683560.00807764368841781
190.9914087238385840.01718255232283190.00859127616141594
200.9998028370698310.0003943258603383280.000197162930169164
210.9999124722330930.0001750555338146628.75277669073311e-05
220.9998519528878510.0002960942242978280.000148047112148914
230.9997101646513620.0005796706972750730.000289835348637537
240.9994398553318970.001120289336206080.000560144668103042
250.9991600652145580.001679869570884910.000839934785442457
260.9983921382749650.003215723450070740.00160786172503537
270.9983250280259020.003349943948196160.00167497197409808
280.9968548849192450.006290230161510690.00314511508075534
290.9978224300847160.004355139830568820.00217756991528441
300.9984346031346940.003130793730611280.00156539686530564
310.9988613805895470.002277238820905470.00113861941045273
320.9992112115175410.001577576964918050.000788788482459027
330.9985129580425850.002974083914830750.00148704195741537
340.9978588521321720.004282295735656790.00214114786782839
350.9967606581104840.006478683779031820.00323934188951591
360.995176396948310.009647206103380970.00482360305169048
370.9955852763513460.008829447297308540.00441472364865427
380.9971200596114540.005759880777091390.0028799403885457
390.9967835712609130.006432857478173850.00321642873908692
400.9958413903849510.008317219230098660.00415860961504933
410.9906767727631320.01864645447373620.00932322723686812
420.9922014236923120.01559715261537590.00779857630768795
430.9835302772157960.03293944556840890.0164697227842044
440.9727262964472110.05454740710557750.0272737035527887
450.9401321904677320.1197356190645370.0598678095322683
460.8940089685649470.2119820628701060.105991031435053

\begin{tabular}{lllllllll}
\hline
Goldfeld-Quandt test for Heteroskedasticity \tabularnewline
p-values & Alternative Hypothesis \tabularnewline
breakpoint index & greater & 2-sided & less \tabularnewline
15 & 0.411954290484346 & 0.823908580968692 & 0.588045709515654 \tabularnewline
16 & 0.438480909080976 & 0.876961818161951 & 0.561519090919024 \tabularnewline
17 & 0.94223958632214 & 0.11552082735572 & 0.0577604136778598 \tabularnewline
18 & 0.991922356311582 & 0.0161552873768356 & 0.00807764368841781 \tabularnewline
19 & 0.991408723838584 & 0.0171825523228319 & 0.00859127616141594 \tabularnewline
20 & 0.999802837069831 & 0.000394325860338328 & 0.000197162930169164 \tabularnewline
21 & 0.999912472233093 & 0.000175055533814662 & 8.75277669073311e-05 \tabularnewline
22 & 0.999851952887851 & 0.000296094224297828 & 0.000148047112148914 \tabularnewline
23 & 0.999710164651362 & 0.000579670697275073 & 0.000289835348637537 \tabularnewline
24 & 0.999439855331897 & 0.00112028933620608 & 0.000560144668103042 \tabularnewline
25 & 0.999160065214558 & 0.00167986957088491 & 0.000839934785442457 \tabularnewline
26 & 0.998392138274965 & 0.00321572345007074 & 0.00160786172503537 \tabularnewline
27 & 0.998325028025902 & 0.00334994394819616 & 0.00167497197409808 \tabularnewline
28 & 0.996854884919245 & 0.00629023016151069 & 0.00314511508075534 \tabularnewline
29 & 0.997822430084716 & 0.00435513983056882 & 0.00217756991528441 \tabularnewline
30 & 0.998434603134694 & 0.00313079373061128 & 0.00156539686530564 \tabularnewline
31 & 0.998861380589547 & 0.00227723882090547 & 0.00113861941045273 \tabularnewline
32 & 0.999211211517541 & 0.00157757696491805 & 0.000788788482459027 \tabularnewline
33 & 0.998512958042585 & 0.00297408391483075 & 0.00148704195741537 \tabularnewline
34 & 0.997858852132172 & 0.00428229573565679 & 0.00214114786782839 \tabularnewline
35 & 0.996760658110484 & 0.00647868377903182 & 0.00323934188951591 \tabularnewline
36 & 0.99517639694831 & 0.00964720610338097 & 0.00482360305169048 \tabularnewline
37 & 0.995585276351346 & 0.00882944729730854 & 0.00441472364865427 \tabularnewline
38 & 0.997120059611454 & 0.00575988077709139 & 0.0028799403885457 \tabularnewline
39 & 0.996783571260913 & 0.00643285747817385 & 0.00321642873908692 \tabularnewline
40 & 0.995841390384951 & 0.00831721923009866 & 0.00415860961504933 \tabularnewline
41 & 0.990676772763132 & 0.0186464544737362 & 0.00932322723686812 \tabularnewline
42 & 0.992201423692312 & 0.0155971526153759 & 0.00779857630768795 \tabularnewline
43 & 0.983530277215796 & 0.0329394455684089 & 0.0164697227842044 \tabularnewline
44 & 0.972726296447211 & 0.0545474071055775 & 0.0272737035527887 \tabularnewline
45 & 0.940132190467732 & 0.119735619064537 & 0.0598678095322683 \tabularnewline
46 & 0.894008968564947 & 0.211982062870106 & 0.105991031435053 \tabularnewline
\hline
\end{tabular}
%Source: https://freestatistics.org/blog/index.php?pk=189971&T=5

[TABLE]
[ROW][C]Goldfeld-Quandt test for Heteroskedasticity[/C][/ROW]
[ROW][C]p-values[/C][C]Alternative Hypothesis[/C][/ROW]
[ROW][C]breakpoint index[/C][C]greater[/C][C]2-sided[/C][C]less[/C][/ROW]
[ROW][C]15[/C][C]0.411954290484346[/C][C]0.823908580968692[/C][C]0.588045709515654[/C][/ROW]
[ROW][C]16[/C][C]0.438480909080976[/C][C]0.876961818161951[/C][C]0.561519090919024[/C][/ROW]
[ROW][C]17[/C][C]0.94223958632214[/C][C]0.11552082735572[/C][C]0.0577604136778598[/C][/ROW]
[ROW][C]18[/C][C]0.991922356311582[/C][C]0.0161552873768356[/C][C]0.00807764368841781[/C][/ROW]
[ROW][C]19[/C][C]0.991408723838584[/C][C]0.0171825523228319[/C][C]0.00859127616141594[/C][/ROW]
[ROW][C]20[/C][C]0.999802837069831[/C][C]0.000394325860338328[/C][C]0.000197162930169164[/C][/ROW]
[ROW][C]21[/C][C]0.999912472233093[/C][C]0.000175055533814662[/C][C]8.75277669073311e-05[/C][/ROW]
[ROW][C]22[/C][C]0.999851952887851[/C][C]0.000296094224297828[/C][C]0.000148047112148914[/C][/ROW]
[ROW][C]23[/C][C]0.999710164651362[/C][C]0.000579670697275073[/C][C]0.000289835348637537[/C][/ROW]
[ROW][C]24[/C][C]0.999439855331897[/C][C]0.00112028933620608[/C][C]0.000560144668103042[/C][/ROW]
[ROW][C]25[/C][C]0.999160065214558[/C][C]0.00167986957088491[/C][C]0.000839934785442457[/C][/ROW]
[ROW][C]26[/C][C]0.998392138274965[/C][C]0.00321572345007074[/C][C]0.00160786172503537[/C][/ROW]
[ROW][C]27[/C][C]0.998325028025902[/C][C]0.00334994394819616[/C][C]0.00167497197409808[/C][/ROW]
[ROW][C]28[/C][C]0.996854884919245[/C][C]0.00629023016151069[/C][C]0.00314511508075534[/C][/ROW]
[ROW][C]29[/C][C]0.997822430084716[/C][C]0.00435513983056882[/C][C]0.00217756991528441[/C][/ROW]
[ROW][C]30[/C][C]0.998434603134694[/C][C]0.00313079373061128[/C][C]0.00156539686530564[/C][/ROW]
[ROW][C]31[/C][C]0.998861380589547[/C][C]0.00227723882090547[/C][C]0.00113861941045273[/C][/ROW]
[ROW][C]32[/C][C]0.999211211517541[/C][C]0.00157757696491805[/C][C]0.000788788482459027[/C][/ROW]
[ROW][C]33[/C][C]0.998512958042585[/C][C]0.00297408391483075[/C][C]0.00148704195741537[/C][/ROW]
[ROW][C]34[/C][C]0.997858852132172[/C][C]0.00428229573565679[/C][C]0.00214114786782839[/C][/ROW]
[ROW][C]35[/C][C]0.996760658110484[/C][C]0.00647868377903182[/C][C]0.00323934188951591[/C][/ROW]
[ROW][C]36[/C][C]0.99517639694831[/C][C]0.00964720610338097[/C][C]0.00482360305169048[/C][/ROW]
[ROW][C]37[/C][C]0.995585276351346[/C][C]0.00882944729730854[/C][C]0.00441472364865427[/C][/ROW]
[ROW][C]38[/C][C]0.997120059611454[/C][C]0.00575988077709139[/C][C]0.0028799403885457[/C][/ROW]
[ROW][C]39[/C][C]0.996783571260913[/C][C]0.00643285747817385[/C][C]0.00321642873908692[/C][/ROW]
[ROW][C]40[/C][C]0.995841390384951[/C][C]0.00831721923009866[/C][C]0.00415860961504933[/C][/ROW]
[ROW][C]41[/C][C]0.990676772763132[/C][C]0.0186464544737362[/C][C]0.00932322723686812[/C][/ROW]
[ROW][C]42[/C][C]0.992201423692312[/C][C]0.0155971526153759[/C][C]0.00779857630768795[/C][/ROW]
[ROW][C]43[/C][C]0.983530277215796[/C][C]0.0329394455684089[/C][C]0.0164697227842044[/C][/ROW]
[ROW][C]44[/C][C]0.972726296447211[/C][C]0.0545474071055775[/C][C]0.0272737035527887[/C][/ROW]
[ROW][C]45[/C][C]0.940132190467732[/C][C]0.119735619064537[/C][C]0.0598678095322683[/C][/ROW]
[ROW][C]46[/C][C]0.894008968564947[/C][C]0.211982062870106[/C][C]0.105991031435053[/C][/ROW]
[/TABLE]
Source: https://freestatistics.org/blog/index.php?pk=189971&T=5

Globally Unique Identifier (entire table): ba.freestatistics.org/blog/index.php?pk=189971&T=5

As an alternative you can also use a QR Code:  

The GUIDs for individual cells are displayed in the table below:

Goldfeld-Quandt test for Heteroskedasticity
p-valuesAlternative Hypothesis
breakpoint indexgreater2-sidedless
150.4119542904843460.8239085809686920.588045709515654
160.4384809090809760.8769618181619510.561519090919024
170.942239586322140.115520827355720.0577604136778598
180.9919223563115820.01615528737683560.00807764368841781
190.9914087238385840.01718255232283190.00859127616141594
200.9998028370698310.0003943258603383280.000197162930169164
210.9999124722330930.0001750555338146628.75277669073311e-05
220.9998519528878510.0002960942242978280.000148047112148914
230.9997101646513620.0005796706972750730.000289835348637537
240.9994398553318970.001120289336206080.000560144668103042
250.9991600652145580.001679869570884910.000839934785442457
260.9983921382749650.003215723450070740.00160786172503537
270.9983250280259020.003349943948196160.00167497197409808
280.9968548849192450.006290230161510690.00314511508075534
290.9978224300847160.004355139830568820.00217756991528441
300.9984346031346940.003130793730611280.00156539686530564
310.9988613805895470.002277238820905470.00113861941045273
320.9992112115175410.001577576964918050.000788788482459027
330.9985129580425850.002974083914830750.00148704195741537
340.9978588521321720.004282295735656790.00214114786782839
350.9967606581104840.006478683779031820.00323934188951591
360.995176396948310.009647206103380970.00482360305169048
370.9955852763513460.008829447297308540.00441472364865427
380.9971200596114540.005759880777091390.0028799403885457
390.9967835712609130.006432857478173850.00321642873908692
400.9958413903849510.008317219230098660.00415860961504933
410.9906767727631320.01864645447373620.00932322723686812
420.9922014236923120.01559715261537590.00779857630768795
430.9835302772157960.03293944556840890.0164697227842044
440.9727262964472110.05454740710557750.0272737035527887
450.9401321904677320.1197356190645370.0598678095322683
460.8940089685649470.2119820628701060.105991031435053


Meta Analysis of Goldfeld-Quandt test for Heteroskedasticity
Description# significant tests% significant testsOK/NOK
1% type I error level210.65625NOK
5% type I error level260.8125NOK
10% type I error level270.84375NOK

\begin{tabular}{lllllllll}
\hline
Meta Analysis of Goldfeld-Quandt test for Heteroskedasticity \tabularnewline
Description & # significant tests & % significant tests & OK/NOK \tabularnewline
1% type I error level & 21 & 0.65625 & NOK \tabularnewline
5% type I error level & 26 & 0.8125 & NOK \tabularnewline
10% type I error level & 27 & 0.84375 & NOK \tabularnewline
\hline
\end{tabular}
%Source: https://freestatistics.org/blog/index.php?pk=189971&T=6

[TABLE]
[ROW][C]Meta Analysis of Goldfeld-Quandt test for Heteroskedasticity[/C][/ROW]
[ROW][C]Description[/C][C]# significant tests[/C][C]% significant tests[/C][C]OK/NOK[/C][/ROW]
[ROW][C]1% type I error level[/C][C]21[/C][C]0.65625[/C][C]NOK[/C][/ROW]
[ROW][C]5% type I error level[/C][C]26[/C][C]0.8125[/C][C]NOK[/C][/ROW]
[ROW][C]10% type I error level[/C][C]27[/C][C]0.84375[/C][C]NOK[/C][/ROW]
[/TABLE]
Source: https://freestatistics.org/blog/index.php?pk=189971&T=6

Globally Unique Identifier (entire table): ba.freestatistics.org/blog/index.php?pk=189971&T=6

As an alternative you can also use a QR Code:  

The GUIDs for individual cells are displayed in the table below:

Meta Analysis of Goldfeld-Quandt test for Heteroskedasticity
Description# significant tests% significant testsOK/NOK
1% type I error level210.65625NOK
5% type I error level260.8125NOK
10% type I error level270.84375NOK


Parameters (Session):
par1 = 7 ; par2 = Do not include Seasonal Dummies ; par3 = No Linear Trend ;
Parameters (R input):
par1 = 7 ; par2 = Do not include Seasonal Dummies ; par3 = No Linear Trend ;
R code (references can be found in the software module):
library(lattice)
library(lmtest)
n25 <- 25 #minimum number of obs. for Goldfeld-Quandt test
par1 <- as.numeric(par1)
x <- t(y)
k <- length(x[1,])
n <- length(x[,1])
x1 <- cbind(x[,par1], x[,1:k!=par1])
mycolnames <- c(colnames(x)[par1], colnames(x)[1:k!=par1])
colnames(x1) <- mycolnames #colnames(x)[par1]
x <- x1
if (par3 == 'First Differences'){
x2 <- array(0, dim=c(n-1,k), dimnames=list(1:(n-1), paste('(1-B)',colnames(x),sep='')))
for (i in 1:n-1) {
for (j in 1:k) {
x2[i,j] <- x[i+1,j] - x[i,j]
}
}
x <- x2
}
if (par2 == 'Include Monthly Dummies'){
x2 <- array(0, dim=c(n,11), dimnames=list(1:n, paste('M', seq(1:11), sep ='')))
for (i in 1:11){
x2[seq(i,n,12),i] <- 1
}
x <- cbind(x, x2)
}
if (par2 == 'Include Quarterly Dummies'){
x2 <- array(0, dim=c(n,3), dimnames=list(1:n, paste('Q', seq(1:3), sep ='')))
for (i in 1:3){
x2[seq(i,n,4),i] <- 1
}
x <- cbind(x, x2)
}
k <- length(x[1,])
if (par3 == 'Linear Trend'){
x <- cbind(x, c(1:n))
colnames(x)[k+1] <- 't'
}
x
k <- length(x[1,])
df <- as.data.frame(x)
(mylm <- lm(df))
(mysum <- summary(mylm))
if (n > n25) {
kp3 <- k + 3
nmkm3 <- n - k - 3
gqarr <- array(NA, dim=c(nmkm3-kp3+1,3))
numgqtests <- 0
numsignificant1 <- 0
numsignificant5 <- 0
numsignificant10 <- 0
for (mypoint in kp3:nmkm3) {
j <- 0
numgqtests <- numgqtests + 1
for (myalt in c('greater', 'two.sided', 'less')) {
j <- j + 1
gqarr[mypoint-kp3+1,j] <- gqtest(mylm, point=mypoint, alternative=myalt)$p.value
}
if (gqarr[mypoint-kp3+1,2] < 0.01) numsignificant1 <- numsignificant1 + 1
if (gqarr[mypoint-kp3+1,2] < 0.05) numsignificant5 <- numsignificant5 + 1
if (gqarr[mypoint-kp3+1,2] < 0.10) numsignificant10 <- numsignificant10 + 1
}
gqarr
}
bitmap(file='test0.png')
plot(x[,1], type='l', main='Actuals and Interpolation', ylab='value of Actuals and Interpolation (dots)', xlab='time or index')
points(x[,1]-mysum$resid)
grid()
dev.off()
bitmap(file='test1.png')
plot(mysum$resid, type='b', pch=19, main='Residuals', ylab='value of Residuals', xlab='time or index')
grid()
dev.off()
bitmap(file='test2.png')
hist(mysum$resid, main='Residual Histogram', xlab='values of Residuals')
grid()
dev.off()
bitmap(file='test3.png')
densityplot(~mysum$resid,col='black',main='Residual Density Plot', xlab='values of Residuals')
dev.off()
bitmap(file='test4.png')
qqnorm(mysum$resid, main='Residual Normal Q-Q Plot')
qqline(mysum$resid)
grid()
dev.off()
(myerror <- as.ts(mysum$resid))
bitmap(file='test5.png')
dum <- cbind(lag(myerror,k=1),myerror)
dum
dum1 <- dum[2:length(myerror),]
dum1
z <- as.data.frame(dum1)
z
plot(z,main=paste('Residual Lag plot, lowess, and regression line'), ylab='values of Residuals', xlab='lagged values of Residuals')
lines(lowess(z))
abline(lm(z))
grid()
dev.off()
bitmap(file='test6.png')
acf(mysum$resid, lag.max=length(mysum$resid)/2, main='Residual Autocorrelation Function')
grid()
dev.off()
bitmap(file='test7.png')
pacf(mysum$resid, lag.max=length(mysum$resid)/2, main='Residual Partial Autocorrelation Function')
grid()
dev.off()
bitmap(file='test8.png')
opar <- par(mfrow = c(2,2), oma = c(0, 0, 1.1, 0))
plot(mylm, las = 1, sub='Residual Diagnostics')
par(opar)
dev.off()
if (n > n25) {
bitmap(file='test9.png')
plot(kp3:nmkm3,gqarr[,2], main='Goldfeld-Quandt test',ylab='2-sided p-value',xlab='breakpoint')
grid()
dev.off()
}
load(file='createtable')
a<-table.start()
a<-table.row.start(a)
a<-table.element(a, 'Multiple Linear Regression - Estimated Regression Equation', 1, TRUE)
a<-table.row.end(a)
myeq <- colnames(x)[1]
myeq <- paste(myeq, '[t] = ', sep='')
for (i in 1:k){
if (mysum$coefficients[i,1] > 0) myeq <- paste(myeq, '+', '')
myeq <- paste(myeq, mysum$coefficients[i,1], sep=' ')
if (rownames(mysum$coefficients)[i] != '(Intercept)') {
myeq <- paste(myeq, rownames(mysum$coefficients)[i], sep='')
if (rownames(mysum$coefficients)[i] != 't') myeq <- paste(myeq, '[t]', sep='')
}
}
myeq <- paste(myeq, ' + e[t]')
a<-table.row.start(a)
a<-table.element(a, myeq)
a<-table.row.end(a)
a<-table.end(a)
table.save(a,file='mytable1.tab')
a<-table.start()
a<-table.row.start(a)
a<-table.element(a,hyperlink('ols1.htm','Multiple Linear Regression - Ordinary Least Squares',''), 6, TRUE)
a<-table.row.end(a)
a<-table.row.start(a)
a<-table.element(a,'Variable',header=TRUE)
a<-table.element(a,'Parameter',header=TRUE)
a<-table.element(a,'S.D.',header=TRUE)
a<-table.element(a,'T-STAT
H0: parameter = 0',header=TRUE)
a<-table.element(a,'2-tail p-value',header=TRUE)
a<-table.element(a,'1-tail p-value',header=TRUE)
a<-table.row.end(a)
for (i in 1:k){
a<-table.row.start(a)
a<-table.element(a,rownames(mysum$coefficients)[i],header=TRUE)
a<-table.element(a,mysum$coefficients[i,1])
a<-table.element(a, round(mysum$coefficients[i,2],6))
a<-table.element(a, round(mysum$coefficients[i,3],4))
a<-table.element(a, round(mysum$coefficients[i,4],6))
a<-table.element(a, round(mysum$coefficients[i,4]/2,6))
a<-table.row.end(a)
}
a<-table.end(a)
table.save(a,file='mytable2.tab')
a<-table.start()
a<-table.row.start(a)
a<-table.element(a, 'Multiple Linear Regression - Regression Statistics', 2, TRUE)
a<-table.row.end(a)
a<-table.row.start(a)
a<-table.element(a, 'Multiple R',1,TRUE)
a<-table.element(a, sqrt(mysum$r.squared))
a<-table.row.end(a)
a<-table.row.start(a)
a<-table.element(a, 'R-squared',1,TRUE)
a<-table.element(a, mysum$r.squared)
a<-table.row.end(a)
a<-table.row.start(a)
a<-table.element(a, 'Adjusted R-squared',1,TRUE)
a<-table.element(a, mysum$adj.r.squared)
a<-table.row.end(a)
a<-table.row.start(a)
a<-table.element(a, 'F-TEST (value)',1,TRUE)
a<-table.element(a, mysum$fstatistic[1])
a<-table.row.end(a)
a<-table.row.start(a)
a<-table.element(a, 'F-TEST (DF numerator)',1,TRUE)
a<-table.element(a, mysum$fstatistic[2])
a<-table.row.end(a)
a<-table.row.start(a)
a<-table.element(a, 'F-TEST (DF denominator)',1,TRUE)
a<-table.element(a, mysum$fstatistic[3])
a<-table.row.end(a)
a<-table.row.start(a)
a<-table.element(a, 'p-value',1,TRUE)
a<-table.element(a, 1-pf(mysum$fstatistic[1],mysum$fstatistic[2],mysum$fstatistic[3]))
a<-table.row.end(a)
a<-table.row.start(a)
a<-table.element(a, 'Multiple Linear Regression - Residual Statistics', 2, TRUE)
a<-table.row.end(a)
a<-table.row.start(a)
a<-table.element(a, 'Residual Standard Deviation',1,TRUE)
a<-table.element(a, mysum$sigma)
a<-table.row.end(a)
a<-table.row.start(a)
a<-table.element(a, 'Sum Squared Residuals',1,TRUE)
a<-table.element(a, sum(myerror*myerror))
a<-table.row.end(a)
a<-table.end(a)
table.save(a,file='mytable3.tab')
a<-table.start()
a<-table.row.start(a)
a<-table.element(a, 'Multiple Linear Regression - Actuals, Interpolation, and Residuals', 4, TRUE)
a<-table.row.end(a)
a<-table.row.start(a)
a<-table.element(a, 'Time or Index', 1, TRUE)
a<-table.element(a, 'Actuals', 1, TRUE)
a<-table.element(a, 'Interpolation
Forecast', 1, TRUE)
a<-table.element(a, 'Residuals
Prediction Error', 1, TRUE)
a<-table.row.end(a)
for (i in 1:n) {
a<-table.row.start(a)
a<-table.element(a,i, 1, TRUE)
a<-table.element(a,x[i])
a<-table.element(a,x[i]-mysum$resid[i])
a<-table.element(a,mysum$resid[i])
a<-table.row.end(a)
}
a<-table.end(a)
table.save(a,file='mytable4.tab')
if (n > n25) {
a<-table.start()
a<-table.row.start(a)
a<-table.element(a,'Goldfeld-Quandt test for Heteroskedasticity',4,TRUE)
a<-table.row.end(a)
a<-table.row.start(a)
a<-table.element(a,'p-values',header=TRUE)
a<-table.element(a,'Alternative Hypothesis',3,header=TRUE)
a<-table.row.end(a)
a<-table.row.start(a)
a<-table.element(a,'breakpoint index',header=TRUE)
a<-table.element(a,'greater',header=TRUE)
a<-table.element(a,'2-sided',header=TRUE)
a<-table.element(a,'less',header=TRUE)
a<-table.row.end(a)
for (mypoint in kp3:nmkm3) {
a<-table.row.start(a)
a<-table.element(a,mypoint,header=TRUE)
a<-table.element(a,gqarr[mypoint-kp3+1,1])
a<-table.element(a,gqarr[mypoint-kp3+1,2])
a<-table.element(a,gqarr[mypoint-kp3+1,3])
a<-table.row.end(a)
}
a<-table.end(a)
table.save(a,file='mytable5.tab')
a<-table.start()
a<-table.row.start(a)
a<-table.element(a,'Meta Analysis of Goldfeld-Quandt test for Heteroskedasticity',4,TRUE)
a<-table.row.end(a)
a<-table.row.start(a)
a<-table.element(a,'Description',header=TRUE)
a<-table.element(a,'# significant tests',header=TRUE)
a<-table.element(a,'% significant tests',header=TRUE)
a<-table.element(a,'OK/NOK',header=TRUE)
a<-table.row.end(a)
a<-table.row.start(a)
a<-table.element(a,'1% type I error level',header=TRUE)
a<-table.element(a,numsignificant1)
a<-table.element(a,numsignificant1/numgqtests)
if (numsignificant1/numgqtests < 0.01) dum <- 'OK' else dum <- 'NOK'
a<-table.element(a,dum)
a<-table.row.end(a)
a<-table.row.start(a)
a<-table.element(a,'5% type I error level',header=TRUE)
a<-table.element(a,numsignificant5)
a<-table.element(a,numsignificant5/numgqtests)
if (numsignificant5/numgqtests < 0.05) dum <- 'OK' else dum <- 'NOK'
a<-table.element(a,dum)
a<-table.row.end(a)
a<-table.row.start(a)
a<-table.element(a,'10% type I error level',header=TRUE)
a<-table.element(a,numsignificant10)
a<-table.element(a,numsignificant10/numgqtests)
if (numsignificant10/numgqtests < 0.1) dum <- 'OK' else dum <- 'NOK'
a<-table.element(a,dum)
a<-table.row.end(a)
a<-table.end(a)
table.save(a,file='mytable6.tab')
}