| Multiple Linear Regression - Estimated Regression Equation |
| Restaurant[t] = + 0.612279481356668 + 0.34806141560409Pepersteak[t] + 0.0286367349894139Salade[t] + 0.0646304314720664Tong[t] + 0.207909749610629Chinees[t] + 0.0610196985744468Pizza[t] -1.78593963574916Bier[t] + 0.647468977943055SpecBier[t] + 1.98306510164856Aperitief[t] -2.10203637791866Water[t] + 0.0345586178920059Limonade[t] + 0.00185310792597564Expresso[t] -0.231369469707634Frieten[t] -0.493662410503196Broodje[t] + 0.0740732635087588vleessnack[t] + 0.58657457027997Hamburger[t] + 4.56510746889199Frisdrank[t] -2.21076182163974Candybar[t] + e[t] |
| Multiple Linear Regression - Ordinary Least Squares | |||||
| Variable | Parameter | S.D. | T-STAT H0: parameter = 0 | 2-tail p-value | 1-tail p-value |
| (Intercept) | 0.612279481356668 | 0.996757 | 0.6143 | 0.54132 | 0.27066 |
| Pepersteak | 0.34806141560409 | 0.088766 | 3.9211 | 0.000226 | 0.000113 |
| Salade | 0.0286367349894139 | 0.133889 | 0.2139 | 0.831351 | 0.415675 |
| Tong | 0.0646304314720664 | 0.034669 | 1.8642 | 0.067107 | 0.033554 |
| Chinees | 0.207909749610629 | 0.084196 | 2.4693 | 0.016351 | 0.008175 |
| Pizza | 0.0610196985744468 | 0.10824 | 0.5637 | 0.574994 | 0.287497 |
| Bier | -1.78593963574916 | 0.410215 | -4.3537 | 5.2e-05 | 2.6e-05 |
| SpecBier | 0.647468977943055 | 0.29135 | 2.2223 | 0.029981 | 0.014991 |
| Aperitief | 1.98306510164856 | 0.384192 | 5.1617 | 3e-06 | 1e-06 |
| Water | -2.10203637791866 | 1.040022 | -2.0211 | 0.047659 | 0.02383 |
| Limonade | 0.0345586178920059 | 1.293181 | 0.0267 | 0.978767 | 0.489384 |
| Expresso | 0.00185310792597564 | 1.255684 | 0.0015 | 0.998827 | 0.499414 |
| Frieten | -0.231369469707634 | 0.406491 | -0.5692 | 0.571319 | 0.285659 |
| Broodje | -0.493662410503196 | 0.673275 | -0.7332 | 0.466229 | 0.233115 |
| vleessnack | 0.0740732635087588 | 0.711228 | 0.1041 | 0.917393 | 0.458697 |
| Hamburger | 0.58657457027997 | 0.333187 | 1.7605 | 0.083336 | 0.041668 |
| Frisdrank | 4.56510746889199 | 0.80188 | 5.693 | 0 | 0 |
| Candybar | -2.21076182163974 | 0.891291 | -2.4804 | 0.015898 | 0.007949 |
| Multiple Linear Regression - Regression Statistics | |
| Multiple R | 0.998409577288659 |
| R-squared | 0.996821684021719 |
| Adjusted R-squared | 0.99593592383105 |
| F-TEST (value) | 1125.3855101225 |
| F-TEST (DF numerator) | 17 |
| F-TEST (DF denominator) | 61 |
| p-value | 0 |
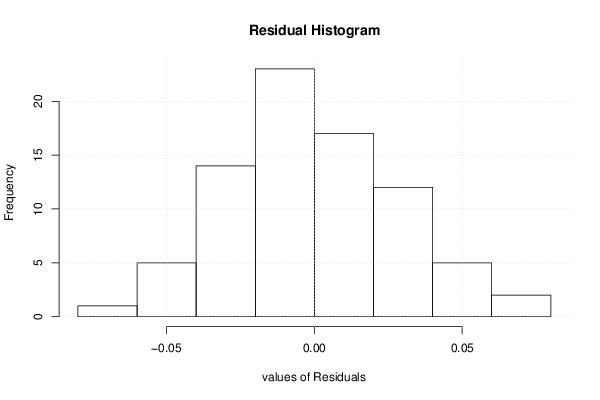
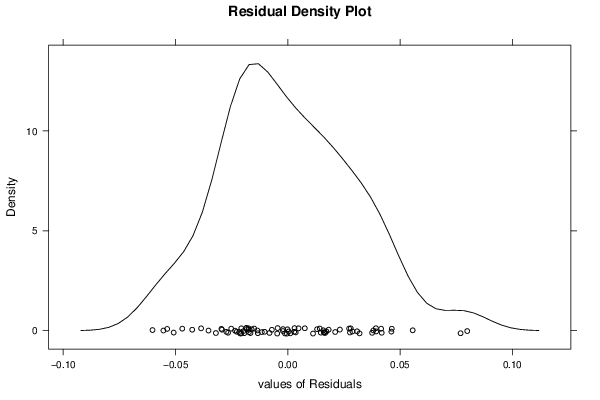
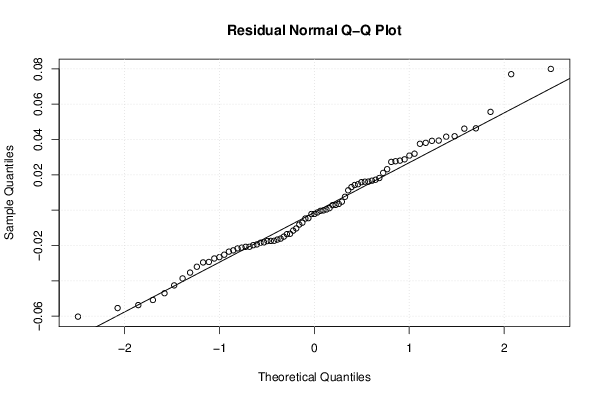
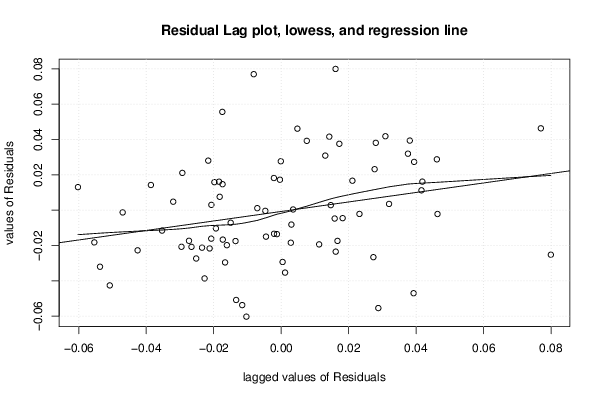
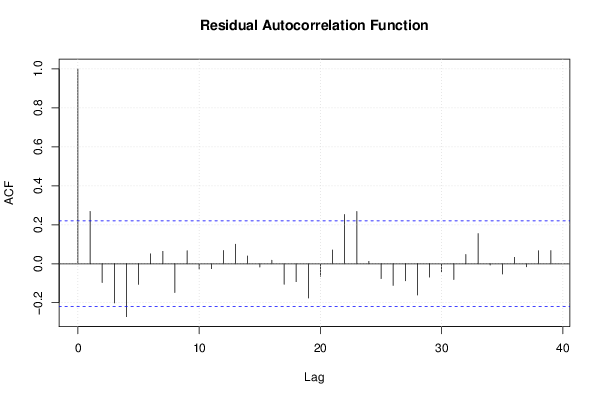
| Multiple Linear Regression - Residual Statistics | |
| Residual Standard Deviation | 0.0334382474387354 |
| Sum Squared Residuals | 0.0682050998982199 |
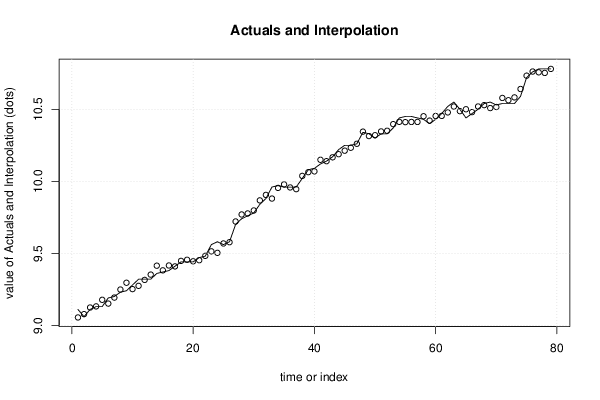
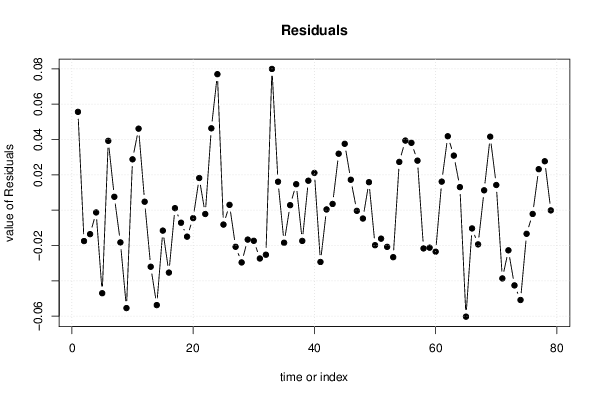
| Multiple Linear Regression - Actuals, Interpolation, and Residuals | |||
| Time or Index | Actuals | Interpolation Forecast | Residuals Prediction Error |
| 1 | 9.11 | 9.05435458917505 | 0.0556454108249511 |
| 2 | 9.06 | 9.07745016627333 | -0.0174501662733288 |
| 3 | 9.11 | 9.12353392116297 | -0.0135339211629668 |
| 4 | 9.13 | 9.13125315724363 | -0.00125315724362685 |
| 5 | 9.13 | 9.17698440238129 | -0.0469844023812919 |
| 6 | 9.19 | 9.15075088725023 | 0.0392491127497651 |
| 7 | 9.2 | 9.19240889470355 | 0.00759110529645007 |
| 8 | 9.23 | 9.24822192496332 | -0.0182219249633149 |
| 9 | 9.24 | 9.29539072176441 | -0.0553907217644148 |
| 10 | 9.28 | 9.25120527441757 | 0.0287947255824332 |
| 11 | 9.32 | 9.2738554180256 | 0.0461445819744005 |
| 12 | 9.32 | 9.31519873983149 | 0.00480126016850893 |
| 13 | 9.32 | 9.35200188787868 | -0.0320018878786752 |
| 14 | 9.36 | 9.41370517942761 | -0.0537051794276097 |
| 15 | 9.37 | 9.38155032398836 | -0.0115503239883567 |
| 16 | 9.38 | 9.41530505171399 | -0.0353050517139885 |
| 17 | 9.41 | 9.40884560958498 | 0.00115439041502119 |
| 18 | 9.44 | 9.4470837195033 | -0.00708371950329512 |
| 19 | 9.44 | 9.45496756268623 | -0.0149675626862276 |
| 20 | 9.44 | 9.44450157551194 | -0.00450157551194026 |
| 21 | 9.47 | 9.45178225433474 | 0.0182177456652622 |
| 22 | 9.48 | 9.48215155622901 | -0.00215155622901196 |
| 23 | 9.56 | 9.51366366430705 | 0.0463363356929479 |
| 24 | 9.58 | 9.50303002021671 | 0.0769699797832865 |
| 25 | 9.56 | 9.56813357729121 | -0.00813357729121367 |
| 26 | 9.58 | 9.57697867257106 | 0.00302132742894228 |
| 27 | 9.7 | 9.72069365450007 | -0.0206936545000702 |
| 28 | 9.74 | 9.76955705188156 | -0.0295570518815597 |
| 29 | 9.76 | 9.77663176522375 | -0.0166317652237458 |
| 30 | 9.78 | 9.7973154981983 | -0.0173154981982991 |
| 31 | 9.84 | 9.8673285430478 | -0.0273285430478055 |
| 32 | 9.88 | 9.90519257012839 | -0.0251925701283925 |
| 33 | 9.96 | 9.88006435852114 | 0.0799356414788584 |
| 34 | 9.97 | 9.95388513567299 | 0.016114864327009 |
| 35 | 9.96 | 9.97841598931565 | -0.0184159893156473 |
| 36 | 9.96 | 9.95714747043634 | 0.00285252956366502 |
| 37 | 9.96 | 9.94529467223516 | 0.0147053277648421 |
| 38 | 10.02 | 10.0373800505423 | -0.0173800505422898 |
| 39 | 10.08 | 10.0633104577036 | 0.0166895422963639 |
| 40 | 10.09 | 10.0688889816725 | 0.0211110183275068 |
| 41 | 10.12 | 10.1492985342957 | -0.0292985342956886 |
| 42 | 10.14 | 10.1395790544551 | 0.000420945544934595 |
| 43 | 10.17 | 10.166463443734 | 0.00353655626597336 |
| 44 | 10.22 | 10.1880307223073 | 0.0319692776926887 |
| 45 | 10.25 | 10.2124227353024 | 0.0375772646975679 |
| 46 | 10.25 | 10.2327645114757 | 0.0172354885242581 |
| 47 | 10.26 | 10.2603634732388 | -0.000363473238831055 |
| 48 | 10.34 | 10.3447060903427 | -0.00470609034271754 |
| 49 | 10.33 | 10.3141401013845 | 0.0158598986155026 |
| 50 | 10.3 | 10.3198008627133 | -0.0198008627133083 |
| 51 | 10.33 | 10.3460966469021 | -0.0160966469020892 |
| 52 | 10.33 | 10.3507364379942 | -0.0207364379941934 |
| 53 | 10.37 | 10.3965867531968 | -0.0265867531968401 |
| 54 | 10.44 | 10.4126720742418 | 0.0273279257582018 |
| 55 | 10.45 | 10.4106000383874 | 0.0393999616125965 |
| 56 | 10.45 | 10.4118739721522 | 0.0381260278478115 |
| 57 | 10.44 | 10.411956267411 | 0.0280437325889846 |
| 58 | 10.43 | 10.4516223813068 | -0.0216223813067749 |
| 59 | 10.4 | 10.4212110394962 | -0.0212110394961769 |
| 60 | 10.43 | 10.4534637407777 | -0.0234637407776715 |
| 61 | 10.47 | 10.4538336443613 | 0.0161663556386803 |
| 62 | 10.52 | 10.4781506038329 | 0.0418493961670694 |
| 63 | 10.55 | 10.5191077032858 | 0.0308922967142451 |
| 64 | 10.5 | 10.4869341432236 | 0.0130658567764057 |
| 65 | 10.44 | 10.5002410676712 | -0.0602410676711735 |
| 66 | 10.47 | 10.4803159461471 | -0.0103159461470768 |
| 67 | 10.5 | 10.519348860085 | -0.0193488600849703 |
| 68 | 10.54 | 10.5287471594191 | 0.0112528405809186 |
| 69 | 10.55 | 10.5084101243442 | 0.0415898756558309 |
| 70 | 10.53 | 10.515741024324 | 0.0142589756759657 |
| 71 | 10.54 | 10.578611210548 | -0.0386112105479675 |
| 72 | 10.54 | 10.5627081104865 | -0.0227081104864619 |
| 73 | 10.54 | 10.5825568447443 | -0.0425568447442625 |
| 74 | 10.59 | 10.6408097173729 | -0.0508097173729299 |
| 75 | 10.72 | 10.7333475891305 | -0.0133475891305442 |
| 76 | 10.76 | 10.7621222271174 | -0.00212222711737941 |
| 77 | 10.78 | 10.7567992431668 | 0.023200756833169 |
| 78 | 10.78 | 10.7523018602476 | 0.0276981397523543 |
| 79 | 10.78 | 10.7801090878592 | -0.000109087859242752 |
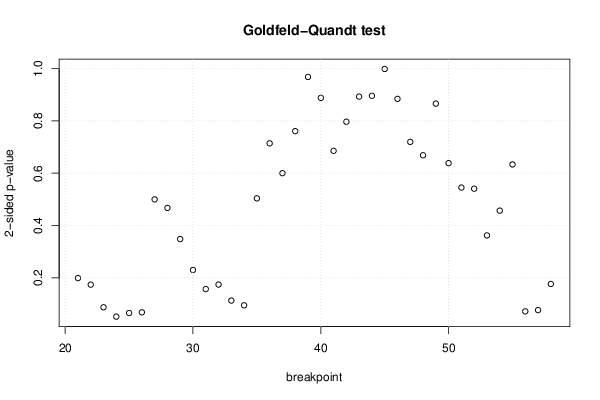
| Goldfeld-Quandt test for Heteroskedasticity | |||
| p-values | Alternative Hypothesis | ||
| breakpoint index | greater | 2-sided | less |
| 21 | 0.0993269088674747 | 0.198653817734949 | 0.900673091132525 |
| 22 | 0.0867602540185438 | 0.173520508037088 | 0.913239745981456 |
| 23 | 0.0435888683969107 | 0.0871777367938214 | 0.956411131603089 |
| 24 | 0.0255948879614953 | 0.0511897759229905 | 0.974405112038505 |
| 25 | 0.0325323747522163 | 0.0650647495044326 | 0.967467625247784 |
| 26 | 0.0339002293862255 | 0.0678004587724509 | 0.966099770613775 |
| 27 | 0.249965739432779 | 0.499931478865558 | 0.750034260567221 |
| 28 | 0.233604208200083 | 0.467208416400167 | 0.766395791799917 |
| 29 | 0.173947328636163 | 0.347894657272326 | 0.826052671363837 |
| 30 | 0.114826400857489 | 0.229652801714978 | 0.885173599142511 |
| 31 | 0.0783634866631411 | 0.156726973326282 | 0.921636513336859 |
| 32 | 0.0870173233545486 | 0.174034646709097 | 0.912982676645451 |
| 33 | 0.0563977229127153 | 0.112795445825431 | 0.943602277087285 |
| 34 | 0.0472722871839408 | 0.0945445743678816 | 0.952727712816059 |
| 35 | 0.251882178269914 | 0.503764356539829 | 0.748117821730085 |
| 36 | 0.357153917295248 | 0.714307834590495 | 0.642846082704752 |
| 37 | 0.300047975102341 | 0.600095950204683 | 0.699952024897659 |
| 38 | 0.380506434461837 | 0.761012868923675 | 0.619493565538163 |
| 39 | 0.484104246828259 | 0.968208493656519 | 0.515895753171741 |
| 40 | 0.444136141538608 | 0.888272283077216 | 0.555863858461392 |
| 41 | 0.657146023650121 | 0.685707952699759 | 0.342853976349879 |
| 42 | 0.601470693532312 | 0.797058612935377 | 0.398529306467688 |
| 43 | 0.553444955477104 | 0.893110089045791 | 0.446555044522896 |
| 44 | 0.55188821821009 | 0.896223563579821 | 0.44811178178991 |
| 45 | 0.499457552282623 | 0.998915104565246 | 0.500542447717377 |
| 46 | 0.442245141181721 | 0.884490282363442 | 0.557754858818279 |
| 47 | 0.359939855921294 | 0.719879711842589 | 0.640060144078706 |
| 48 | 0.334335899163444 | 0.668671798326888 | 0.665664100836556 |
| 49 | 0.566886788103617 | 0.866226423792766 | 0.433113211896383 |
| 50 | 0.680759714339825 | 0.63848057132035 | 0.319240285660175 |
| 51 | 0.727465599652802 | 0.545068800694397 | 0.272534400347198 |
| 52 | 0.729657523855394 | 0.540684952289213 | 0.270342476144606 |
| 53 | 0.819018606143645 | 0.361962787712711 | 0.180981393856355 |
| 54 | 0.771606307890453 | 0.456787384219095 | 0.228393692109547 |
| 55 | 0.683170830807821 | 0.633658338384357 | 0.316829169192178 |
| 56 | 0.964304083036693 | 0.0713918339266141 | 0.0356959169633071 |
| 57 | 0.961878476077196 | 0.0762430478456072 | 0.0381215239228036 |
| 58 | 0.911853769819716 | 0.176292460360569 | 0.0881462301802844 |
| Meta Analysis of Goldfeld-Quandt test for Heteroskedasticity | |||
| Description | # significant tests | % significant tests | OK/NOK |
| 1% type I error level | 0 | 0 | OK |
| 5% type I error level | 0 | 0 | OK |
| 10% type I error level | 7 | 0.184210526315789 | NOK |