| Multiple Linear Regression - Estimated Regression Equation |
| Totaal[t] = + 0.0981473390861909 + 0.419630839440572Mannen[t] + 0.338435874594549Vrouwen[t] + 0.0113186213520091TotaalJongerdan25jaar[t] + 0.0067365270872766MannenJongerdan25jaar[t] + 0.00647230505605263VrouwenJongerdan25jaar[t] + 0.200738507619287TotaalOuderdan25[t] -0.0201043486615964MannenOuderdan25[t] + 0.013167842822975`VrouwenOuderdan25\r`[t] + e[t] |
| Multiple Linear Regression - Ordinary Least Squares | |||||
| Variable | Parameter | S.D. | T-STAT H0: parameter = 0 | 2-tail p-value | 1-tail p-value |
| (Intercept) | 0.0981473390861909 | 0.080352 | 1.2215 | 0.227421 | 0.11371 |
| Mannen | 0.419630839440572 | 0.070303 | 5.9689 | 0 | 0 |
| Vrouwen | 0.338435874594549 | 0.05877 | 5.7587 | 0 | 0 |
| TotaalJongerdan25jaar | 0.0113186213520091 | 0.011754 | 0.963 | 0.34001 | 0.170005 |
| MannenJongerdan25jaar | 0.0067365270872766 | 0.007346 | 0.917 | 0.363386 | 0.181693 |
| VrouwenJongerdan25jaar | 0.00647230505605263 | 0.005436 | 1.1907 | 0.239171 | 0.119586 |
| TotaalOuderdan25 | 0.200738507619287 | 0.163362 | 1.2288 | 0.22468 | 0.11234 |
| MannenOuderdan25 | -0.0201043486615964 | 0.105651 | -0.1903 | 0.849822 | 0.424911 |
| `VrouwenOuderdan25\r` | 0.013167842822975 | 0.087707 | 0.1501 | 0.881239 | 0.44062 |
| Multiple Linear Regression - Regression Statistics | |
| Multiple R | 0.998484860757407 |
| R-squared | 0.996972017161738 |
| Adjusted R-squared | 0.996506173648159 |
| F-TEST (value) | 2140.14360638539 |
| F-TEST (DF numerator) | 8 |
| F-TEST (DF denominator) | 52 |
| p-value | 0 |
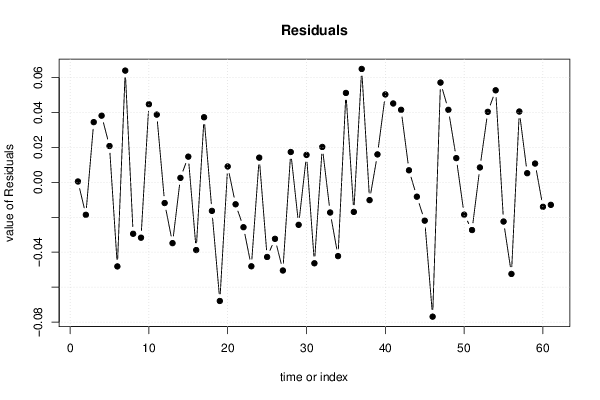
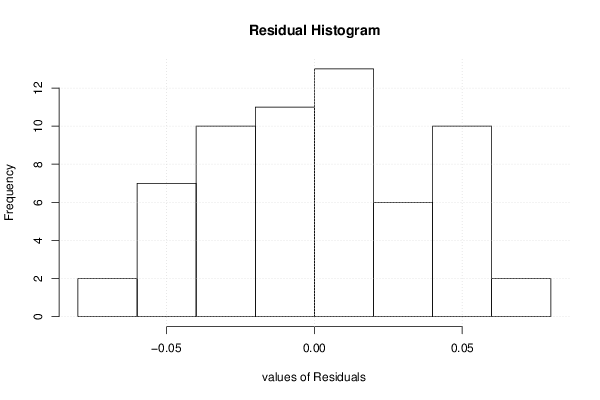
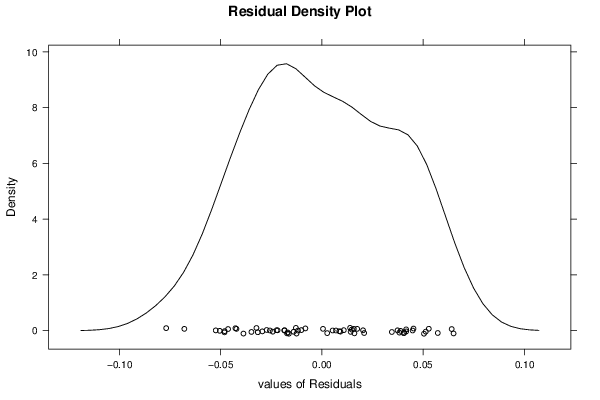
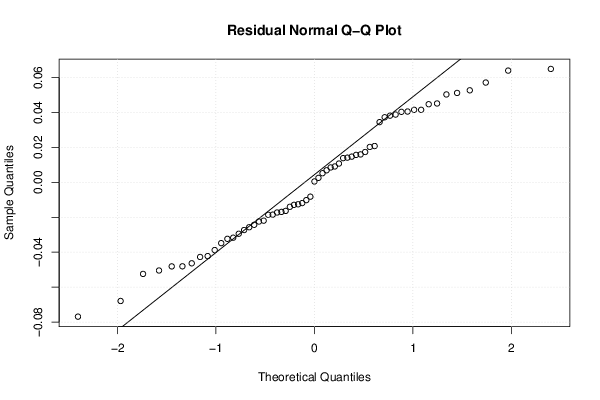
| Multiple Linear Regression - Residual Statistics | |
| Residual Standard Deviation | 0.0381559370428426 |
| Sum Squared Residuals | 0.075705527644103 |
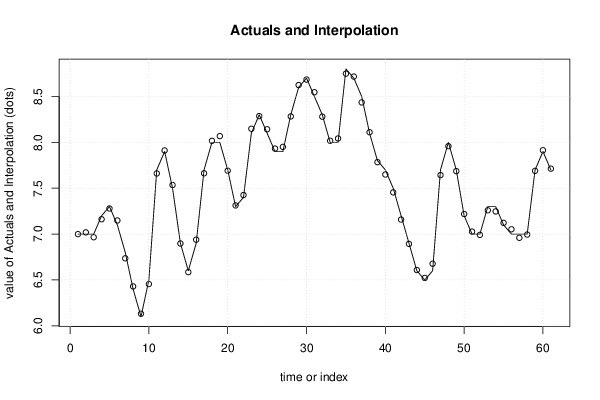
| Multiple Linear Regression - Actuals, Interpolation, and Residuals | |||
| Time or Index | Actuals | Interpolation Forecast | Residuals Prediction Error |
| 1 | 7 | 6.99947307253413 | 0.000526927465873532 |
| 2 | 7 | 7.01856147772271 | -0.0185614777227082 |
| 3 | 7 | 6.96546469457374 | 0.0345353054262614 |
| 4 | 7.2 | 7.16176257720824 | 0.0382374227917585 |
| 5 | 7.3 | 7.27915495632105 | 0.0208450436789482 |
| 6 | 7.1 | 7.14812560180496 | -0.0481256018049578 |
| 7 | 6.8 | 6.73593679616924 | 0.0640632038307588 |
| 8 | 6.4 | 6.42943117394148 | -0.0294311739414822 |
| 9 | 6.1 | 6.13167336511378 | -0.0316733651137793 |
| 10 | 6.5 | 6.45521318257488 | 0.0447868174251197 |
| 11 | 7.7 | 7.66114739004785 | 0.0388526099521477 |
| 12 | 7.9 | 7.91182884049663 | -0.0118288404966244 |
| 13 | 7.5 | 7.53480040660266 | -0.0348004066026613 |
| 14 | 6.9 | 6.89739703548246 | 0.00260296451753997 |
| 15 | 6.6 | 6.58524601599587 | 0.0147539840041261 |
| 16 | 6.9 | 6.93875616552684 | -0.038756165526842 |
| 17 | 7.7 | 7.66267655141213 | 0.0373234485878663 |
| 18 | 8 | 8.01632452524989 | -0.0163245252498923 |
| 19 | 8 | 8.06794053112339 | -0.067940531123385 |
| 20 | 7.7 | 7.69087746010875 | 0.00912253989124606 |
| 21 | 7.3 | 7.31253224193249 | -0.0125322419324929 |
| 22 | 7.4 | 7.42568310269991 | -0.0256831026999138 |
| 23 | 8.1 | 8.14806830105476 | -0.0480683010547619 |
| 24 | 8.3 | 8.28582046112492 | 0.0141795388750849 |
| 25 | 8.1 | 8.14272019744154 | -0.0427201974415444 |
| 26 | 7.9 | 7.93232834350552 | -0.0323283435055183 |
| 27 | 7.9 | 7.95047166604953 | -0.0504716660495318 |
| 28 | 8.3 | 8.28257964114518 | 0.0174203588548253 |
| 29 | 8.6 | 8.62429566776988 | -0.0242956677698827 |
| 30 | 8.7 | 8.68424226096146 | 0.0157577390385356 |
| 31 | 8.5 | 8.54634182698592 | -0.0463418269859197 |
| 32 | 8.3 | 8.27969624491352 | 0.0203037550864776 |
| 33 | 8 | 8.0172464221703 | -0.0172464221703036 |
| 34 | 8 | 8.04222003469525 | -0.0422200346952477 |
| 35 | 8.8 | 8.74875159180988 | 0.0512484081901171 |
| 36 | 8.7 | 8.71689782936241 | -0.016897829362409 |
| 37 | 8.5 | 8.43499762981862 | 0.0650023701813834 |
| 38 | 8.1 | 8.11015923203408 | -0.0101592320340816 |
| 39 | 7.8 | 7.78396385701868 | 0.0160361429813154 |
| 40 | 7.7 | 7.64960728335413 | 0.0503927166458667 |
| 41 | 7.5 | 7.45478238905388 | 0.0452176109461193 |
| 42 | 7.2 | 7.15842127115672 | 0.0415787288432811 |
| 43 | 6.9 | 6.89306151166246 | 0.00693848833753681 |
| 44 | 6.6 | 6.60817718817572 | -0.0081771881757196 |
| 45 | 6.5 | 6.52191892876006 | -0.0219189287600578 |
| 46 | 6.6 | 6.67691631858159 | -0.0769163185815859 |
| 47 | 7.7 | 7.64279325626191 | 0.0572067437380935 |
| 48 | 8 | 7.9584100387766 | 0.0415899612233982 |
| 49 | 7.7 | 7.68608466387936 | 0.01391533612064 |
| 50 | 7.2 | 7.21846825995911 | -0.0184682599591067 |
| 51 | 7 | 7.0272861206875 | -0.0272861206874959 |
| 52 | 7 | 6.99143209836188 | 0.0085679016381185 |
| 53 | 7.3 | 7.25956931697349 | 0.0404306830265051 |
| 54 | 7.3 | 7.24723357901088 | 0.052766420989124 |
| 55 | 7.1 | 7.12241936144786 | -0.0224193614478589 |
| 56 | 7 | 7.05244128626105 | -0.0524412862610515 |
| 57 | 7 | 6.95939185403418 | 0.0406081459658158 |
| 58 | 7 | 6.99473714792303 | 0.00526285207696667 |
| 59 | 7.7 | 7.68920373572581 | 0.0107962642741911 |
| 60 | 7.9 | 7.91397617305263 | -0.0139761730526321 |
| 61 | 7.7 | 7.71285984439559 | -0.0128598443955942 |
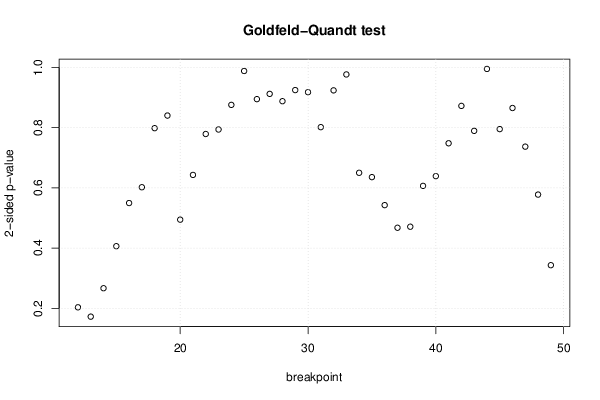
| Goldfeld-Quandt test for Heteroskedasticity | |||
| p-values | Alternative Hypothesis | ||
| breakpoint index | greater | 2-sided | less |
| 12 | 0.898361336623935 | 0.203277326752131 | 0.101638663376065 |
| 13 | 0.91388513611514 | 0.172229727769721 | 0.0861148638848605 |
| 14 | 0.866704876181194 | 0.266590247637612 | 0.133295123818806 |
| 15 | 0.796912087513691 | 0.406175824972618 | 0.203087912486309 |
| 16 | 0.725293538999207 | 0.549412922001586 | 0.274706461000793 |
| 17 | 0.699060050403271 | 0.601879899193457 | 0.300939949596729 |
| 18 | 0.601000462002492 | 0.797999075995017 | 0.398999537997508 |
| 19 | 0.580057789789506 | 0.839884420420988 | 0.419942210210494 |
| 20 | 0.752881853385869 | 0.494236293228261 | 0.247118146614131 |
| 21 | 0.678633447281802 | 0.642733105436397 | 0.321366552718198 |
| 22 | 0.610674464433117 | 0.778651071133766 | 0.389325535566883 |
| 23 | 0.603199571995164 | 0.793600856009673 | 0.396800428004836 |
| 24 | 0.562337103748265 | 0.875325792503471 | 0.437662896251735 |
| 25 | 0.493900029281971 | 0.987800058563942 | 0.506099970718029 |
| 26 | 0.447201376577608 | 0.894402753155215 | 0.552798623422392 |
| 27 | 0.544075313557595 | 0.911849372884811 | 0.455924686442405 |
| 28 | 0.556240708767362 | 0.887518582465275 | 0.443759291232638 |
| 29 | 0.537776023666614 | 0.924447952666773 | 0.462223976333386 |
| 30 | 0.458729315706803 | 0.917458631413606 | 0.541270684293197 |
| 31 | 0.599341716956397 | 0.801316566087205 | 0.400658283043603 |
| 32 | 0.538225673768176 | 0.923548652463647 | 0.461774326231824 |
| 33 | 0.51183331833732 | 0.97633336332536 | 0.48816668166268 |
| 34 | 0.675070295702269 | 0.649859408595462 | 0.324929704297731 |
| 35 | 0.6822645332957 | 0.6354709334086 | 0.3177354667043 |
| 36 | 0.72877163503407 | 0.542456729931859 | 0.27122836496593 |
| 37 | 0.76628767240149 | 0.467424655197021 | 0.23371232759851 |
| 38 | 0.764591303730669 | 0.470817392538661 | 0.235408696269331 |
| 39 | 0.69681365599104 | 0.60637268801792 | 0.30318634400896 |
| 40 | 0.680652384299748 | 0.638695231400504 | 0.319347615700252 |
| 41 | 0.626076681461634 | 0.747846637076732 | 0.373923318538366 |
| 42 | 0.564023668803119 | 0.871952662393762 | 0.435976331196881 |
| 43 | 0.605462856697636 | 0.789074286604729 | 0.394537143302364 |
| 44 | 0.502699041546205 | 0.994601916907589 | 0.497300958453795 |
| 45 | 0.397454150839697 | 0.794908301679395 | 0.602545849160303 |
| 46 | 0.432467097874501 | 0.864934195749001 | 0.567532902125499 |
| 47 | 0.368326866003961 | 0.736653732007922 | 0.631673133996039 |
| 48 | 0.288760776184384 | 0.577521552368768 | 0.711239223815616 |
| 49 | 0.171530258182493 | 0.343060516364986 | 0.828469741817507 |
| Meta Analysis of Goldfeld-Quandt test for Heteroskedasticity | |||
| Description | # significant tests | % significant tests | OK/NOK |
| 1% type I error level | 0 | 0 | OK |
| 5% type I error level | 0 | 0 | OK |
| 10% type I error level | 0 | 0 | OK |