| Multiple Linear Regression - Estimated Regression Equation |
| Hout[t] = + 7.80552531269516 + 0.0419371867351989Voedingsmiddelen[t] + 0.00576316213574255Tabaksproducten[t] + 0.237616132974485Textiel[t] + 0.214846586955702Kleding[t] -0.101546014221534Leer[t] + 0.0108259974909677Papier[t] -0.0963187508830879Uitgeverijen[t] + 0.132942721321964Cokes[t] -0.0355382379026382Chemische[t] + 0.508570477084613Rubber[t] + 0.204354591423383Nietmetaalhoudende[t] + e[t] |
| Multiple Linear Regression - Ordinary Least Squares | |||||
| Variable | Parameter | S.D. | T-STAT H0: parameter = 0 | 2-tail p-value | 1-tail p-value |
| (Intercept) | 7.80552531269516 | 23.804613 | 0.3279 | 0.764539 | 0.382269 |
| Voedingsmiddelen | 0.0419371867351989 | 0.310967 | 0.1349 | 0.901262 | 0.450631 |
| Tabaksproducten | 0.00576316213574255 | 0.140743 | 0.0409 | 0.96991 | 0.484955 |
| Textiel | 0.237616132974485 | 0.191176 | 1.2429 | 0.302188 | 0.151094 |
| Kleding | 0.214846586955702 | 0.225723 | 0.9518 | 0.41141 | 0.205705 |
| Leer | -0.101546014221534 | 0.050872 | -1.9961 | 0.13985 | 0.069925 |
| Papier | 0.0108259974909677 | 0.379701 | 0.0285 | 0.979045 | 0.489522 |
| Uitgeverijen | -0.0963187508830879 | 0.165927 | -0.5805 | 0.602316 | 0.301158 |
| Cokes | 0.132942721321964 | 0.162236 | 0.8194 | 0.472576 | 0.236288 |
| Chemische | -0.0355382379026382 | 0.174826 | -0.2033 | 0.851925 | 0.425963 |
| Rubber | 0.508570477084613 | 0.333614 | 1.5244 | 0.224801 | 0.112401 |
| Nietmetaalhoudende | 0.204354591423383 | 0.095757 | 2.1341 | 0.122535 | 0.061267 |
| Multiple Linear Regression - Regression Statistics | |
| Multiple R | 0.996157848456203 |
| R-squared | 0.992330459040892 |
| Adjusted R-squared | 0.964208808857494 |
| F-TEST (value) | 35.2870636171543 |
| F-TEST (DF numerator) | 11 |
| F-TEST (DF denominator) | 3 |
| p-value | 0.00680759162272038 |
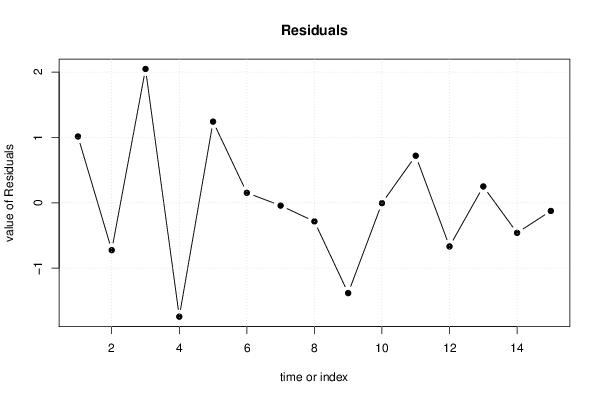
| Multiple Linear Regression - Residual Statistics | |
| Residual Standard Deviation | 2.12817282844198 |
| Sum Squared Residuals | 13.5873587631563 |
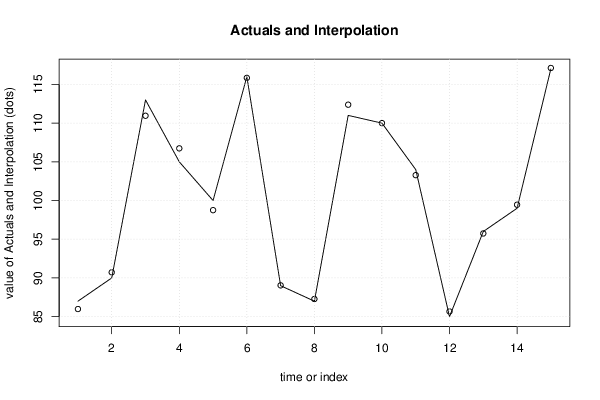
| Multiple Linear Regression - Actuals, Interpolation, and Residuals | |||
| Time or Index | Actuals | Interpolation Forecast | Residuals Prediction Error |
| 1 | 87 | 85.9854134042912 | 1.01458659570884 |
| 2 | 90 | 90.723914329498 | -0.723914329498042 |
| 3 | 113 | 110.952320168542 | 2.04767983145789 |
| 4 | 105 | 106.740978966703 | -1.74097896670266 |
| 5 | 100 | 98.7579306803241 | 1.24206931967594 |
| 6 | 116 | 115.846598945945 | 0.153401054054516 |
| 7 | 89 | 89.0425762930418 | -0.0425762930418064 |
| 8 | 87 | 87.2843040047205 | -0.284304004720519 |
| 9 | 111 | 112.381154309732 | -1.38115430973218 |
| 10 | 110 | 110.004690297173 | -0.00469029717345301 |
| 11 | 104 | 103.279565891493 | 0.720434108507035 |
| 12 | 85 | 85.6676046224807 | -0.667604622480658 |
| 13 | 96 | 95.7498161349977 | 0.2501838650023 |
| 14 | 99 | 99.4589979623769 | -0.458997962376921 |
| 15 | 117 | 117.12413398868 | -0.12413398868027 |