Free Statistics

of Irreproducible Research!

Author's title

Author*The author of this computation has been verified*
R Software Modulerwasp_multipleregression.wasp
Title produced by softwareMultiple Regression
Date of computationFri, 16 Nov 2012 04:02:06 -0500
Cite this page as followsStatistical Computations at FreeStatistics.org, Office for Research Development and Education, URL https://freestatistics.org/blog/index.php?v=date/2012/Nov/16/t1353056997quvjtrxxiyrlubq.htm/, Retrieved Sat, 27 Apr 2024 12:17:10 +0000
Statistical Computations at FreeStatistics.org, Office for Research Development and Education, URL https://freestatistics.org/blog/index.php?pk=189829, Retrieved Sat, 27 Apr 2024 12:17:10 +0000
QR Codes:

Original text written by user:
IsPrivate?No (this computation is public)
User-defined keywords
Estimated Impact108
Family? (F = Feedback message, R = changed R code, M = changed R Module, P = changed Parameters, D = changed Data)
-     [Multiple Regression] [Competence to learn] [2010-11-17 07:43:53] [b98453cac15ba1066b407e146608df68]
- R PD    [Multiple Regression] [WS7: Multiple Reg...] [2012-11-16 09:02:06] [ed5db9d6207bcb51aca69986e23f030b] [Current]
- R  D      [Multiple Regression] [WS7: Multiple reg...] [2012-11-16 09:50:48] [b43eb6e2e60f3928e6b8367ff6c5b484]
Feedback Forum

Post a new message
Dataseries X:
121	66	72	29	141	87	95	83	68	105	102	66
124	59	76	38	136	90	95	85	64	118	104	73
145	78	90	33	140	113	114	102	69	129	124	114
135	70	84	22	109	105	107	86	67	124	118	107
128	65	75	20	109	100	100	84	71	128	109	102
142	88	90	31	128	116	112	93	58	129	129	125
130	75	77	27	162	89	101	64	57	128	105	80
131	62	60	28	147	87	100	81	69	125	100	95
141	85	92	28	148	111	111	100	76	125	125	120
140	82	88	25	103	110	107	96	74	130	116	117
142	83	83	21	102	104	105	93	77	125	112	99
140	78	69	24	100	85	104	102	81	122	97	64
132	81	73	28	117	96	106	78	77	129	107	82
132	75	78	33	139	99	105	92	64	124	114	97
151	91	92	31	122	117	114	99	67	144	130	121


Summary of computational transaction
Raw Inputview raw input (R code)
Raw Outputview raw output of R engine
Computing time7 seconds
R Server'Sir Maurice George Kendall' @ kendall.wessa.net

\begin{tabular}{lllllllll}
\hline
Summary of computational transaction \tabularnewline
Raw Input & view raw input (R code)  \tabularnewline
Raw Output & view raw output of R engine  \tabularnewline
Computing time & 7 seconds \tabularnewline
R Server & 'Sir Maurice George Kendall' @ kendall.wessa.net \tabularnewline
\hline
\end{tabular}
%Source: https://freestatistics.org/blog/index.php?pk=189829&T=0

[TABLE]
[ROW][C]Summary of computational transaction[/C][/ROW]
[ROW][C]Raw Input[/C][C]view raw input (R code) [/C][/ROW]
[ROW][C]Raw Output[/C][C]view raw output of R engine [/C][/ROW]
[ROW][C]Computing time[/C][C]7 seconds[/C][/ROW]
[ROW][C]R Server[/C][C]'Sir Maurice George Kendall' @ kendall.wessa.net[/C][/ROW]
[/TABLE]
Source: https://freestatistics.org/blog/index.php?pk=189829&T=0

Globally Unique Identifier (entire table): ba.freestatistics.org/blog/index.php?pk=189829&T=0

As an alternative you can also use a QR Code:  

The GUIDs for individual cells are displayed in the table below:

Summary of computational transaction
Raw Inputview raw input (R code)
Raw Outputview raw output of R engine
Computing time7 seconds
R Server'Sir Maurice George Kendall' @ kendall.wessa.net


Multiple Linear Regression - Estimated Regression Equation
Hout[t] = + 7.80552531269516 + 0.0419371867351989Voedingsmiddelen[t] + 0.00576316213574255Tabaksproducten[t] + 0.237616132974485Textiel[t] + 0.214846586955702Kleding[t] -0.101546014221534Leer[t] + 0.0108259974909677Papier[t] -0.0963187508830879Uitgeverijen[t] + 0.132942721321964Cokes[t] -0.0355382379026382Chemische[t] + 0.508570477084613Rubber[t] + 0.204354591423383Nietmetaalhoudende[t] + e[t]

\begin{tabular}{lllllllll}
\hline
Multiple Linear Regression - Estimated Regression Equation \tabularnewline
Hout[t] =  +  7.80552531269516 +  0.0419371867351989Voedingsmiddelen[t] +  0.00576316213574255Tabaksproducten[t] +  0.237616132974485Textiel[t] +  0.214846586955702Kleding[t] -0.101546014221534Leer[t] +  0.0108259974909677Papier[t] -0.0963187508830879Uitgeverijen[t] +  0.132942721321964Cokes[t] -0.0355382379026382Chemische[t] +  0.508570477084613Rubber[t] +  0.204354591423383Nietmetaalhoudende[t]  + e[t] \tabularnewline
\hline
\end{tabular}
%Source: https://freestatistics.org/blog/index.php?pk=189829&T=1

[TABLE]
[ROW][C]Multiple Linear Regression - Estimated Regression Equation[/C][/ROW]
[ROW][C]Hout[t] =  +  7.80552531269516 +  0.0419371867351989Voedingsmiddelen[t] +  0.00576316213574255Tabaksproducten[t] +  0.237616132974485Textiel[t] +  0.214846586955702Kleding[t] -0.101546014221534Leer[t] +  0.0108259974909677Papier[t] -0.0963187508830879Uitgeverijen[t] +  0.132942721321964Cokes[t] -0.0355382379026382Chemische[t] +  0.508570477084613Rubber[t] +  0.204354591423383Nietmetaalhoudende[t]  + e[t][/C][/ROW]
[/TABLE]
Source: https://freestatistics.org/blog/index.php?pk=189829&T=1

Globally Unique Identifier (entire table): ba.freestatistics.org/blog/index.php?pk=189829&T=1

As an alternative you can also use a QR Code:  

The GUIDs for individual cells are displayed in the table below:

Multiple Linear Regression - Estimated Regression Equation
Hout[t] = + 7.80552531269516 + 0.0419371867351989Voedingsmiddelen[t] + 0.00576316213574255Tabaksproducten[t] + 0.237616132974485Textiel[t] + 0.214846586955702Kleding[t] -0.101546014221534Leer[t] + 0.0108259974909677Papier[t] -0.0963187508830879Uitgeverijen[t] + 0.132942721321964Cokes[t] -0.0355382379026382Chemische[t] + 0.508570477084613Rubber[t] + 0.204354591423383Nietmetaalhoudende[t] + e[t]


Multiple Linear Regression - Ordinary Least Squares
VariableParameterS.D.T-STATH0: parameter = 02-tail p-value1-tail p-value
(Intercept)7.8055253126951623.8046130.32790.7645390.382269
Voedingsmiddelen0.04193718673519890.3109670.13490.9012620.450631
Tabaksproducten0.005763162135742550.1407430.04090.969910.484955
Textiel0.2376161329744850.1911761.24290.3021880.151094
Kleding0.2148465869557020.2257230.95180.411410.205705
Leer-0.1015460142215340.050872-1.99610.139850.069925
Papier0.01082599749096770.3797010.02850.9790450.489522
Uitgeverijen-0.09631875088308790.165927-0.58050.6023160.301158
Cokes0.1329427213219640.1622360.81940.4725760.236288
Chemische-0.03553823790263820.174826-0.20330.8519250.425963
Rubber0.5085704770846130.3336141.52440.2248010.112401
Nietmetaalhoudende0.2043545914233830.0957572.13410.1225350.061267

\begin{tabular}{lllllllll}
\hline
Multiple Linear Regression - Ordinary Least Squares \tabularnewline
Variable & Parameter & S.D. & T-STATH0: parameter = 0 & 2-tail p-value & 1-tail p-value \tabularnewline
(Intercept) & 7.80552531269516 & 23.804613 & 0.3279 & 0.764539 & 0.382269 \tabularnewline
Voedingsmiddelen & 0.0419371867351989 & 0.310967 & 0.1349 & 0.901262 & 0.450631 \tabularnewline
Tabaksproducten & 0.00576316213574255 & 0.140743 & 0.0409 & 0.96991 & 0.484955 \tabularnewline
Textiel & 0.237616132974485 & 0.191176 & 1.2429 & 0.302188 & 0.151094 \tabularnewline
Kleding & 0.214846586955702 & 0.225723 & 0.9518 & 0.41141 & 0.205705 \tabularnewline
Leer & -0.101546014221534 & 0.050872 & -1.9961 & 0.13985 & 0.069925 \tabularnewline
Papier & 0.0108259974909677 & 0.379701 & 0.0285 & 0.979045 & 0.489522 \tabularnewline
Uitgeverijen & -0.0963187508830879 & 0.165927 & -0.5805 & 0.602316 & 0.301158 \tabularnewline
Cokes & 0.132942721321964 & 0.162236 & 0.8194 & 0.472576 & 0.236288 \tabularnewline
Chemische & -0.0355382379026382 & 0.174826 & -0.2033 & 0.851925 & 0.425963 \tabularnewline
Rubber & 0.508570477084613 & 0.333614 & 1.5244 & 0.224801 & 0.112401 \tabularnewline
Nietmetaalhoudende & 0.204354591423383 & 0.095757 & 2.1341 & 0.122535 & 0.061267 \tabularnewline
\hline
\end{tabular}
%Source: https://freestatistics.org/blog/index.php?pk=189829&T=2

[TABLE]
[ROW][C]Multiple Linear Regression - Ordinary Least Squares[/C][/ROW]
[ROW][C]Variable[/C][C]Parameter[/C][C]S.D.[/C][C]T-STATH0: parameter = 0[/C][C]2-tail p-value[/C][C]1-tail p-value[/C][/ROW]
[ROW][C](Intercept)[/C][C]7.80552531269516[/C][C]23.804613[/C][C]0.3279[/C][C]0.764539[/C][C]0.382269[/C][/ROW]
[ROW][C]Voedingsmiddelen[/C][C]0.0419371867351989[/C][C]0.310967[/C][C]0.1349[/C][C]0.901262[/C][C]0.450631[/C][/ROW]
[ROW][C]Tabaksproducten[/C][C]0.00576316213574255[/C][C]0.140743[/C][C]0.0409[/C][C]0.96991[/C][C]0.484955[/C][/ROW]
[ROW][C]Textiel[/C][C]0.237616132974485[/C][C]0.191176[/C][C]1.2429[/C][C]0.302188[/C][C]0.151094[/C][/ROW]
[ROW][C]Kleding[/C][C]0.214846586955702[/C][C]0.225723[/C][C]0.9518[/C][C]0.41141[/C][C]0.205705[/C][/ROW]
[ROW][C]Leer[/C][C]-0.101546014221534[/C][C]0.050872[/C][C]-1.9961[/C][C]0.13985[/C][C]0.069925[/C][/ROW]
[ROW][C]Papier[/C][C]0.0108259974909677[/C][C]0.379701[/C][C]0.0285[/C][C]0.979045[/C][C]0.489522[/C][/ROW]
[ROW][C]Uitgeverijen[/C][C]-0.0963187508830879[/C][C]0.165927[/C][C]-0.5805[/C][C]0.602316[/C][C]0.301158[/C][/ROW]
[ROW][C]Cokes[/C][C]0.132942721321964[/C][C]0.162236[/C][C]0.8194[/C][C]0.472576[/C][C]0.236288[/C][/ROW]
[ROW][C]Chemische[/C][C]-0.0355382379026382[/C][C]0.174826[/C][C]-0.2033[/C][C]0.851925[/C][C]0.425963[/C][/ROW]
[ROW][C]Rubber[/C][C]0.508570477084613[/C][C]0.333614[/C][C]1.5244[/C][C]0.224801[/C][C]0.112401[/C][/ROW]
[ROW][C]Nietmetaalhoudende[/C][C]0.204354591423383[/C][C]0.095757[/C][C]2.1341[/C][C]0.122535[/C][C]0.061267[/C][/ROW]
[/TABLE]
Source: https://freestatistics.org/blog/index.php?pk=189829&T=2

Globally Unique Identifier (entire table): ba.freestatistics.org/blog/index.php?pk=189829&T=2

As an alternative you can also use a QR Code:  

The GUIDs for individual cells are displayed in the table below:

Multiple Linear Regression - Ordinary Least Squares
VariableParameterS.D.T-STATH0: parameter = 02-tail p-value1-tail p-value
(Intercept)7.8055253126951623.8046130.32790.7645390.382269
Voedingsmiddelen0.04193718673519890.3109670.13490.9012620.450631
Tabaksproducten0.005763162135742550.1407430.04090.969910.484955
Textiel0.2376161329744850.1911761.24290.3021880.151094
Kleding0.2148465869557020.2257230.95180.411410.205705
Leer-0.1015460142215340.050872-1.99610.139850.069925
Papier0.01082599749096770.3797010.02850.9790450.489522
Uitgeverijen-0.09631875088308790.165927-0.58050.6023160.301158
Cokes0.1329427213219640.1622360.81940.4725760.236288
Chemische-0.03553823790263820.174826-0.20330.8519250.425963
Rubber0.5085704770846130.3336141.52440.2248010.112401
Nietmetaalhoudende0.2043545914233830.0957572.13410.1225350.061267


Multiple Linear Regression - Regression Statistics
Multiple R0.996157848456203
R-squared0.992330459040892
Adjusted R-squared0.964208808857494
F-TEST (value)35.2870636171543
F-TEST (DF numerator)11
F-TEST (DF denominator)3
p-value0.00680759162272038
Multiple Linear Regression - Residual Statistics
Residual Standard Deviation2.12817282844198
Sum Squared Residuals13.5873587631563

\begin{tabular}{lllllllll}
\hline
Multiple Linear Regression - Regression Statistics \tabularnewline
Multiple R & 0.996157848456203 \tabularnewline
R-squared & 0.992330459040892 \tabularnewline
Adjusted R-squared & 0.964208808857494 \tabularnewline
F-TEST (value) & 35.2870636171543 \tabularnewline
F-TEST (DF numerator) & 11 \tabularnewline
F-TEST (DF denominator) & 3 \tabularnewline
p-value & 0.00680759162272038 \tabularnewline
Multiple Linear Regression - Residual Statistics \tabularnewline
Residual Standard Deviation & 2.12817282844198 \tabularnewline
Sum Squared Residuals & 13.5873587631563 \tabularnewline
\hline
\end{tabular}
%Source: https://freestatistics.org/blog/index.php?pk=189829&T=3

[TABLE]
[ROW][C]Multiple Linear Regression - Regression Statistics[/C][/ROW]
[ROW][C]Multiple R[/C][C]0.996157848456203[/C][/ROW]
[ROW][C]R-squared[/C][C]0.992330459040892[/C][/ROW]
[ROW][C]Adjusted R-squared[/C][C]0.964208808857494[/C][/ROW]
[ROW][C]F-TEST (value)[/C][C]35.2870636171543[/C][/ROW]
[ROW][C]F-TEST (DF numerator)[/C][C]11[/C][/ROW]
[ROW][C]F-TEST (DF denominator)[/C][C]3[/C][/ROW]
[ROW][C]p-value[/C][C]0.00680759162272038[/C][/ROW]
[ROW][C]Multiple Linear Regression - Residual Statistics[/C][/ROW]
[ROW][C]Residual Standard Deviation[/C][C]2.12817282844198[/C][/ROW]
[ROW][C]Sum Squared Residuals[/C][C]13.5873587631563[/C][/ROW]
[/TABLE]
Source: https://freestatistics.org/blog/index.php?pk=189829&T=3

Globally Unique Identifier (entire table): ba.freestatistics.org/blog/index.php?pk=189829&T=3

As an alternative you can also use a QR Code:  

The GUIDs for individual cells are displayed in the table below:

Multiple Linear Regression - Regression Statistics
Multiple R0.996157848456203
R-squared0.992330459040892
Adjusted R-squared0.964208808857494
F-TEST (value)35.2870636171543
F-TEST (DF numerator)11
F-TEST (DF denominator)3
p-value0.00680759162272038
Multiple Linear Regression - Residual Statistics
Residual Standard Deviation2.12817282844198
Sum Squared Residuals13.5873587631563


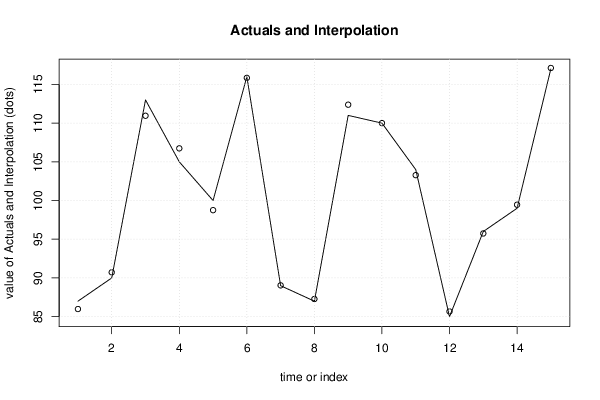
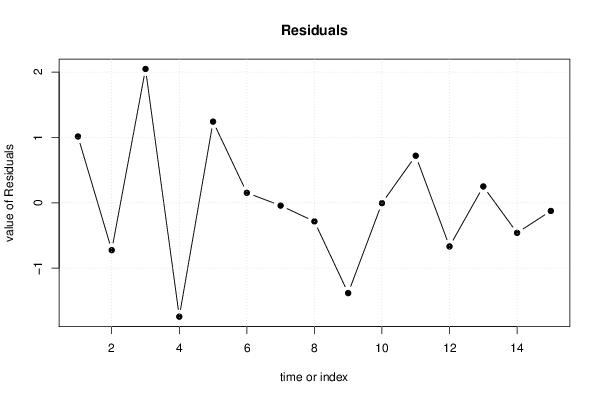
Multiple Linear Regression - Actuals, Interpolation, and Residuals
Time or IndexActualsInterpolationForecastResidualsPrediction Error
18785.98541340429121.01458659570884
29090.723914329498-0.723914329498042
3113110.9523201685422.04767983145789
4105106.740978966703-1.74097896670266
510098.75793068032411.24206931967594
6116115.8465989459450.153401054054516
78989.0425762930418-0.0425762930418064
88787.2843040047205-0.284304004720519
9111112.381154309732-1.38115430973218
10110110.004690297173-0.00469029717345301
11104103.2795658914930.720434108507035
128585.6676046224807-0.667604622480658
139695.74981613499770.2501838650023
149999.4589979623769-0.458997962376921
15117117.12413398868-0.12413398868027

\begin{tabular}{lllllllll}
\hline
Multiple Linear Regression - Actuals, Interpolation, and Residuals \tabularnewline
Time or Index & Actuals & InterpolationForecast & ResidualsPrediction Error \tabularnewline
1 & 87 & 85.9854134042912 & 1.01458659570884 \tabularnewline
2 & 90 & 90.723914329498 & -0.723914329498042 \tabularnewline
3 & 113 & 110.952320168542 & 2.04767983145789 \tabularnewline
4 & 105 & 106.740978966703 & -1.74097896670266 \tabularnewline
5 & 100 & 98.7579306803241 & 1.24206931967594 \tabularnewline
6 & 116 & 115.846598945945 & 0.153401054054516 \tabularnewline
7 & 89 & 89.0425762930418 & -0.0425762930418064 \tabularnewline
8 & 87 & 87.2843040047205 & -0.284304004720519 \tabularnewline
9 & 111 & 112.381154309732 & -1.38115430973218 \tabularnewline
10 & 110 & 110.004690297173 & -0.00469029717345301 \tabularnewline
11 & 104 & 103.279565891493 & 0.720434108507035 \tabularnewline
12 & 85 & 85.6676046224807 & -0.667604622480658 \tabularnewline
13 & 96 & 95.7498161349977 & 0.2501838650023 \tabularnewline
14 & 99 & 99.4589979623769 & -0.458997962376921 \tabularnewline
15 & 117 & 117.12413398868 & -0.12413398868027 \tabularnewline
\hline
\end{tabular}
%Source: https://freestatistics.org/blog/index.php?pk=189829&T=4

[TABLE]
[ROW][C]Multiple Linear Regression - Actuals, Interpolation, and Residuals[/C][/ROW]
[ROW][C]Time or Index[/C][C]Actuals[/C][C]InterpolationForecast[/C][C]ResidualsPrediction Error[/C][/ROW]
[ROW][C]1[/C][C]87[/C][C]85.9854134042912[/C][C]1.01458659570884[/C][/ROW]
[ROW][C]2[/C][C]90[/C][C]90.723914329498[/C][C]-0.723914329498042[/C][/ROW]
[ROW][C]3[/C][C]113[/C][C]110.952320168542[/C][C]2.04767983145789[/C][/ROW]
[ROW][C]4[/C][C]105[/C][C]106.740978966703[/C][C]-1.74097896670266[/C][/ROW]
[ROW][C]5[/C][C]100[/C][C]98.7579306803241[/C][C]1.24206931967594[/C][/ROW]
[ROW][C]6[/C][C]116[/C][C]115.846598945945[/C][C]0.153401054054516[/C][/ROW]
[ROW][C]7[/C][C]89[/C][C]89.0425762930418[/C][C]-0.0425762930418064[/C][/ROW]
[ROW][C]8[/C][C]87[/C][C]87.2843040047205[/C][C]-0.284304004720519[/C][/ROW]
[ROW][C]9[/C][C]111[/C][C]112.381154309732[/C][C]-1.38115430973218[/C][/ROW]
[ROW][C]10[/C][C]110[/C][C]110.004690297173[/C][C]-0.00469029717345301[/C][/ROW]
[ROW][C]11[/C][C]104[/C][C]103.279565891493[/C][C]0.720434108507035[/C][/ROW]
[ROW][C]12[/C][C]85[/C][C]85.6676046224807[/C][C]-0.667604622480658[/C][/ROW]
[ROW][C]13[/C][C]96[/C][C]95.7498161349977[/C][C]0.2501838650023[/C][/ROW]
[ROW][C]14[/C][C]99[/C][C]99.4589979623769[/C][C]-0.458997962376921[/C][/ROW]
[ROW][C]15[/C][C]117[/C][C]117.12413398868[/C][C]-0.12413398868027[/C][/ROW]
[/TABLE]
Source: https://freestatistics.org/blog/index.php?pk=189829&T=4

Globally Unique Identifier (entire table): ba.freestatistics.org/blog/index.php?pk=189829&T=4

As an alternative you can also use a QR Code:  

The GUIDs for individual cells are displayed in the table below:

Multiple Linear Regression - Actuals, Interpolation, and Residuals
Time or IndexActualsInterpolationForecastResidualsPrediction Error
18785.98541340429121.01458659570884
29090.723914329498-0.723914329498042
3113110.9523201685422.04767983145789
4105106.740978966703-1.74097896670266
510098.75793068032411.24206931967594
6116115.8465989459450.153401054054516
78989.0425762930418-0.0425762930418064
88787.2843040047205-0.284304004720519
9111112.381154309732-1.38115430973218
10110110.004690297173-0.00469029717345301
11104103.2795658914930.720434108507035
128585.6676046224807-0.667604622480658
139695.74981613499770.2501838650023
149999.4589979623769-0.458997962376921
15117117.12413398868-0.12413398868027


Parameters (Session):
par1 = 6 ; par2 = Do not include Seasonal Dummies ; par3 = No Linear Trend ;
Parameters (R input):
par1 = 6 ; par2 = Do not include Seasonal Dummies ; par3 = No Linear Trend ;
R code (references can be found in the software module):
library(lattice)
library(lmtest)
n25 <- 25 #minimum number of obs. for Goldfeld-Quandt test
par1 <- as.numeric(par1)
x <- t(y)
k <- length(x[1,])
n <- length(x[,1])
x1 <- cbind(x[,par1], x[,1:k!=par1])
mycolnames <- c(colnames(x)[par1], colnames(x)[1:k!=par1])
colnames(x1) <- mycolnames #colnames(x)[par1]
x <- x1
if (par3 == 'First Differences'){
x2 <- array(0, dim=c(n-1,k), dimnames=list(1:(n-1), paste('(1-B)',colnames(x),sep='')))
for (i in 1:n-1) {
for (j in 1:k) {
x2[i,j] <- x[i+1,j] - x[i,j]
}
}
x <- x2
}
if (par2 == 'Include Monthly Dummies'){
x2 <- array(0, dim=c(n,11), dimnames=list(1:n, paste('M', seq(1:11), sep ='')))
for (i in 1:11){
x2[seq(i,n,12),i] <- 1
}
x <- cbind(x, x2)
}
if (par2 == 'Include Quarterly Dummies'){
x2 <- array(0, dim=c(n,3), dimnames=list(1:n, paste('Q', seq(1:3), sep ='')))
for (i in 1:3){
x2[seq(i,n,4),i] <- 1
}
x <- cbind(x, x2)
}
k <- length(x[1,])
if (par3 == 'Linear Trend'){
x <- cbind(x, c(1:n))
colnames(x)[k+1] <- 't'
}
x
k <- length(x[1,])
df <- as.data.frame(x)
(mylm <- lm(df))
(mysum <- summary(mylm))
if (n > n25) {
kp3 <- k + 3
nmkm3 <- n - k - 3
gqarr <- array(NA, dim=c(nmkm3-kp3+1,3))
numgqtests <- 0
numsignificant1 <- 0
numsignificant5 <- 0
numsignificant10 <- 0
for (mypoint in kp3:nmkm3) {
j <- 0
numgqtests <- numgqtests + 1
for (myalt in c('greater', 'two.sided', 'less')) {
j <- j + 1
gqarr[mypoint-kp3+1,j] <- gqtest(mylm, point=mypoint, alternative=myalt)$p.value
}
if (gqarr[mypoint-kp3+1,2] < 0.01) numsignificant1 <- numsignificant1 + 1
if (gqarr[mypoint-kp3+1,2] < 0.05) numsignificant5 <- numsignificant5 + 1
if (gqarr[mypoint-kp3+1,2] < 0.10) numsignificant10 <- numsignificant10 + 1
}
gqarr
}
bitmap(file='test0.png')
plot(x[,1], type='l', main='Actuals and Interpolation', ylab='value of Actuals and Interpolation (dots)', xlab='time or index')
points(x[,1]-mysum$resid)
grid()
dev.off()
bitmap(file='test1.png')
plot(mysum$resid, type='b', pch=19, main='Residuals', ylab='value of Residuals', xlab='time or index')
grid()
dev.off()
bitmap(file='test2.png')
hist(mysum$resid, main='Residual Histogram', xlab='values of Residuals')
grid()
dev.off()
bitmap(file='test3.png')
densityplot(~mysum$resid,col='black',main='Residual Density Plot', xlab='values of Residuals')
dev.off()
bitmap(file='test4.png')
qqnorm(mysum$resid, main='Residual Normal Q-Q Plot')
qqline(mysum$resid)
grid()
dev.off()
(myerror <- as.ts(mysum$resid))
bitmap(file='test5.png')
dum <- cbind(lag(myerror,k=1),myerror)
dum
dum1 <- dum[2:length(myerror),]
dum1
z <- as.data.frame(dum1)
z
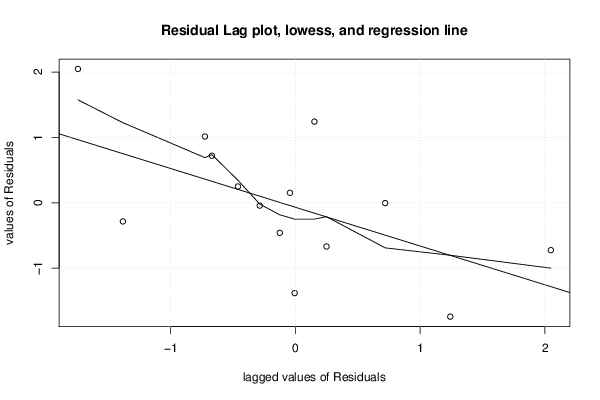
plot(z,main=paste('Residual Lag plot, lowess, and regression line'), ylab='values of Residuals', xlab='lagged values of Residuals')
lines(lowess(z))
abline(lm(z))
grid()
dev.off()
bitmap(file='test6.png')
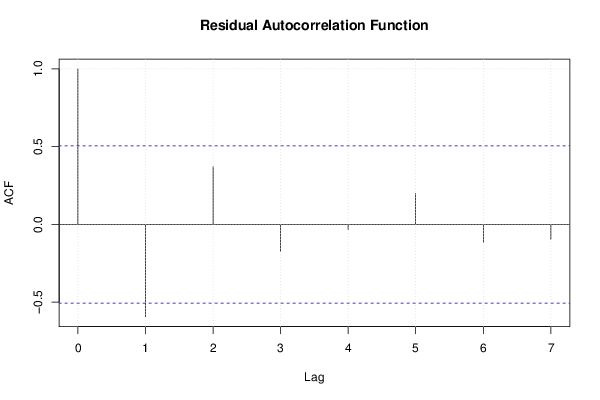
acf(mysum$resid, lag.max=length(mysum$resid)/2, main='Residual Autocorrelation Function')
grid()
dev.off()
bitmap(file='test7.png')
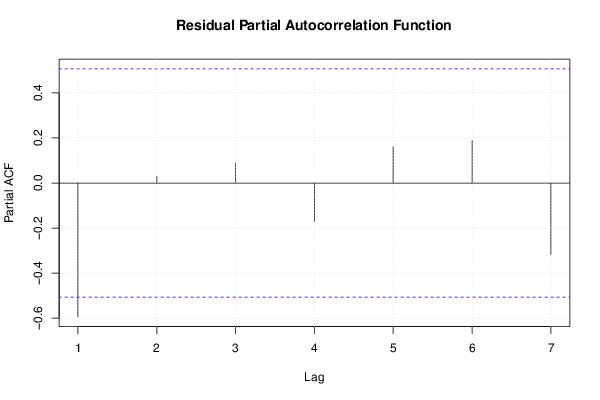
pacf(mysum$resid, lag.max=length(mysum$resid)/2, main='Residual Partial Autocorrelation Function')
grid()
dev.off()
bitmap(file='test8.png')
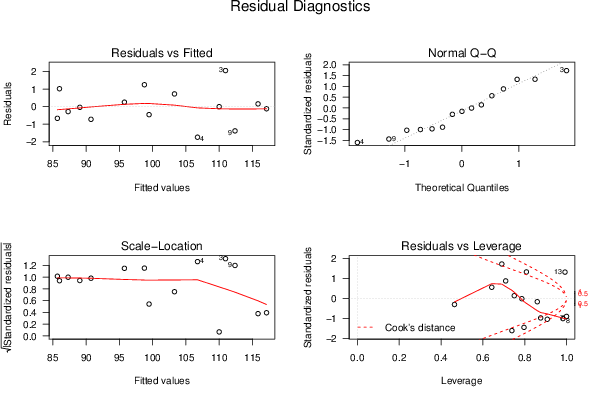
opar <- par(mfrow = c(2,2), oma = c(0, 0, 1.1, 0))
plot(mylm, las = 1, sub='Residual Diagnostics')
par(opar)
dev.off()
if (n > n25) {
bitmap(file='test9.png')
plot(kp3:nmkm3,gqarr[,2], main='Goldfeld-Quandt test',ylab='2-sided p-value',xlab='breakpoint')
grid()
dev.off()
}
load(file='createtable')
a<-table.start()
a<-table.row.start(a)
a<-table.element(a, 'Multiple Linear Regression - Estimated Regression Equation', 1, TRUE)
a<-table.row.end(a)
myeq <- colnames(x)[1]
myeq <- paste(myeq, '[t] = ', sep='')
for (i in 1:k){
if (mysum$coefficients[i,1] > 0) myeq <- paste(myeq, '+', '')
myeq <- paste(myeq, mysum$coefficients[i,1], sep=' ')
if (rownames(mysum$coefficients)[i] != '(Intercept)') {
myeq <- paste(myeq, rownames(mysum$coefficients)[i], sep='')
if (rownames(mysum$coefficients)[i] != 't') myeq <- paste(myeq, '[t]', sep='')
}
}
myeq <- paste(myeq, ' + e[t]')
a<-table.row.start(a)
a<-table.element(a, myeq)
a<-table.row.end(a)
a<-table.end(a)
table.save(a,file='mytable1.tab')
a<-table.start()
a<-table.row.start(a)
a<-table.element(a,hyperlink('ols1.htm','Multiple Linear Regression - Ordinary Least Squares',''), 6, TRUE)
a<-table.row.end(a)
a<-table.row.start(a)
a<-table.element(a,'Variable',header=TRUE)
a<-table.element(a,'Parameter',header=TRUE)
a<-table.element(a,'S.D.',header=TRUE)
a<-table.element(a,'T-STAT
H0: parameter = 0',header=TRUE)
a<-table.element(a,'2-tail p-value',header=TRUE)
a<-table.element(a,'1-tail p-value',header=TRUE)
a<-table.row.end(a)
for (i in 1:k){
a<-table.row.start(a)
a<-table.element(a,rownames(mysum$coefficients)[i],header=TRUE)
a<-table.element(a,mysum$coefficients[i,1])
a<-table.element(a, round(mysum$coefficients[i,2],6))
a<-table.element(a, round(mysum$coefficients[i,3],4))
a<-table.element(a, round(mysum$coefficients[i,4],6))
a<-table.element(a, round(mysum$coefficients[i,4]/2,6))
a<-table.row.end(a)
}
a<-table.end(a)
table.save(a,file='mytable2.tab')
a<-table.start()
a<-table.row.start(a)
a<-table.element(a, 'Multiple Linear Regression - Regression Statistics', 2, TRUE)
a<-table.row.end(a)
a<-table.row.start(a)
a<-table.element(a, 'Multiple R',1,TRUE)
a<-table.element(a, sqrt(mysum$r.squared))
a<-table.row.end(a)
a<-table.row.start(a)
a<-table.element(a, 'R-squared',1,TRUE)
a<-table.element(a, mysum$r.squared)
a<-table.row.end(a)
a<-table.row.start(a)
a<-table.element(a, 'Adjusted R-squared',1,TRUE)
a<-table.element(a, mysum$adj.r.squared)
a<-table.row.end(a)
a<-table.row.start(a)
a<-table.element(a, 'F-TEST (value)',1,TRUE)
a<-table.element(a, mysum$fstatistic[1])
a<-table.row.end(a)
a<-table.row.start(a)
a<-table.element(a, 'F-TEST (DF numerator)',1,TRUE)
a<-table.element(a, mysum$fstatistic[2])
a<-table.row.end(a)
a<-table.row.start(a)
a<-table.element(a, 'F-TEST (DF denominator)',1,TRUE)
a<-table.element(a, mysum$fstatistic[3])
a<-table.row.end(a)
a<-table.row.start(a)
a<-table.element(a, 'p-value',1,TRUE)
a<-table.element(a, 1-pf(mysum$fstatistic[1],mysum$fstatistic[2],mysum$fstatistic[3]))
a<-table.row.end(a)
a<-table.row.start(a)
a<-table.element(a, 'Multiple Linear Regression - Residual Statistics', 2, TRUE)
a<-table.row.end(a)
a<-table.row.start(a)
a<-table.element(a, 'Residual Standard Deviation',1,TRUE)
a<-table.element(a, mysum$sigma)
a<-table.row.end(a)
a<-table.row.start(a)
a<-table.element(a, 'Sum Squared Residuals',1,TRUE)
a<-table.element(a, sum(myerror*myerror))
a<-table.row.end(a)
a<-table.end(a)
table.save(a,file='mytable3.tab')
a<-table.start()
a<-table.row.start(a)
a<-table.element(a, 'Multiple Linear Regression - Actuals, Interpolation, and Residuals', 4, TRUE)
a<-table.row.end(a)
a<-table.row.start(a)
a<-table.element(a, 'Time or Index', 1, TRUE)
a<-table.element(a, 'Actuals', 1, TRUE)
a<-table.element(a, 'Interpolation
Forecast', 1, TRUE)
a<-table.element(a, 'Residuals
Prediction Error', 1, TRUE)
a<-table.row.end(a)
for (i in 1:n) {
a<-table.row.start(a)
a<-table.element(a,i, 1, TRUE)
a<-table.element(a,x[i])
a<-table.element(a,x[i]-mysum$resid[i])
a<-table.element(a,mysum$resid[i])
a<-table.row.end(a)
}
a<-table.end(a)
table.save(a,file='mytable4.tab')
if (n > n25) {
a<-table.start()
a<-table.row.start(a)
a<-table.element(a,'Goldfeld-Quandt test for Heteroskedasticity',4,TRUE)
a<-table.row.end(a)
a<-table.row.start(a)
a<-table.element(a,'p-values',header=TRUE)
a<-table.element(a,'Alternative Hypothesis',3,header=TRUE)
a<-table.row.end(a)
a<-table.row.start(a)
a<-table.element(a,'breakpoint index',header=TRUE)
a<-table.element(a,'greater',header=TRUE)
a<-table.element(a,'2-sided',header=TRUE)
a<-table.element(a,'less',header=TRUE)
a<-table.row.end(a)
for (mypoint in kp3:nmkm3) {
a<-table.row.start(a)
a<-table.element(a,mypoint,header=TRUE)
a<-table.element(a,gqarr[mypoint-kp3+1,1])
a<-table.element(a,gqarr[mypoint-kp3+1,2])
a<-table.element(a,gqarr[mypoint-kp3+1,3])
a<-table.row.end(a)
}
a<-table.end(a)
table.save(a,file='mytable5.tab')
a<-table.start()
a<-table.row.start(a)
a<-table.element(a,'Meta Analysis of Goldfeld-Quandt test for Heteroskedasticity',4,TRUE)
a<-table.row.end(a)
a<-table.row.start(a)
a<-table.element(a,'Description',header=TRUE)
a<-table.element(a,'# significant tests',header=TRUE)
a<-table.element(a,'% significant tests',header=TRUE)
a<-table.element(a,'OK/NOK',header=TRUE)
a<-table.row.end(a)
a<-table.row.start(a)
a<-table.element(a,'1% type I error level',header=TRUE)
a<-table.element(a,numsignificant1)
a<-table.element(a,numsignificant1/numgqtests)
if (numsignificant1/numgqtests < 0.01) dum <- 'OK' else dum <- 'NOK'
a<-table.element(a,dum)
a<-table.row.end(a)
a<-table.row.start(a)
a<-table.element(a,'5% type I error level',header=TRUE)
a<-table.element(a,numsignificant5)
a<-table.element(a,numsignificant5/numgqtests)
if (numsignificant5/numgqtests < 0.05) dum <- 'OK' else dum <- 'NOK'
a<-table.element(a,dum)
a<-table.row.end(a)
a<-table.row.start(a)
a<-table.element(a,'10% type I error level',header=TRUE)
a<-table.element(a,numsignificant10)
a<-table.element(a,numsignificant10/numgqtests)
if (numsignificant10/numgqtests < 0.1) dum <- 'OK' else dum <- 'NOK'
a<-table.element(a,dum)
a<-table.row.end(a)
a<-table.end(a)
table.save(a,file='mytable6.tab')
}