| Tabulation of Results | ||||
| Separate x Happiness | ||||
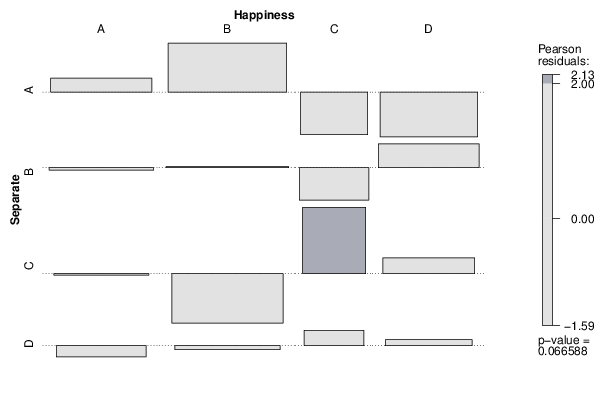
| A | B | C | D | A | 13 | 22 | 2 | 6 | B | 12 | 17 | 3 | 14 | C | 10 | 8 | 9 | 11 | D | 8 | 12 | 5 | 9 |
| Tabulation of Expected Results | ||||
| Separate x Happiness | ||||
| A | B | C | D | A | 11.48 | 15.76 | 5.07 | 10.68 | B | 12.29 | 16.86 | 5.43 | 11.43 | C | 10.15 | 13.93 | 4.48 | 9.44 | D | 9.08 | 12.46 | 4.01 | 8.45 |
| Statistical Results | |
| Pearson's Chi-squared test with simulated p-value (based on 2000 replicates) | |
| Exact Pearson Chi Square Statistic | 16.01 |
| P value | 0.06 |