| Tabulation of Results | ||||
| Connected x Happiness | ||||
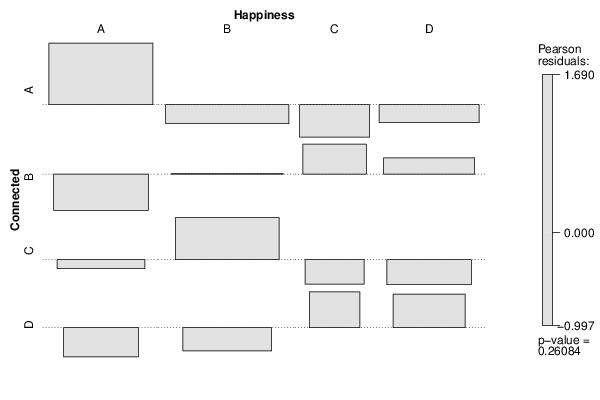
| A | B | C | D | A | 20 | 17 | 4 | 11 | B | 8 | 16 | 7 | 12 | C | 9 | 18 | 3 | 7 | D | 5 | 8 | 5 | 9 |
| Tabulation of Expected Results | ||||
| Connected x Happiness | ||||
| A | B | C | D | A | 13.74 | 19.3 | 6.21 | 12.75 | B | 11.36 | 15.96 | 5.14 | 10.55 | C | 9.77 | 13.73 | 4.42 | 9.08 | D | 7.13 | 10.02 | 3.23 | 6.62 |
| Statistical Results | |
| Pearson's Chi-squared test with simulated p-value (based on 2000 replicates) | |
| Exact Pearson Chi Square Statistic | 11.22 |
| P value | 0.28 |