Free Statistics

of Irreproducible Research!

Author's title

Author*The author of this computation has been verified*
R Software Modulerwasp_centraltendency.wasp
Title produced by softwareCentral Tendency
Date of computationMon, 12 Nov 2012 11:16:24 -0500
Cite this page as followsStatistical Computations at FreeStatistics.org, Office for Research Development and Education, URL https://freestatistics.org/blog/index.php?v=date/2012/Nov/12/t13527370085xj0qurg1css0uk.htm/, Retrieved Mon, 29 Apr 2024 00:33:07 +0000
Statistical Computations at FreeStatistics.org, Office for Research Development and Education, URL https://freestatistics.org/blog/index.php?pk=188104, Retrieved Mon, 29 Apr 2024 00:33:07 +0000
QR Codes:

Original text written by user:
IsPrivate?No (this computation is public)
User-defined keywords
Estimated Impact75
Family? (F = Feedback message, R = changed R code, M = changed R Module, P = changed Parameters, D = changed Data)
-     [Univariate Data Series] [web server] [2010-10-19 15:51:23] [b98453cac15ba1066b407e146608df68]
- RMPD  [Histogram] [histogram time an...] [2012-11-12 16:12:40] [dbdfdab7c884aa7a69290945f2923e51]
- RMP       [Central Tendency] [central tendencit...] [2012-11-12 16:16:24] [239167cccea8953a8e1721fd6db07280] [Current]
Feedback Forum

Post a new message
Dataseries X:
99
85
92
89
89
90
96
100
96
94
92
91
90
95
99
93
90
90
90
90
97
100
94
91
90
89
89
95
100
93
95
91
91
90
95
100
93
86
71
70
70
75
78
73
72
71
71
70
75
78
73
72
71
70
70
75
78
73
71
71
71
71
77
79
74
72
72
72
74
77
79
75
73
72
71
72
76
78
73
72
72
71
71
77
79
74
72
72
71


Summary of computational transaction
Raw Inputview raw input (R code)
Raw Outputview raw output of R engine
Computing time2 seconds
R Server'Gertrude Mary Cox' @ cox.wessa.net

\begin{tabular}{lllllllll}
\hline
Summary of computational transaction \tabularnewline
Raw Input & view raw input (R code)  \tabularnewline
Raw Output & view raw output of R engine  \tabularnewline
Computing time & 2 seconds \tabularnewline
R Server & 'Gertrude Mary Cox' @ cox.wessa.net \tabularnewline
\hline
\end{tabular}
%Source: https://freestatistics.org/blog/index.php?pk=188104&T=0

[TABLE]
[ROW][C]Summary of computational transaction[/C][/ROW]
[ROW][C]Raw Input[/C][C]view raw input (R code) [/C][/ROW]
[ROW][C]Raw Output[/C][C]view raw output of R engine [/C][/ROW]
[ROW][C]Computing time[/C][C]2 seconds[/C][/ROW]
[ROW][C]R Server[/C][C]'Gertrude Mary Cox' @ cox.wessa.net[/C][/ROW]
[/TABLE]
Source: https://freestatistics.org/blog/index.php?pk=188104&T=0

Globally Unique Identifier (entire table): ba.freestatistics.org/blog/index.php?pk=188104&T=0

As an alternative you can also use a QR Code:  

The GUIDs for individual cells are displayed in the table below:

Summary of computational transaction
Raw Inputview raw input (R code)
Raw Outputview raw output of R engine
Computing time2 seconds
R Server'Gertrude Mary Cox' @ cox.wessa.net


Central Tendency - Ungrouped Data
MeasureValueS.E.Value/S.E.
Arithmetic Mean81.64044943820231.0914805183387374.7978988781786
Geometric Mean81.0136716584687
Harmonic Mean80.4070455105701
Quadratic Mean82.2800097228968
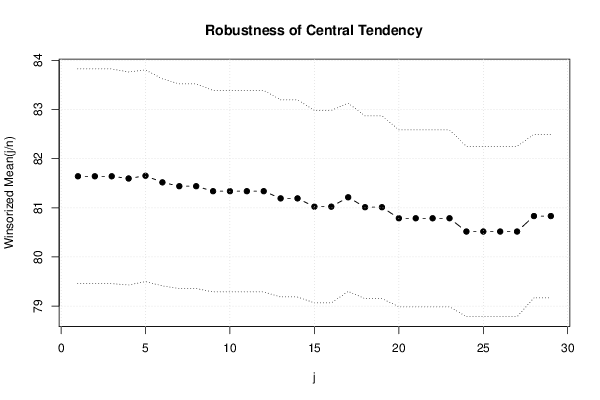
Winsorized Mean ( 1 / 29 )81.64044943820231.0914805183387374.7978988781786
Winsorized Mean ( 2 / 29 )81.64044943820231.0914805183387374.7978988781786
Winsorized Mean ( 3 / 29 )81.64044943820231.0914805183387374.7978988781786
Winsorized Mean ( 4 / 29 )81.59550561797751.0830808473237575.3364864863015
Winsorized Mean ( 5 / 29 )81.65168539325841.0765042357844175.8489216103844
Winsorized Mean ( 6 / 29 )81.51685393258431.052880716779877.4226867616124
Winsorized Mean ( 7 / 29 )81.4382022471911.0400502679201478.3021789995289
Winsorized Mean ( 8 / 29 )81.4382022471911.0400502679201478.3021789995289
Winsorized Mean ( 9 / 29 )81.33707865168541.0243391227830479.4044441363324
Winsorized Mean ( 10 / 29 )81.33707865168541.0243391227830479.4044441363324
Winsorized Mean ( 11 / 29 )81.33707865168541.0243391227830479.4044441363324
Winsorized Mean ( 12 / 29 )81.33707865168541.0243391227830479.4044441363324
Winsorized Mean ( 13 / 29 )81.19101123595511.0026619835426480.9754559049778
Winsorized Mean ( 14 / 29 )81.19101123595511.0026619835426480.9754559049778
Winsorized Mean ( 15 / 29 )81.02247191011240.97870293248441782.785561604928
Winsorized Mean ( 16 / 29 )81.02247191011240.97870293248441782.785561604928
Winsorized Mean ( 17 / 29 )81.21348314606740.95713437295599384.8506598872314
Winsorized Mean ( 18 / 29 )81.01123595505620.929388299002387.1661888169045
Winsorized Mean ( 19 / 29 )81.01123595505620.929388299002387.1661888169045
Winsorized Mean ( 20 / 29 )80.78651685393260.89978886272006489.7838595264613
Winsorized Mean ( 21 / 29 )80.78651685393260.89978886272006489.7838595264613
Winsorized Mean ( 22 / 29 )80.78651685393260.89978886272006489.7838595264613
Winsorized Mean ( 23 / 29 )80.78651685393260.89978886272006489.7838595264613
Winsorized Mean ( 24 / 29 )80.51685393258430.8655995636458693.0185934861745
Winsorized Mean ( 25 / 29 )80.51685393258430.8655995636458693.0185934861745
Winsorized Mean ( 26 / 29 )80.51685393258430.8655995636458693.0185934861745
Winsorized Mean ( 27 / 29 )80.51685393258430.8655995636458693.0185934861745
Winsorized Mean ( 28 / 29 )80.83146067415730.83115349210617697.2521458934464
Winsorized Mean ( 29 / 29 )80.83146067415730.83115349210617697.2521458934464
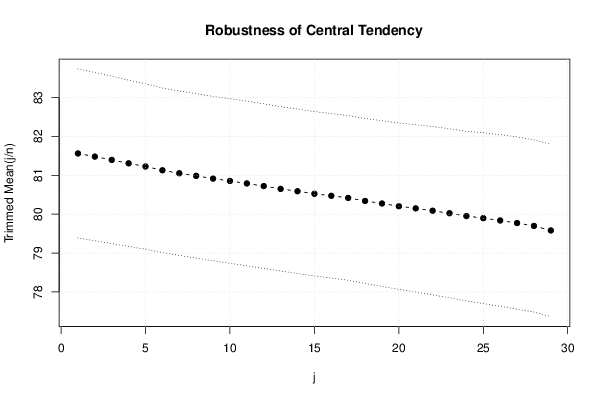
Trimmed Mean ( 1 / 29 )81.56321839080461.0880386761351474.9635285765097
Trimmed Mean ( 2 / 29 )81.48235294117651.0835686145762375.1981479022843
Trimmed Mean ( 3 / 29 )81.39759036144581.0779138435877475.5140040603996
Trimmed Mean ( 4 / 29 )81.30864197530861.0708889199160575.9263080074474
Trimmed Mean ( 5 / 29 )81.22784810126581.0650612767514976.2658918076681
Trimmed Mean ( 6 / 29 )81.12987012987011.0594674001718476.5760891903906
Trimmed Mean ( 7 / 29 )81.05333333333331.0581120929283476.6018400838958
Trimmed Mean ( 8 / 29 )80.9863013698631.0585042199585576.5101355694492
Trimmed Mean ( 9 / 29 )80.91549295774651.0580241405759876.4779269721545
Trimmed Mean ( 10 / 29 )80.85507246376811.0594589497099776.3173245040802
Trimmed Mean ( 11 / 29 )80.79104477611941.0600549795511276.2140137394861
Trimmed Mean ( 12 / 29 )80.72307692307691.0596415604752376.1796063254387
Trimmed Mean ( 13 / 29 )80.65079365079361.0580098820311476.2287716027402
Trimmed Mean ( 14 / 29 )80.59016393442621.058501118109276.1361160188326
Trimmed Mean ( 15 / 29 )80.52542372881361.0577580506105576.1283959808513
Trimmed Mean ( 16 / 29 )80.47368421052631.0593613196107475.9643407030346
Trimmed Mean ( 17 / 29 )80.41818181818181.0597283525536275.8856565688736
Trimmed Mean ( 18 / 29 )80.33962264150941.0615811646335975.6792088236036
Trimmed Mean ( 19 / 29 )80.27450980392161.0664503817631675.2726157509589
Trimmed Mean ( 20 / 29 )80.20408163265311.0702293256050274.941024053244
Trimmed Mean ( 21 / 29 )80.14893617021281.0774703661020974.3862093025941
Trimmed Mean ( 22 / 29 )80.08888888888891.0837748388085873.8980884414445
Trimmed Mean ( 23 / 29 )80.02325581395351.0887974672998173.4969158335841
Trimmed Mean ( 24 / 29 )79.95121951219511.0920730005038673.2105083408409
Trimmed Mean ( 25 / 29 )79.89743589743591.0994998690024572.6670717750291
Trimmed Mean ( 26 / 29 )79.83783783783781.1052111843590472.2376311131339
Trimmed Mean ( 27 / 29 )79.77142857142861.1084743958226971.9650619554668
Trimmed Mean ( 28 / 29 )79.69696969696971.1082377907824171.9132395229946
Trimmed Mean ( 29 / 29 )79.58064516129031.10985244931271.7038064029345
Median78
Midrange85
Midmean - Weighted Average at Xnp79.7307692307692
Midmean - Weighted Average at X(n+1)p79.7307692307692
Midmean - Empirical Distribution Function79.7307692307692
Midmean - Empirical Distribution Function - Averaging79.7307692307692
Midmean - Empirical Distribution Function - Interpolation79.7307692307692
Midmean - Closest Observation79.7307692307692
Midmean - True Basic - Statistics Graphics Toolkit79.7307692307692
Midmean - MS Excel (old versions)79.7307692307692
Number of observations89

\begin{tabular}{lllllllll}
\hline
Central Tendency - Ungrouped Data \tabularnewline
Measure & Value & S.E. & Value/S.E. \tabularnewline
Arithmetic Mean & 81.6404494382023 & 1.09148051833873 & 74.7978988781786 \tabularnewline
Geometric Mean & 81.0136716584687 &  &  \tabularnewline
Harmonic Mean & 80.4070455105701 &  &  \tabularnewline
Quadratic Mean & 82.2800097228968 &  &  \tabularnewline
Winsorized Mean ( 1 / 29 ) & 81.6404494382023 & 1.09148051833873 & 74.7978988781786 \tabularnewline
Winsorized Mean ( 2 / 29 ) & 81.6404494382023 & 1.09148051833873 & 74.7978988781786 \tabularnewline
Winsorized Mean ( 3 / 29 ) & 81.6404494382023 & 1.09148051833873 & 74.7978988781786 \tabularnewline
Winsorized Mean ( 4 / 29 ) & 81.5955056179775 & 1.08308084732375 & 75.3364864863015 \tabularnewline
Winsorized Mean ( 5 / 29 ) & 81.6516853932584 & 1.07650423578441 & 75.8489216103844 \tabularnewline
Winsorized Mean ( 6 / 29 ) & 81.5168539325843 & 1.0528807167798 & 77.4226867616124 \tabularnewline
Winsorized Mean ( 7 / 29 ) & 81.438202247191 & 1.04005026792014 & 78.3021789995289 \tabularnewline
Winsorized Mean ( 8 / 29 ) & 81.438202247191 & 1.04005026792014 & 78.3021789995289 \tabularnewline
Winsorized Mean ( 9 / 29 ) & 81.3370786516854 & 1.02433912278304 & 79.4044441363324 \tabularnewline
Winsorized Mean ( 10 / 29 ) & 81.3370786516854 & 1.02433912278304 & 79.4044441363324 \tabularnewline
Winsorized Mean ( 11 / 29 ) & 81.3370786516854 & 1.02433912278304 & 79.4044441363324 \tabularnewline
Winsorized Mean ( 12 / 29 ) & 81.3370786516854 & 1.02433912278304 & 79.4044441363324 \tabularnewline
Winsorized Mean ( 13 / 29 ) & 81.1910112359551 & 1.00266198354264 & 80.9754559049778 \tabularnewline
Winsorized Mean ( 14 / 29 ) & 81.1910112359551 & 1.00266198354264 & 80.9754559049778 \tabularnewline
Winsorized Mean ( 15 / 29 ) & 81.0224719101124 & 0.978702932484417 & 82.785561604928 \tabularnewline
Winsorized Mean ( 16 / 29 ) & 81.0224719101124 & 0.978702932484417 & 82.785561604928 \tabularnewline
Winsorized Mean ( 17 / 29 ) & 81.2134831460674 & 0.957134372955993 & 84.8506598872314 \tabularnewline
Winsorized Mean ( 18 / 29 ) & 81.0112359550562 & 0.9293882990023 & 87.1661888169045 \tabularnewline
Winsorized Mean ( 19 / 29 ) & 81.0112359550562 & 0.9293882990023 & 87.1661888169045 \tabularnewline
Winsorized Mean ( 20 / 29 ) & 80.7865168539326 & 0.899788862720064 & 89.7838595264613 \tabularnewline
Winsorized Mean ( 21 / 29 ) & 80.7865168539326 & 0.899788862720064 & 89.7838595264613 \tabularnewline
Winsorized Mean ( 22 / 29 ) & 80.7865168539326 & 0.899788862720064 & 89.7838595264613 \tabularnewline
Winsorized Mean ( 23 / 29 ) & 80.7865168539326 & 0.899788862720064 & 89.7838595264613 \tabularnewline
Winsorized Mean ( 24 / 29 ) & 80.5168539325843 & 0.86559956364586 & 93.0185934861745 \tabularnewline
Winsorized Mean ( 25 / 29 ) & 80.5168539325843 & 0.86559956364586 & 93.0185934861745 \tabularnewline
Winsorized Mean ( 26 / 29 ) & 80.5168539325843 & 0.86559956364586 & 93.0185934861745 \tabularnewline
Winsorized Mean ( 27 / 29 ) & 80.5168539325843 & 0.86559956364586 & 93.0185934861745 \tabularnewline
Winsorized Mean ( 28 / 29 ) & 80.8314606741573 & 0.831153492106176 & 97.2521458934464 \tabularnewline
Winsorized Mean ( 29 / 29 ) & 80.8314606741573 & 0.831153492106176 & 97.2521458934464 \tabularnewline
Trimmed Mean ( 1 / 29 ) & 81.5632183908046 & 1.08803867613514 & 74.9635285765097 \tabularnewline
Trimmed Mean ( 2 / 29 ) & 81.4823529411765 & 1.08356861457623 & 75.1981479022843 \tabularnewline
Trimmed Mean ( 3 / 29 ) & 81.3975903614458 & 1.07791384358774 & 75.5140040603996 \tabularnewline
Trimmed Mean ( 4 / 29 ) & 81.3086419753086 & 1.07088891991605 & 75.9263080074474 \tabularnewline
Trimmed Mean ( 5 / 29 ) & 81.2278481012658 & 1.06506127675149 & 76.2658918076681 \tabularnewline
Trimmed Mean ( 6 / 29 ) & 81.1298701298701 & 1.05946740017184 & 76.5760891903906 \tabularnewline
Trimmed Mean ( 7 / 29 ) & 81.0533333333333 & 1.05811209292834 & 76.6018400838958 \tabularnewline
Trimmed Mean ( 8 / 29 ) & 80.986301369863 & 1.05850421995855 & 76.5101355694492 \tabularnewline
Trimmed Mean ( 9 / 29 ) & 80.9154929577465 & 1.05802414057598 & 76.4779269721545 \tabularnewline
Trimmed Mean ( 10 / 29 ) & 80.8550724637681 & 1.05945894970997 & 76.3173245040802 \tabularnewline
Trimmed Mean ( 11 / 29 ) & 80.7910447761194 & 1.06005497955112 & 76.2140137394861 \tabularnewline
Trimmed Mean ( 12 / 29 ) & 80.7230769230769 & 1.05964156047523 & 76.1796063254387 \tabularnewline
Trimmed Mean ( 13 / 29 ) & 80.6507936507936 & 1.05800988203114 & 76.2287716027402 \tabularnewline
Trimmed Mean ( 14 / 29 ) & 80.5901639344262 & 1.0585011181092 & 76.1361160188326 \tabularnewline
Trimmed Mean ( 15 / 29 ) & 80.5254237288136 & 1.05775805061055 & 76.1283959808513 \tabularnewline
Trimmed Mean ( 16 / 29 ) & 80.4736842105263 & 1.05936131961074 & 75.9643407030346 \tabularnewline
Trimmed Mean ( 17 / 29 ) & 80.4181818181818 & 1.05972835255362 & 75.8856565688736 \tabularnewline
Trimmed Mean ( 18 / 29 ) & 80.3396226415094 & 1.06158116463359 & 75.6792088236036 \tabularnewline
Trimmed Mean ( 19 / 29 ) & 80.2745098039216 & 1.06645038176316 & 75.2726157509589 \tabularnewline
Trimmed Mean ( 20 / 29 ) & 80.2040816326531 & 1.07022932560502 & 74.941024053244 \tabularnewline
Trimmed Mean ( 21 / 29 ) & 80.1489361702128 & 1.07747036610209 & 74.3862093025941 \tabularnewline
Trimmed Mean ( 22 / 29 ) & 80.0888888888889 & 1.08377483880858 & 73.8980884414445 \tabularnewline
Trimmed Mean ( 23 / 29 ) & 80.0232558139535 & 1.08879746729981 & 73.4969158335841 \tabularnewline
Trimmed Mean ( 24 / 29 ) & 79.9512195121951 & 1.09207300050386 & 73.2105083408409 \tabularnewline
Trimmed Mean ( 25 / 29 ) & 79.8974358974359 & 1.09949986900245 & 72.6670717750291 \tabularnewline
Trimmed Mean ( 26 / 29 ) & 79.8378378378378 & 1.10521118435904 & 72.2376311131339 \tabularnewline
Trimmed Mean ( 27 / 29 ) & 79.7714285714286 & 1.10847439582269 & 71.9650619554668 \tabularnewline
Trimmed Mean ( 28 / 29 ) & 79.6969696969697 & 1.10823779078241 & 71.9132395229946 \tabularnewline
Trimmed Mean ( 29 / 29 ) & 79.5806451612903 & 1.109852449312 & 71.7038064029345 \tabularnewline
Median & 78 &  &  \tabularnewline
Midrange & 85 &  &  \tabularnewline
Midmean - Weighted Average at Xnp & 79.7307692307692 &  &  \tabularnewline
Midmean - Weighted Average at X(n+1)p & 79.7307692307692 &  &  \tabularnewline
Midmean - Empirical Distribution Function & 79.7307692307692 &  &  \tabularnewline
Midmean - Empirical Distribution Function - Averaging & 79.7307692307692 &  &  \tabularnewline
Midmean - Empirical Distribution Function - Interpolation & 79.7307692307692 &  &  \tabularnewline
Midmean - Closest Observation & 79.7307692307692 &  &  \tabularnewline
Midmean - True Basic - Statistics Graphics Toolkit & 79.7307692307692 &  &  \tabularnewline
Midmean - MS Excel (old versions) & 79.7307692307692 &  &  \tabularnewline
Number of observations & 89 &  &  \tabularnewline
\hline
\end{tabular}
%Source: https://freestatistics.org/blog/index.php?pk=188104&T=1

[TABLE]
[ROW][C]Central Tendency - Ungrouped Data[/C][/ROW]
[ROW][C]Measure[/C][C]Value[/C][C]S.E.[/C][C]Value/S.E.[/C][/ROW]
[ROW][C]Arithmetic Mean[/C][C]81.6404494382023[/C][C]1.09148051833873[/C][C]74.7978988781786[/C][/ROW]
[ROW][C]Geometric Mean[/C][C]81.0136716584687[/C][C][/C][C][/C][/ROW]
[ROW][C]Harmonic Mean[/C][C]80.4070455105701[/C][C][/C][C][/C][/ROW]
[ROW][C]Quadratic Mean[/C][C]82.2800097228968[/C][C][/C][C][/C][/ROW]
[ROW][C]Winsorized Mean ( 1 / 29 )[/C][C]81.6404494382023[/C][C]1.09148051833873[/C][C]74.7978988781786[/C][/ROW]
[ROW][C]Winsorized Mean ( 2 / 29 )[/C][C]81.6404494382023[/C][C]1.09148051833873[/C][C]74.7978988781786[/C][/ROW]
[ROW][C]Winsorized Mean ( 3 / 29 )[/C][C]81.6404494382023[/C][C]1.09148051833873[/C][C]74.7978988781786[/C][/ROW]
[ROW][C]Winsorized Mean ( 4 / 29 )[/C][C]81.5955056179775[/C][C]1.08308084732375[/C][C]75.3364864863015[/C][/ROW]
[ROW][C]Winsorized Mean ( 5 / 29 )[/C][C]81.6516853932584[/C][C]1.07650423578441[/C][C]75.8489216103844[/C][/ROW]
[ROW][C]Winsorized Mean ( 6 / 29 )[/C][C]81.5168539325843[/C][C]1.0528807167798[/C][C]77.4226867616124[/C][/ROW]
[ROW][C]Winsorized Mean ( 7 / 29 )[/C][C]81.438202247191[/C][C]1.04005026792014[/C][C]78.3021789995289[/C][/ROW]
[ROW][C]Winsorized Mean ( 8 / 29 )[/C][C]81.438202247191[/C][C]1.04005026792014[/C][C]78.3021789995289[/C][/ROW]
[ROW][C]Winsorized Mean ( 9 / 29 )[/C][C]81.3370786516854[/C][C]1.02433912278304[/C][C]79.4044441363324[/C][/ROW]
[ROW][C]Winsorized Mean ( 10 / 29 )[/C][C]81.3370786516854[/C][C]1.02433912278304[/C][C]79.4044441363324[/C][/ROW]
[ROW][C]Winsorized Mean ( 11 / 29 )[/C][C]81.3370786516854[/C][C]1.02433912278304[/C][C]79.4044441363324[/C][/ROW]
[ROW][C]Winsorized Mean ( 12 / 29 )[/C][C]81.3370786516854[/C][C]1.02433912278304[/C][C]79.4044441363324[/C][/ROW]
[ROW][C]Winsorized Mean ( 13 / 29 )[/C][C]81.1910112359551[/C][C]1.00266198354264[/C][C]80.9754559049778[/C][/ROW]
[ROW][C]Winsorized Mean ( 14 / 29 )[/C][C]81.1910112359551[/C][C]1.00266198354264[/C][C]80.9754559049778[/C][/ROW]
[ROW][C]Winsorized Mean ( 15 / 29 )[/C][C]81.0224719101124[/C][C]0.978702932484417[/C][C]82.785561604928[/C][/ROW]
[ROW][C]Winsorized Mean ( 16 / 29 )[/C][C]81.0224719101124[/C][C]0.978702932484417[/C][C]82.785561604928[/C][/ROW]
[ROW][C]Winsorized Mean ( 17 / 29 )[/C][C]81.2134831460674[/C][C]0.957134372955993[/C][C]84.8506598872314[/C][/ROW]
[ROW][C]Winsorized Mean ( 18 / 29 )[/C][C]81.0112359550562[/C][C]0.9293882990023[/C][C]87.1661888169045[/C][/ROW]
[ROW][C]Winsorized Mean ( 19 / 29 )[/C][C]81.0112359550562[/C][C]0.9293882990023[/C][C]87.1661888169045[/C][/ROW]
[ROW][C]Winsorized Mean ( 20 / 29 )[/C][C]80.7865168539326[/C][C]0.899788862720064[/C][C]89.7838595264613[/C][/ROW]
[ROW][C]Winsorized Mean ( 21 / 29 )[/C][C]80.7865168539326[/C][C]0.899788862720064[/C][C]89.7838595264613[/C][/ROW]
[ROW][C]Winsorized Mean ( 22 / 29 )[/C][C]80.7865168539326[/C][C]0.899788862720064[/C][C]89.7838595264613[/C][/ROW]
[ROW][C]Winsorized Mean ( 23 / 29 )[/C][C]80.7865168539326[/C][C]0.899788862720064[/C][C]89.7838595264613[/C][/ROW]
[ROW][C]Winsorized Mean ( 24 / 29 )[/C][C]80.5168539325843[/C][C]0.86559956364586[/C][C]93.0185934861745[/C][/ROW]
[ROW][C]Winsorized Mean ( 25 / 29 )[/C][C]80.5168539325843[/C][C]0.86559956364586[/C][C]93.0185934861745[/C][/ROW]
[ROW][C]Winsorized Mean ( 26 / 29 )[/C][C]80.5168539325843[/C][C]0.86559956364586[/C][C]93.0185934861745[/C][/ROW]
[ROW][C]Winsorized Mean ( 27 / 29 )[/C][C]80.5168539325843[/C][C]0.86559956364586[/C][C]93.0185934861745[/C][/ROW]
[ROW][C]Winsorized Mean ( 28 / 29 )[/C][C]80.8314606741573[/C][C]0.831153492106176[/C][C]97.2521458934464[/C][/ROW]
[ROW][C]Winsorized Mean ( 29 / 29 )[/C][C]80.8314606741573[/C][C]0.831153492106176[/C][C]97.2521458934464[/C][/ROW]
[ROW][C]Trimmed Mean ( 1 / 29 )[/C][C]81.5632183908046[/C][C]1.08803867613514[/C][C]74.9635285765097[/C][/ROW]
[ROW][C]Trimmed Mean ( 2 / 29 )[/C][C]81.4823529411765[/C][C]1.08356861457623[/C][C]75.1981479022843[/C][/ROW]
[ROW][C]Trimmed Mean ( 3 / 29 )[/C][C]81.3975903614458[/C][C]1.07791384358774[/C][C]75.5140040603996[/C][/ROW]
[ROW][C]Trimmed Mean ( 4 / 29 )[/C][C]81.3086419753086[/C][C]1.07088891991605[/C][C]75.9263080074474[/C][/ROW]
[ROW][C]Trimmed Mean ( 5 / 29 )[/C][C]81.2278481012658[/C][C]1.06506127675149[/C][C]76.2658918076681[/C][/ROW]
[ROW][C]Trimmed Mean ( 6 / 29 )[/C][C]81.1298701298701[/C][C]1.05946740017184[/C][C]76.5760891903906[/C][/ROW]
[ROW][C]Trimmed Mean ( 7 / 29 )[/C][C]81.0533333333333[/C][C]1.05811209292834[/C][C]76.6018400838958[/C][/ROW]
[ROW][C]Trimmed Mean ( 8 / 29 )[/C][C]80.986301369863[/C][C]1.05850421995855[/C][C]76.5101355694492[/C][/ROW]
[ROW][C]Trimmed Mean ( 9 / 29 )[/C][C]80.9154929577465[/C][C]1.05802414057598[/C][C]76.4779269721545[/C][/ROW]
[ROW][C]Trimmed Mean ( 10 / 29 )[/C][C]80.8550724637681[/C][C]1.05945894970997[/C][C]76.3173245040802[/C][/ROW]
[ROW][C]Trimmed Mean ( 11 / 29 )[/C][C]80.7910447761194[/C][C]1.06005497955112[/C][C]76.2140137394861[/C][/ROW]
[ROW][C]Trimmed Mean ( 12 / 29 )[/C][C]80.7230769230769[/C][C]1.05964156047523[/C][C]76.1796063254387[/C][/ROW]
[ROW][C]Trimmed Mean ( 13 / 29 )[/C][C]80.6507936507936[/C][C]1.05800988203114[/C][C]76.2287716027402[/C][/ROW]
[ROW][C]Trimmed Mean ( 14 / 29 )[/C][C]80.5901639344262[/C][C]1.0585011181092[/C][C]76.1361160188326[/C][/ROW]
[ROW][C]Trimmed Mean ( 15 / 29 )[/C][C]80.5254237288136[/C][C]1.05775805061055[/C][C]76.1283959808513[/C][/ROW]
[ROW][C]Trimmed Mean ( 16 / 29 )[/C][C]80.4736842105263[/C][C]1.05936131961074[/C][C]75.9643407030346[/C][/ROW]
[ROW][C]Trimmed Mean ( 17 / 29 )[/C][C]80.4181818181818[/C][C]1.05972835255362[/C][C]75.8856565688736[/C][/ROW]
[ROW][C]Trimmed Mean ( 18 / 29 )[/C][C]80.3396226415094[/C][C]1.06158116463359[/C][C]75.6792088236036[/C][/ROW]
[ROW][C]Trimmed Mean ( 19 / 29 )[/C][C]80.2745098039216[/C][C]1.06645038176316[/C][C]75.2726157509589[/C][/ROW]
[ROW][C]Trimmed Mean ( 20 / 29 )[/C][C]80.2040816326531[/C][C]1.07022932560502[/C][C]74.941024053244[/C][/ROW]
[ROW][C]Trimmed Mean ( 21 / 29 )[/C][C]80.1489361702128[/C][C]1.07747036610209[/C][C]74.3862093025941[/C][/ROW]
[ROW][C]Trimmed Mean ( 22 / 29 )[/C][C]80.0888888888889[/C][C]1.08377483880858[/C][C]73.8980884414445[/C][/ROW]
[ROW][C]Trimmed Mean ( 23 / 29 )[/C][C]80.0232558139535[/C][C]1.08879746729981[/C][C]73.4969158335841[/C][/ROW]
[ROW][C]Trimmed Mean ( 24 / 29 )[/C][C]79.9512195121951[/C][C]1.09207300050386[/C][C]73.2105083408409[/C][/ROW]
[ROW][C]Trimmed Mean ( 25 / 29 )[/C][C]79.8974358974359[/C][C]1.09949986900245[/C][C]72.6670717750291[/C][/ROW]
[ROW][C]Trimmed Mean ( 26 / 29 )[/C][C]79.8378378378378[/C][C]1.10521118435904[/C][C]72.2376311131339[/C][/ROW]
[ROW][C]Trimmed Mean ( 27 / 29 )[/C][C]79.7714285714286[/C][C]1.10847439582269[/C][C]71.9650619554668[/C][/ROW]
[ROW][C]Trimmed Mean ( 28 / 29 )[/C][C]79.6969696969697[/C][C]1.10823779078241[/C][C]71.9132395229946[/C][/ROW]
[ROW][C]Trimmed Mean ( 29 / 29 )[/C][C]79.5806451612903[/C][C]1.109852449312[/C][C]71.7038064029345[/C][/ROW]
[ROW][C]Median[/C][C]78[/C][C][/C][C][/C][/ROW]
[ROW][C]Midrange[/C][C]85[/C][C][/C][C][/C][/ROW]
[ROW][C]Midmean - Weighted Average at Xnp[/C][C]79.7307692307692[/C][C][/C][C][/C][/ROW]
[ROW][C]Midmean - Weighted Average at X(n+1)p[/C][C]79.7307692307692[/C][C][/C][C][/C][/ROW]
[ROW][C]Midmean - Empirical Distribution Function[/C][C]79.7307692307692[/C][C][/C][C][/C][/ROW]
[ROW][C]Midmean - Empirical Distribution Function - Averaging[/C][C]79.7307692307692[/C][C][/C][C][/C][/ROW]
[ROW][C]Midmean - Empirical Distribution Function - Interpolation[/C][C]79.7307692307692[/C][C][/C][C][/C][/ROW]
[ROW][C]Midmean - Closest Observation[/C][C]79.7307692307692[/C][C][/C][C][/C][/ROW]
[ROW][C]Midmean - True Basic - Statistics Graphics Toolkit[/C][C]79.7307692307692[/C][C][/C][C][/C][/ROW]
[ROW][C]Midmean - MS Excel (old versions)[/C][C]79.7307692307692[/C][C][/C][C][/C][/ROW]
[ROW][C]Number of observations[/C][C]89[/C][C][/C][C][/C][/ROW]
[/TABLE]
Source: https://freestatistics.org/blog/index.php?pk=188104&T=1

Globally Unique Identifier (entire table): ba.freestatistics.org/blog/index.php?pk=188104&T=1

As an alternative you can also use a QR Code:  

The GUIDs for individual cells are displayed in the table below:

Central Tendency - Ungrouped Data
MeasureValueS.E.Value/S.E.
Arithmetic Mean81.64044943820231.0914805183387374.7978988781786
Geometric Mean81.0136716584687
Harmonic Mean80.4070455105701
Quadratic Mean82.2800097228968
Winsorized Mean ( 1 / 29 )81.64044943820231.0914805183387374.7978988781786
Winsorized Mean ( 2 / 29 )81.64044943820231.0914805183387374.7978988781786
Winsorized Mean ( 3 / 29 )81.64044943820231.0914805183387374.7978988781786
Winsorized Mean ( 4 / 29 )81.59550561797751.0830808473237575.3364864863015
Winsorized Mean ( 5 / 29 )81.65168539325841.0765042357844175.8489216103844
Winsorized Mean ( 6 / 29 )81.51685393258431.052880716779877.4226867616124
Winsorized Mean ( 7 / 29 )81.4382022471911.0400502679201478.3021789995289
Winsorized Mean ( 8 / 29 )81.4382022471911.0400502679201478.3021789995289
Winsorized Mean ( 9 / 29 )81.33707865168541.0243391227830479.4044441363324
Winsorized Mean ( 10 / 29 )81.33707865168541.0243391227830479.4044441363324
Winsorized Mean ( 11 / 29 )81.33707865168541.0243391227830479.4044441363324
Winsorized Mean ( 12 / 29 )81.33707865168541.0243391227830479.4044441363324
Winsorized Mean ( 13 / 29 )81.19101123595511.0026619835426480.9754559049778
Winsorized Mean ( 14 / 29 )81.19101123595511.0026619835426480.9754559049778
Winsorized Mean ( 15 / 29 )81.02247191011240.97870293248441782.785561604928
Winsorized Mean ( 16 / 29 )81.02247191011240.97870293248441782.785561604928
Winsorized Mean ( 17 / 29 )81.21348314606740.95713437295599384.8506598872314
Winsorized Mean ( 18 / 29 )81.01123595505620.929388299002387.1661888169045
Winsorized Mean ( 19 / 29 )81.01123595505620.929388299002387.1661888169045
Winsorized Mean ( 20 / 29 )80.78651685393260.89978886272006489.7838595264613
Winsorized Mean ( 21 / 29 )80.78651685393260.89978886272006489.7838595264613
Winsorized Mean ( 22 / 29 )80.78651685393260.89978886272006489.7838595264613
Winsorized Mean ( 23 / 29 )80.78651685393260.89978886272006489.7838595264613
Winsorized Mean ( 24 / 29 )80.51685393258430.8655995636458693.0185934861745
Winsorized Mean ( 25 / 29 )80.51685393258430.8655995636458693.0185934861745
Winsorized Mean ( 26 / 29 )80.51685393258430.8655995636458693.0185934861745
Winsorized Mean ( 27 / 29 )80.51685393258430.8655995636458693.0185934861745
Winsorized Mean ( 28 / 29 )80.83146067415730.83115349210617697.2521458934464
Winsorized Mean ( 29 / 29 )80.83146067415730.83115349210617697.2521458934464
Trimmed Mean ( 1 / 29 )81.56321839080461.0880386761351474.9635285765097
Trimmed Mean ( 2 / 29 )81.48235294117651.0835686145762375.1981479022843
Trimmed Mean ( 3 / 29 )81.39759036144581.0779138435877475.5140040603996
Trimmed Mean ( 4 / 29 )81.30864197530861.0708889199160575.9263080074474
Trimmed Mean ( 5 / 29 )81.22784810126581.0650612767514976.2658918076681
Trimmed Mean ( 6 / 29 )81.12987012987011.0594674001718476.5760891903906
Trimmed Mean ( 7 / 29 )81.05333333333331.0581120929283476.6018400838958
Trimmed Mean ( 8 / 29 )80.9863013698631.0585042199585576.5101355694492
Trimmed Mean ( 9 / 29 )80.91549295774651.0580241405759876.4779269721545
Trimmed Mean ( 10 / 29 )80.85507246376811.0594589497099776.3173245040802
Trimmed Mean ( 11 / 29 )80.79104477611941.0600549795511276.2140137394861
Trimmed Mean ( 12 / 29 )80.72307692307691.0596415604752376.1796063254387
Trimmed Mean ( 13 / 29 )80.65079365079361.0580098820311476.2287716027402
Trimmed Mean ( 14 / 29 )80.59016393442621.058501118109276.1361160188326
Trimmed Mean ( 15 / 29 )80.52542372881361.0577580506105576.1283959808513
Trimmed Mean ( 16 / 29 )80.47368421052631.0593613196107475.9643407030346
Trimmed Mean ( 17 / 29 )80.41818181818181.0597283525536275.8856565688736
Trimmed Mean ( 18 / 29 )80.33962264150941.0615811646335975.6792088236036
Trimmed Mean ( 19 / 29 )80.27450980392161.0664503817631675.2726157509589
Trimmed Mean ( 20 / 29 )80.20408163265311.0702293256050274.941024053244
Trimmed Mean ( 21 / 29 )80.14893617021281.0774703661020974.3862093025941
Trimmed Mean ( 22 / 29 )80.08888888888891.0837748388085873.8980884414445
Trimmed Mean ( 23 / 29 )80.02325581395351.0887974672998173.4969158335841
Trimmed Mean ( 24 / 29 )79.95121951219511.0920730005038673.2105083408409
Trimmed Mean ( 25 / 29 )79.89743589743591.0994998690024572.6670717750291
Trimmed Mean ( 26 / 29 )79.83783783783781.1052111843590472.2376311131339
Trimmed Mean ( 27 / 29 )79.77142857142861.1084743958226971.9650619554668
Trimmed Mean ( 28 / 29 )79.69696969696971.1082377907824171.9132395229946
Trimmed Mean ( 29 / 29 )79.58064516129031.10985244931271.7038064029345
Median78
Midrange85
Midmean - Weighted Average at Xnp79.7307692307692
Midmean - Weighted Average at X(n+1)p79.7307692307692
Midmean - Empirical Distribution Function79.7307692307692
Midmean - Empirical Distribution Function - Averaging79.7307692307692
Midmean - Empirical Distribution Function - Interpolation79.7307692307692
Midmean - Closest Observation79.7307692307692
Midmean - True Basic - Statistics Graphics Toolkit79.7307692307692
Midmean - MS Excel (old versions)79.7307692307692
Number of observations89


Parameters (Session):
Parameters (R input):
R code (references can be found in the software module):
geomean <- function(x) {
return(exp(mean(log(x))))
}
harmean <- function(x) {
return(1/mean(1/x))
}
quamean <- function(x) {
return(sqrt(mean(x*x)))
}
winmean <- function(x) {
x <-sort(x[!is.na(x)])
n<-length(x)
denom <- 3
nodenom <- n/denom
if (nodenom>40) denom <- n/40
sqrtn = sqrt(n)
roundnodenom = floor(nodenom)
win <- array(NA,dim=c(roundnodenom,2))
for (j in 1:roundnodenom) {
win[j,1] <- (j*x[j+1]+sum(x[(j+1):(n-j)])+j*x[n-j])/n
win[j,2] <- sd(c(rep(x[j+1],j),x[(j+1):(n-j)],rep(x[n-j],j)))/sqrtn
}
return(win)
}
trimean <- function(x) {
x <-sort(x[!is.na(x)])
n<-length(x)
denom <- 3
nodenom <- n/denom
if (nodenom>40) denom <- n/40
sqrtn = sqrt(n)
roundnodenom = floor(nodenom)
tri <- array(NA,dim=c(roundnodenom,2))
for (j in 1:roundnodenom) {
tri[j,1] <- mean(x,trim=j/n)
tri[j,2] <- sd(x[(j+1):(n-j)]) / sqrt(n-j*2)
}
return(tri)
}
midrange <- function(x) {
return((max(x)+min(x))/2)
}
q1 <- function(data,n,p,i,f) {
np <- n*p;
i <<- floor(np)
f <<- np - i
qvalue <- (1-f)*data[i] + f*data[i+1]
}
q2 <- function(data,n,p,i,f) {
np <- (n+1)*p
i <<- floor(np)
f <<- np - i
qvalue <- (1-f)*data[i] + f*data[i+1]
}
q3 <- function(data,n,p,i,f) {
np <- n*p
i <<- floor(np)
f <<- np - i
if (f==0) {
qvalue <- data[i]
} else {
qvalue <- data[i+1]
}
}
q4 <- function(data,n,p,i,f) {
np <- n*p
i <<- floor(np)
f <<- np - i
if (f==0) {
qvalue <- (data[i]+data[i+1])/2
} else {
qvalue <- data[i+1]
}
}
q5 <- function(data,n,p,i,f) {
np <- (n-1)*p
i <<- floor(np)
f <<- np - i
if (f==0) {
qvalue <- data[i+1]
} else {
qvalue <- data[i+1] + f*(data[i+2]-data[i+1])
}
}
q6 <- function(data,n,p,i,f) {
np <- n*p+0.5
i <<- floor(np)
f <<- np - i
qvalue <- data[i]
}
q7 <- function(data,n,p,i,f) {
np <- (n+1)*p
i <<- floor(np)
f <<- np - i
if (f==0) {
qvalue <- data[i]
} else {
qvalue <- f*data[i] + (1-f)*data[i+1]
}
}
q8 <- function(data,n,p,i,f) {
np <- (n+1)*p
i <<- floor(np)
f <<- np - i
if (f==0) {
qvalue <- data[i]
} else {
if (f == 0.5) {
qvalue <- (data[i]+data[i+1])/2
} else {
if (f < 0.5) {
qvalue <- data[i]
} else {
qvalue <- data[i+1]
}
}
}
}
midmean <- function(x,def) {
x <-sort(x[!is.na(x)])
n<-length(x)
if (def==1) {
qvalue1 <- q1(x,n,0.25,i,f)
qvalue3 <- q1(x,n,0.75,i,f)
}
if (def==2) {
qvalue1 <- q2(x,n,0.25,i,f)
qvalue3 <- q2(x,n,0.75,i,f)
}
if (def==3) {
qvalue1 <- q3(x,n,0.25,i,f)
qvalue3 <- q3(x,n,0.75,i,f)
}
if (def==4) {
qvalue1 <- q4(x,n,0.25,i,f)
qvalue3 <- q4(x,n,0.75,i,f)
}
if (def==5) {
qvalue1 <- q5(x,n,0.25,i,f)
qvalue3 <- q5(x,n,0.75,i,f)
}
if (def==6) {
qvalue1 <- q6(x,n,0.25,i,f)
qvalue3 <- q6(x,n,0.75,i,f)
}
if (def==7) {
qvalue1 <- q7(x,n,0.25,i,f)
qvalue3 <- q7(x,n,0.75,i,f)
}
if (def==8) {
qvalue1 <- q8(x,n,0.25,i,f)
qvalue3 <- q8(x,n,0.75,i,f)
}
midm <- 0
myn <- 0
roundno4 <- round(n/4)
round3no4 <- round(3*n/4)
for (i in 1:n) {
if ((x[i]>=qvalue1) & (x[i]<=qvalue3)){
midm = midm + x[i]
myn = myn + 1
}
}
midm = midm / myn
return(midm)
}
(arm <- mean(x))
sqrtn <- sqrt(length(x))
(armse <- sd(x) / sqrtn)
(armose <- arm / armse)
(geo <- geomean(x))
(har <- harmean(x))
(qua <- quamean(x))
(win <- winmean(x))
(tri <- trimean(x))
(midr <- midrange(x))
midm <- array(NA,dim=8)
for (j in 1:8) midm[j] <- midmean(x,j)
midm
bitmap(file='test1.png')
lb <- win[,1] - 2*win[,2]
ub <- win[,1] + 2*win[,2]
if ((ylimmin == '') | (ylimmax == '')) plot(win[,1],type='b',main=main, xlab='j', pch=19, ylab='Winsorized Mean(j/n)', ylim=c(min(lb),max(ub))) else plot(win[,1],type='l',main=main, xlab='j', pch=19, ylab='Winsorized Mean(j/n)', ylim=c(ylimmin,ylimmax))
lines(ub,lty=3)
lines(lb,lty=3)
grid()
dev.off()
bitmap(file='test2.png')
lb <- tri[,1] - 2*tri[,2]
ub <- tri[,1] + 2*tri[,2]
if ((ylimmin == '') | (ylimmax == '')) plot(tri[,1],type='b',main=main, xlab='j', pch=19, ylab='Trimmed Mean(j/n)', ylim=c(min(lb),max(ub))) else plot(tri[,1],type='l',main=main, xlab='j', pch=19, ylab='Trimmed Mean(j/n)', ylim=c(ylimmin,ylimmax))
lines(ub,lty=3)
lines(lb,lty=3)
grid()
dev.off()
load(file='createtable')
a<-table.start()
a<-table.row.start(a)
a<-table.element(a,'Central Tendency - Ungrouped Data',4,TRUE)
a<-table.row.end(a)
a<-table.row.start(a)
a<-table.element(a,'Measure',header=TRUE)
a<-table.element(a,'Value',header=TRUE)
a<-table.element(a,'S.E.',header=TRUE)
a<-table.element(a,'Value/S.E.',header=TRUE)
a<-table.row.end(a)
a<-table.row.start(a)
a<-table.element(a,hyperlink('arithmetic_mean.htm', 'Arithmetic Mean', 'click to view the definition of the Arithmetic Mean'),header=TRUE)
a<-table.element(a,arm)
a<-table.element(a,hyperlink('arithmetic_mean_standard_error.htm', armse, 'click to view the definition of the Standard Error of the Arithmetic Mean'))
a<-table.element(a,armose)
a<-table.row.end(a)
a<-table.row.start(a)
a<-table.element(a,hyperlink('geometric_mean.htm', 'Geometric Mean', 'click to view the definition of the Geometric Mean'),header=TRUE)
a<-table.element(a,geo)
a<-table.element(a,'')
a<-table.row.end(a)
a<-table.row.start(a)
a<-table.element(a,hyperlink('harmonic_mean.htm', 'Harmonic Mean', 'click to view the definition of the Harmonic Mean'),header=TRUE)
a<-table.element(a,har)
a<-table.element(a,'')
a<-table.row.end(a)
a<-table.row.start(a)
a<-table.element(a,hyperlink('quadratic_mean.htm', 'Quadratic Mean', 'click to view the definition of the Quadratic Mean'),header=TRUE)
a<-table.element(a,qua)
a<-table.element(a,'')
a<-table.row.end(a)
for (j in 1:length(win[,1])) {
a<-table.row.start(a)
mylabel <- paste('Winsorized Mean (',j)
mylabel <- paste(mylabel,'/')
mylabel <- paste(mylabel,length(win[,1]))
mylabel <- paste(mylabel,')')
a<-table.element(a,hyperlink('winsorized_mean.htm', mylabel, 'click to view the definition of the Winsorized Mean'),header=TRUE)
a<-table.element(a,win[j,1])
a<-table.element(a,win[j,2])
a<-table.element(a,win[j,1]/win[j,2])
a<-table.row.end(a)
}
for (j in 1:length(tri[,1])) {
a<-table.row.start(a)
mylabel <- paste('Trimmed Mean (',j)
mylabel <- paste(mylabel,'/')
mylabel <- paste(mylabel,length(tri[,1]))
mylabel <- paste(mylabel,')')
a<-table.element(a,hyperlink('arithmetic_mean.htm', mylabel, 'click to view the definition of the Trimmed Mean'),header=TRUE)
a<-table.element(a,tri[j,1])
a<-table.element(a,tri[j,2])
a<-table.element(a,tri[j,1]/tri[j,2])
a<-table.row.end(a)
}
a<-table.row.start(a)
a<-table.element(a,hyperlink('median_1.htm', 'Median', 'click to view the definition of the Median'),header=TRUE)
a<-table.element(a,median(x))
a<-table.element(a,'')
a<-table.row.end(a)
a<-table.row.start(a)
a<-table.element(a,hyperlink('midrange.htm', 'Midrange', 'click to view the definition of the Midrange'),header=TRUE)
a<-table.element(a,midr)
a<-table.element(a,'')
a<-table.row.end(a)
a<-table.row.start(a)
mymid <- hyperlink('midmean.htm', 'Midmean', 'click to view the definition of the Midmean')
mylabel <- paste(mymid,hyperlink('method_1.htm','Weighted Average at Xnp',''),sep=' - ')
a<-table.element(a,mylabel,header=TRUE)
a<-table.element(a,midm[1])
a<-table.element(a,'')
a<-table.row.end(a)
a<-table.row.start(a)
mymid <- hyperlink('midmean.htm', 'Midmean', 'click to view the definition of the Midmean')
mylabel <- paste(mymid,hyperlink('method_2.htm','Weighted Average at X(n+1)p',''),sep=' - ')
a<-table.element(a,mylabel,header=TRUE)
a<-table.element(a,midm[2])
a<-table.element(a,'')
a<-table.row.end(a)
a<-table.row.start(a)
mymid <- hyperlink('midmean.htm', 'Midmean', 'click to view the definition of the Midmean')
mylabel <- paste(mymid,hyperlink('method_3.htm','Empirical Distribution Function',''),sep=' - ')
a<-table.element(a,mylabel,header=TRUE)
a<-table.element(a,midm[3])
a<-table.element(a,'')
a<-table.row.end(a)
a<-table.row.start(a)
mymid <- hyperlink('midmean.htm', 'Midmean', 'click to view the definition of the Midmean')
mylabel <- paste(mymid,hyperlink('method_4.htm','Empirical Distribution Function - Averaging',''),sep=' - ')
a<-table.element(a,mylabel,header=TRUE)
a<-table.element(a,midm[4])
a<-table.element(a,'')
a<-table.row.end(a)
a<-table.row.start(a)
mymid <- hyperlink('midmean.htm', 'Midmean', 'click to view the definition of the Midmean')
mylabel <- paste(mymid,hyperlink('method_5.htm','Empirical Distribution Function - Interpolation',''),sep=' - ')
a<-table.element(a,mylabel,header=TRUE)
a<-table.element(a,midm[5])
a<-table.element(a,'')
a<-table.row.end(a)
a<-table.row.start(a)
mymid <- hyperlink('midmean.htm', 'Midmean', 'click to view the definition of the Midmean')
mylabel <- paste(mymid,hyperlink('method_6.htm','Closest Observation',''),sep=' - ')
a<-table.element(a,mylabel,header=TRUE)
a<-table.element(a,midm[6])
a<-table.element(a,'')
a<-table.row.end(a)
a<-table.row.start(a)
mymid <- hyperlink('midmean.htm', 'Midmean', 'click to view the definition of the Midmean')
mylabel <- paste(mymid,hyperlink('method_7.htm','True Basic - Statistics Graphics Toolkit',''),sep=' - ')
a<-table.element(a,mylabel,header=TRUE)
a<-table.element(a,midm[7])
a<-table.element(a,'')
a<-table.row.end(a)
a<-table.row.start(a)
mymid <- hyperlink('midmean.htm', 'Midmean', 'click to view the definition of the Midmean')
mylabel <- paste(mymid,hyperlink('method_8.htm','MS Excel (old versions)',''),sep=' - ')
a<-table.element(a,mylabel,header=TRUE)
a<-table.element(a,midm[8])
a<-table.element(a,'')
a<-table.row.end(a)
a<-table.row.start(a)
a<-table.element(a,'Number of observations',header=TRUE)
a<-table.element(a,length(x))
a<-table.element(a,'')
a<-table.row.end(a)
a<-table.end(a)
table.save(a,file='mytable.tab')