Free Statistics

of Irreproducible Research!

Author's title

Author*Unverified author*
R Software Modulerwasp_autocorrelation.wasp
Title produced by software(Partial) Autocorrelation Function
Date of computationMon, 12 Nov 2012 06:12:35 -0500
Cite this page as followsStatistical Computations at FreeStatistics.org, Office for Research Development and Education, URL https://freestatistics.org/blog/index.php?v=date/2012/Nov/12/t1352718866roagqirmgr6y4zs.htm/, Retrieved Mon, 29 Apr 2024 02:31:31 +0000
Statistical Computations at FreeStatistics.org, Office for Research Development and Education, URL https://freestatistics.org/blog/index.php?pk=187776, Retrieved Mon, 29 Apr 2024 02:31:31 +0000
QR Codes:

Original text written by user:
IsPrivate?No (this computation is public)
User-defined keywords
Estimated Impact71
Family? (F = Feedback message, R = changed R code, M = changed R Module, P = changed Parameters, D = changed Data)
-     [(Partial) Autocorrelation Function] [Autocorrelatie in...] [2012-11-12 10:58:31] [414c2ec381eb4adb801f9ac6823317d8]
- R P     [(Partial) Autocorrelation Function] [Autocorrelatie in...] [2012-11-12 11:12:35] [a5163a6b16cb463ddc5e8265592a0086] [Current]
Feedback Forum

Post a new message
Dataseries X:
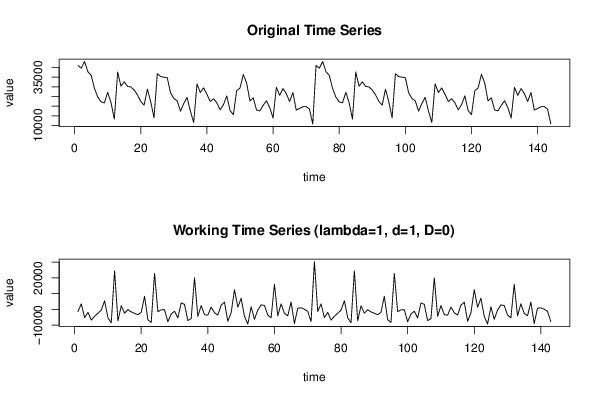
41086
39690
43129
37863
35953
29133
24693
22205
21725
27192
21790
13253
37702
30364
32609
30212
29965
28352
25814
22414
20506
28806
22228
13971
36845
35338
35022
34777
26887
23970
22780
17351
21382
24561
17409
11514
31514
27071
29462
26105
22397
23843
21705
18089
20764
25316
17704
15548
28029
29383
36438
32034
22679
24319
18004
17537
20366
22782
19169
13807
29743
25591
29096
26482
22405
27044
17970
18730
19684
19785
18479
10698


Summary of computational transaction
Raw Inputview raw input (R code)
Raw Outputview raw output of R engine
Computing time2 seconds
R Server'Gwilym Jenkins' @ jenkins.wessa.net

\begin{tabular}{lllllllll}
\hline
Summary of computational transaction \tabularnewline
Raw Input & view raw input (R code)  \tabularnewline
Raw Output & view raw output of R engine  \tabularnewline
Computing time & 2 seconds \tabularnewline
R Server & 'Gwilym Jenkins' @ jenkins.wessa.net \tabularnewline
\hline
\end{tabular}
%Source: https://freestatistics.org/blog/index.php?pk=187776&T=0

[TABLE]
[ROW][C]Summary of computational transaction[/C][/ROW]
[ROW][C]Raw Input[/C][C]view raw input (R code) [/C][/ROW]
[ROW][C]Raw Output[/C][C]view raw output of R engine [/C][/ROW]
[ROW][C]Computing time[/C][C]2 seconds[/C][/ROW]
[ROW][C]R Server[/C][C]'Gwilym Jenkins' @ jenkins.wessa.net[/C][/ROW]
[/TABLE]
Source: https://freestatistics.org/blog/index.php?pk=187776&T=0

Globally Unique Identifier (entire table): ba.freestatistics.org/blog/index.php?pk=187776&T=0

As an alternative you can also use a QR Code:  

The GUIDs for individual cells are displayed in the table below:

Summary of computational transaction
Raw Inputview raw input (R code)
Raw Outputview raw output of R engine
Computing time2 seconds
R Server'Gwilym Jenkins' @ jenkins.wessa.net


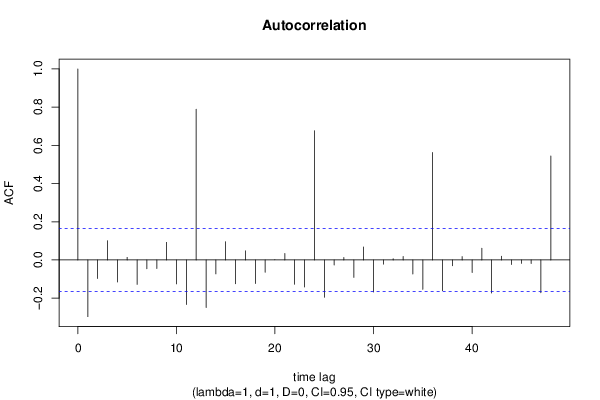
Autocorrelation Function
Time lag kACF(k)T-STATP-value
1-0.296743-3.54850.000262
2-0.09742-1.1650.122985
30.1009241.20690.114736
4-0.115363-1.37950.084941
50.0137570.16450.434783
6-0.127741-1.52760.064416
7-0.045725-0.54680.292688
8-0.045133-0.53970.295116
90.0922311.10290.135956
10-0.125246-1.49770.068205
11-0.233441-2.79150.002982
120.7888059.43270
13-0.249153-2.97940.001697
14-0.072769-0.87020.192829
150.0951951.13840.128435
16-0.124902-1.49360.06874
170.0477470.5710.284458
18-0.123494-1.47680.070967
19-0.064557-0.7720.220696
200.0002150.00260.498974
210.0336610.40250.34395
22-0.126741-1.51560.065913
23-0.141689-1.69440.046188
240.6767518.09280
25-0.195353-2.33610.010438
26-0.026837-0.32090.374367
270.0130060.15550.438311
28-0.091083-1.08920.138951
290.0680470.81370.208577
30-0.167842-2.00710.023312
31-0.02189-0.26180.39694
320.0066370.07940.468425
330.0179710.21490.415074
34-0.073165-0.87490.19154
35-0.153792-1.83910.033988
360.5623786.72510
37-0.160484-1.91910.028481
38-0.029984-0.35860.360226
390.0176220.21070.416699
40-0.065221-0.77990.218362
410.0609850.72930.233512
42-0.17313-2.07030.02011
430.0195060.23330.407946
44-0.023928-0.28610.387594
45-0.017689-0.21150.416389
46-0.018939-0.22650.410578
47-0.171529-2.05120.021037
480.5447126.51380

\begin{tabular}{lllllllll}
\hline
Autocorrelation Function \tabularnewline
Time lag k & ACF(k) & T-STAT & P-value \tabularnewline
1 & -0.296743 & -3.5485 & 0.000262 \tabularnewline
2 & -0.09742 & -1.165 & 0.122985 \tabularnewline
3 & 0.100924 & 1.2069 & 0.114736 \tabularnewline
4 & -0.115363 & -1.3795 & 0.084941 \tabularnewline
5 & 0.013757 & 0.1645 & 0.434783 \tabularnewline
6 & -0.127741 & -1.5276 & 0.064416 \tabularnewline
7 & -0.045725 & -0.5468 & 0.292688 \tabularnewline
8 & -0.045133 & -0.5397 & 0.295116 \tabularnewline
9 & 0.092231 & 1.1029 & 0.135956 \tabularnewline
10 & -0.125246 & -1.4977 & 0.068205 \tabularnewline
11 & -0.233441 & -2.7915 & 0.002982 \tabularnewline
12 & 0.788805 & 9.4327 & 0 \tabularnewline
13 & -0.249153 & -2.9794 & 0.001697 \tabularnewline
14 & -0.072769 & -0.8702 & 0.192829 \tabularnewline
15 & 0.095195 & 1.1384 & 0.128435 \tabularnewline
16 & -0.124902 & -1.4936 & 0.06874 \tabularnewline
17 & 0.047747 & 0.571 & 0.284458 \tabularnewline
18 & -0.123494 & -1.4768 & 0.070967 \tabularnewline
19 & -0.064557 & -0.772 & 0.220696 \tabularnewline
20 & 0.000215 & 0.0026 & 0.498974 \tabularnewline
21 & 0.033661 & 0.4025 & 0.34395 \tabularnewline
22 & -0.126741 & -1.5156 & 0.065913 \tabularnewline
23 & -0.141689 & -1.6944 & 0.046188 \tabularnewline
24 & 0.676751 & 8.0928 & 0 \tabularnewline
25 & -0.195353 & -2.3361 & 0.010438 \tabularnewline
26 & -0.026837 & -0.3209 & 0.374367 \tabularnewline
27 & 0.013006 & 0.1555 & 0.438311 \tabularnewline
28 & -0.091083 & -1.0892 & 0.138951 \tabularnewline
29 & 0.068047 & 0.8137 & 0.208577 \tabularnewline
30 & -0.167842 & -2.0071 & 0.023312 \tabularnewline
31 & -0.02189 & -0.2618 & 0.39694 \tabularnewline
32 & 0.006637 & 0.0794 & 0.468425 \tabularnewline
33 & 0.017971 & 0.2149 & 0.415074 \tabularnewline
34 & -0.073165 & -0.8749 & 0.19154 \tabularnewline
35 & -0.153792 & -1.8391 & 0.033988 \tabularnewline
36 & 0.562378 & 6.7251 & 0 \tabularnewline
37 & -0.160484 & -1.9191 & 0.028481 \tabularnewline
38 & -0.029984 & -0.3586 & 0.360226 \tabularnewline
39 & 0.017622 & 0.2107 & 0.416699 \tabularnewline
40 & -0.065221 & -0.7799 & 0.218362 \tabularnewline
41 & 0.060985 & 0.7293 & 0.233512 \tabularnewline
42 & -0.17313 & -2.0703 & 0.02011 \tabularnewline
43 & 0.019506 & 0.2333 & 0.407946 \tabularnewline
44 & -0.023928 & -0.2861 & 0.387594 \tabularnewline
45 & -0.017689 & -0.2115 & 0.416389 \tabularnewline
46 & -0.018939 & -0.2265 & 0.410578 \tabularnewline
47 & -0.171529 & -2.0512 & 0.021037 \tabularnewline
48 & 0.544712 & 6.5138 & 0 \tabularnewline
\hline
\end{tabular}
%Source: https://freestatistics.org/blog/index.php?pk=187776&T=1

[TABLE]
[ROW][C]Autocorrelation Function[/C][/ROW]
[ROW][C]Time lag k[/C][C]ACF(k)[/C][C]T-STAT[/C][C]P-value[/C][/ROW]
[ROW][C]1[/C][C]-0.296743[/C][C]-3.5485[/C][C]0.000262[/C][/ROW]
[ROW][C]2[/C][C]-0.09742[/C][C]-1.165[/C][C]0.122985[/C][/ROW]
[ROW][C]3[/C][C]0.100924[/C][C]1.2069[/C][C]0.114736[/C][/ROW]
[ROW][C]4[/C][C]-0.115363[/C][C]-1.3795[/C][C]0.084941[/C][/ROW]
[ROW][C]5[/C][C]0.013757[/C][C]0.1645[/C][C]0.434783[/C][/ROW]
[ROW][C]6[/C][C]-0.127741[/C][C]-1.5276[/C][C]0.064416[/C][/ROW]
[ROW][C]7[/C][C]-0.045725[/C][C]-0.5468[/C][C]0.292688[/C][/ROW]
[ROW][C]8[/C][C]-0.045133[/C][C]-0.5397[/C][C]0.295116[/C][/ROW]
[ROW][C]9[/C][C]0.092231[/C][C]1.1029[/C][C]0.135956[/C][/ROW]
[ROW][C]10[/C][C]-0.125246[/C][C]-1.4977[/C][C]0.068205[/C][/ROW]
[ROW][C]11[/C][C]-0.233441[/C][C]-2.7915[/C][C]0.002982[/C][/ROW]
[ROW][C]12[/C][C]0.788805[/C][C]9.4327[/C][C]0[/C][/ROW]
[ROW][C]13[/C][C]-0.249153[/C][C]-2.9794[/C][C]0.001697[/C][/ROW]
[ROW][C]14[/C][C]-0.072769[/C][C]-0.8702[/C][C]0.192829[/C][/ROW]
[ROW][C]15[/C][C]0.095195[/C][C]1.1384[/C][C]0.128435[/C][/ROW]
[ROW][C]16[/C][C]-0.124902[/C][C]-1.4936[/C][C]0.06874[/C][/ROW]
[ROW][C]17[/C][C]0.047747[/C][C]0.571[/C][C]0.284458[/C][/ROW]
[ROW][C]18[/C][C]-0.123494[/C][C]-1.4768[/C][C]0.070967[/C][/ROW]
[ROW][C]19[/C][C]-0.064557[/C][C]-0.772[/C][C]0.220696[/C][/ROW]
[ROW][C]20[/C][C]0.000215[/C][C]0.0026[/C][C]0.498974[/C][/ROW]
[ROW][C]21[/C][C]0.033661[/C][C]0.4025[/C][C]0.34395[/C][/ROW]
[ROW][C]22[/C][C]-0.126741[/C][C]-1.5156[/C][C]0.065913[/C][/ROW]
[ROW][C]23[/C][C]-0.141689[/C][C]-1.6944[/C][C]0.046188[/C][/ROW]
[ROW][C]24[/C][C]0.676751[/C][C]8.0928[/C][C]0[/C][/ROW]
[ROW][C]25[/C][C]-0.195353[/C][C]-2.3361[/C][C]0.010438[/C][/ROW]
[ROW][C]26[/C][C]-0.026837[/C][C]-0.3209[/C][C]0.374367[/C][/ROW]
[ROW][C]27[/C][C]0.013006[/C][C]0.1555[/C][C]0.438311[/C][/ROW]
[ROW][C]28[/C][C]-0.091083[/C][C]-1.0892[/C][C]0.138951[/C][/ROW]
[ROW][C]29[/C][C]0.068047[/C][C]0.8137[/C][C]0.208577[/C][/ROW]
[ROW][C]30[/C][C]-0.167842[/C][C]-2.0071[/C][C]0.023312[/C][/ROW]
[ROW][C]31[/C][C]-0.02189[/C][C]-0.2618[/C][C]0.39694[/C][/ROW]
[ROW][C]32[/C][C]0.006637[/C][C]0.0794[/C][C]0.468425[/C][/ROW]
[ROW][C]33[/C][C]0.017971[/C][C]0.2149[/C][C]0.415074[/C][/ROW]
[ROW][C]34[/C][C]-0.073165[/C][C]-0.8749[/C][C]0.19154[/C][/ROW]
[ROW][C]35[/C][C]-0.153792[/C][C]-1.8391[/C][C]0.033988[/C][/ROW]
[ROW][C]36[/C][C]0.562378[/C][C]6.7251[/C][C]0[/C][/ROW]
[ROW][C]37[/C][C]-0.160484[/C][C]-1.9191[/C][C]0.028481[/C][/ROW]
[ROW][C]38[/C][C]-0.029984[/C][C]-0.3586[/C][C]0.360226[/C][/ROW]
[ROW][C]39[/C][C]0.017622[/C][C]0.2107[/C][C]0.416699[/C][/ROW]
[ROW][C]40[/C][C]-0.065221[/C][C]-0.7799[/C][C]0.218362[/C][/ROW]
[ROW][C]41[/C][C]0.060985[/C][C]0.7293[/C][C]0.233512[/C][/ROW]
[ROW][C]42[/C][C]-0.17313[/C][C]-2.0703[/C][C]0.02011[/C][/ROW]
[ROW][C]43[/C][C]0.019506[/C][C]0.2333[/C][C]0.407946[/C][/ROW]
[ROW][C]44[/C][C]-0.023928[/C][C]-0.2861[/C][C]0.387594[/C][/ROW]
[ROW][C]45[/C][C]-0.017689[/C][C]-0.2115[/C][C]0.416389[/C][/ROW]
[ROW][C]46[/C][C]-0.018939[/C][C]-0.2265[/C][C]0.410578[/C][/ROW]
[ROW][C]47[/C][C]-0.171529[/C][C]-2.0512[/C][C]0.021037[/C][/ROW]
[ROW][C]48[/C][C]0.544712[/C][C]6.5138[/C][C]0[/C][/ROW]
[/TABLE]
Source: https://freestatistics.org/blog/index.php?pk=187776&T=1

Globally Unique Identifier (entire table): ba.freestatistics.org/blog/index.php?pk=187776&T=1

As an alternative you can also use a QR Code:  

The GUIDs for individual cells are displayed in the table below:

Autocorrelation Function
Time lag kACF(k)T-STATP-value
1-0.296743-3.54850.000262
2-0.09742-1.1650.122985
30.1009241.20690.114736
4-0.115363-1.37950.084941
50.0137570.16450.434783
6-0.127741-1.52760.064416
7-0.045725-0.54680.292688
8-0.045133-0.53970.295116
90.0922311.10290.135956
10-0.125246-1.49770.068205
11-0.233441-2.79150.002982
120.7888059.43270
13-0.249153-2.97940.001697
14-0.072769-0.87020.192829
150.0951951.13840.128435
16-0.124902-1.49360.06874
170.0477470.5710.284458
18-0.123494-1.47680.070967
19-0.064557-0.7720.220696
200.0002150.00260.498974
210.0336610.40250.34395
22-0.126741-1.51560.065913
23-0.141689-1.69440.046188
240.6767518.09280
25-0.195353-2.33610.010438
26-0.026837-0.32090.374367
270.0130060.15550.438311
28-0.091083-1.08920.138951
290.0680470.81370.208577
30-0.167842-2.00710.023312
31-0.02189-0.26180.39694
320.0066370.07940.468425
330.0179710.21490.415074
34-0.073165-0.87490.19154
35-0.153792-1.83910.033988
360.5623786.72510
37-0.160484-1.91910.028481
38-0.029984-0.35860.360226
390.0176220.21070.416699
40-0.065221-0.77990.218362
410.0609850.72930.233512
42-0.17313-2.07030.02011
430.0195060.23330.407946
44-0.023928-0.28610.387594
45-0.017689-0.21150.416389
46-0.018939-0.22650.410578
47-0.171529-2.05120.021037
480.5447126.51380


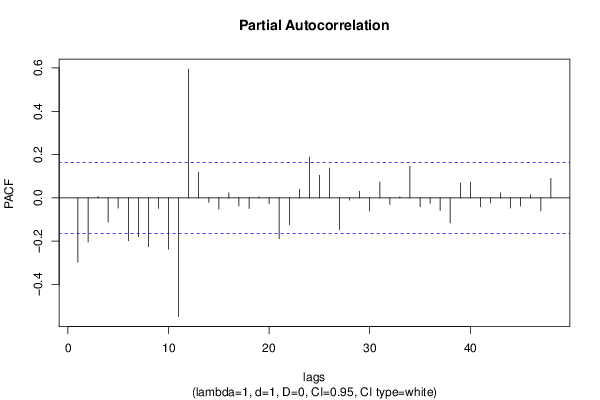
Partial Autocorrelation Function
Time lag kPACF(k)T-STATP-value
1-0.296743-3.54850.000262
2-0.203385-2.43210.008123
30.0066150.07910.468532
4-0.111052-1.3280.093149
5-0.047274-0.56530.286374
6-0.198296-2.37130.00953
7-0.17945-2.14590.016784
8-0.225603-2.69780.00391
9-0.048364-0.57840.281967
10-0.236743-2.8310.002654
11-0.548395-6.55790
120.5953537.11940
130.1186921.41940.078986
14-0.020938-0.25040.401326
15-0.051226-0.61260.270567
160.0230690.27590.391527
17-0.037182-0.44460.328628
18-0.049253-0.5890.278403
190.0045270.05410.47845
20-0.025819-0.30870.378982
21-0.188869-2.25850.012713
22-0.123963-1.48240.070219
230.0400780.47930.316241
240.1888532.25830.012719
250.1043811.24820.106996
260.1381091.65150.050411
27-0.146864-1.75620.040594
28-0.010364-0.12390.450773
290.0310270.3710.355583
30-0.060879-0.7280.2339
310.0728180.87080.192668
32-0.030125-0.36020.3596
330.0051440.06150.475518
340.1460721.74680.041412
35-0.041264-0.49340.311227
36-0.024448-0.29240.38522
37-0.058036-0.6940.2444
38-0.115368-1.37960.084932
390.0684860.8190.207082
400.0728040.87060.192713
41-0.040717-0.48690.313535
42-0.023172-0.27710.391054
430.023670.28310.388774
44-0.047001-0.56210.287481
45-0.037678-0.45060.326493
460.015230.18210.427869
47-0.059741-0.71440.238074
480.0899971.07620.141822

\begin{tabular}{lllllllll}
\hline
Partial Autocorrelation Function \tabularnewline
Time lag k & PACF(k) & T-STAT & P-value \tabularnewline
1 & -0.296743 & -3.5485 & 0.000262 \tabularnewline
2 & -0.203385 & -2.4321 & 0.008123 \tabularnewline
3 & 0.006615 & 0.0791 & 0.468532 \tabularnewline
4 & -0.111052 & -1.328 & 0.093149 \tabularnewline
5 & -0.047274 & -0.5653 & 0.286374 \tabularnewline
6 & -0.198296 & -2.3713 & 0.00953 \tabularnewline
7 & -0.17945 & -2.1459 & 0.016784 \tabularnewline
8 & -0.225603 & -2.6978 & 0.00391 \tabularnewline
9 & -0.048364 & -0.5784 & 0.281967 \tabularnewline
10 & -0.236743 & -2.831 & 0.002654 \tabularnewline
11 & -0.548395 & -6.5579 & 0 \tabularnewline
12 & 0.595353 & 7.1194 & 0 \tabularnewline
13 & 0.118692 & 1.4194 & 0.078986 \tabularnewline
14 & -0.020938 & -0.2504 & 0.401326 \tabularnewline
15 & -0.051226 & -0.6126 & 0.270567 \tabularnewline
16 & 0.023069 & 0.2759 & 0.391527 \tabularnewline
17 & -0.037182 & -0.4446 & 0.328628 \tabularnewline
18 & -0.049253 & -0.589 & 0.278403 \tabularnewline
19 & 0.004527 & 0.0541 & 0.47845 \tabularnewline
20 & -0.025819 & -0.3087 & 0.378982 \tabularnewline
21 & -0.188869 & -2.2585 & 0.012713 \tabularnewline
22 & -0.123963 & -1.4824 & 0.070219 \tabularnewline
23 & 0.040078 & 0.4793 & 0.316241 \tabularnewline
24 & 0.188853 & 2.2583 & 0.012719 \tabularnewline
25 & 0.104381 & 1.2482 & 0.106996 \tabularnewline
26 & 0.138109 & 1.6515 & 0.050411 \tabularnewline
27 & -0.146864 & -1.7562 & 0.040594 \tabularnewline
28 & -0.010364 & -0.1239 & 0.450773 \tabularnewline
29 & 0.031027 & 0.371 & 0.355583 \tabularnewline
30 & -0.060879 & -0.728 & 0.2339 \tabularnewline
31 & 0.072818 & 0.8708 & 0.192668 \tabularnewline
32 & -0.030125 & -0.3602 & 0.3596 \tabularnewline
33 & 0.005144 & 0.0615 & 0.475518 \tabularnewline
34 & 0.146072 & 1.7468 & 0.041412 \tabularnewline
35 & -0.041264 & -0.4934 & 0.311227 \tabularnewline
36 & -0.024448 & -0.2924 & 0.38522 \tabularnewline
37 & -0.058036 & -0.694 & 0.2444 \tabularnewline
38 & -0.115368 & -1.3796 & 0.084932 \tabularnewline
39 & 0.068486 & 0.819 & 0.207082 \tabularnewline
40 & 0.072804 & 0.8706 & 0.192713 \tabularnewline
41 & -0.040717 & -0.4869 & 0.313535 \tabularnewline
42 & -0.023172 & -0.2771 & 0.391054 \tabularnewline
43 & 0.02367 & 0.2831 & 0.388774 \tabularnewline
44 & -0.047001 & -0.5621 & 0.287481 \tabularnewline
45 & -0.037678 & -0.4506 & 0.326493 \tabularnewline
46 & 0.01523 & 0.1821 & 0.427869 \tabularnewline
47 & -0.059741 & -0.7144 & 0.238074 \tabularnewline
48 & 0.089997 & 1.0762 & 0.141822 \tabularnewline
\hline
\end{tabular}
%Source: https://freestatistics.org/blog/index.php?pk=187776&T=2

[TABLE]
[ROW][C]Partial Autocorrelation Function[/C][/ROW]
[ROW][C]Time lag k[/C][C]PACF(k)[/C][C]T-STAT[/C][C]P-value[/C][/ROW]
[ROW][C]1[/C][C]-0.296743[/C][C]-3.5485[/C][C]0.000262[/C][/ROW]
[ROW][C]2[/C][C]-0.203385[/C][C]-2.4321[/C][C]0.008123[/C][/ROW]
[ROW][C]3[/C][C]0.006615[/C][C]0.0791[/C][C]0.468532[/C][/ROW]
[ROW][C]4[/C][C]-0.111052[/C][C]-1.328[/C][C]0.093149[/C][/ROW]
[ROW][C]5[/C][C]-0.047274[/C][C]-0.5653[/C][C]0.286374[/C][/ROW]
[ROW][C]6[/C][C]-0.198296[/C][C]-2.3713[/C][C]0.00953[/C][/ROW]
[ROW][C]7[/C][C]-0.17945[/C][C]-2.1459[/C][C]0.016784[/C][/ROW]
[ROW][C]8[/C][C]-0.225603[/C][C]-2.6978[/C][C]0.00391[/C][/ROW]
[ROW][C]9[/C][C]-0.048364[/C][C]-0.5784[/C][C]0.281967[/C][/ROW]
[ROW][C]10[/C][C]-0.236743[/C][C]-2.831[/C][C]0.002654[/C][/ROW]
[ROW][C]11[/C][C]-0.548395[/C][C]-6.5579[/C][C]0[/C][/ROW]
[ROW][C]12[/C][C]0.595353[/C][C]7.1194[/C][C]0[/C][/ROW]
[ROW][C]13[/C][C]0.118692[/C][C]1.4194[/C][C]0.078986[/C][/ROW]
[ROW][C]14[/C][C]-0.020938[/C][C]-0.2504[/C][C]0.401326[/C][/ROW]
[ROW][C]15[/C][C]-0.051226[/C][C]-0.6126[/C][C]0.270567[/C][/ROW]
[ROW][C]16[/C][C]0.023069[/C][C]0.2759[/C][C]0.391527[/C][/ROW]
[ROW][C]17[/C][C]-0.037182[/C][C]-0.4446[/C][C]0.328628[/C][/ROW]
[ROW][C]18[/C][C]-0.049253[/C][C]-0.589[/C][C]0.278403[/C][/ROW]
[ROW][C]19[/C][C]0.004527[/C][C]0.0541[/C][C]0.47845[/C][/ROW]
[ROW][C]20[/C][C]-0.025819[/C][C]-0.3087[/C][C]0.378982[/C][/ROW]
[ROW][C]21[/C][C]-0.188869[/C][C]-2.2585[/C][C]0.012713[/C][/ROW]
[ROW][C]22[/C][C]-0.123963[/C][C]-1.4824[/C][C]0.070219[/C][/ROW]
[ROW][C]23[/C][C]0.040078[/C][C]0.4793[/C][C]0.316241[/C][/ROW]
[ROW][C]24[/C][C]0.188853[/C][C]2.2583[/C][C]0.012719[/C][/ROW]
[ROW][C]25[/C][C]0.104381[/C][C]1.2482[/C][C]0.106996[/C][/ROW]
[ROW][C]26[/C][C]0.138109[/C][C]1.6515[/C][C]0.050411[/C][/ROW]
[ROW][C]27[/C][C]-0.146864[/C][C]-1.7562[/C][C]0.040594[/C][/ROW]
[ROW][C]28[/C][C]-0.010364[/C][C]-0.1239[/C][C]0.450773[/C][/ROW]
[ROW][C]29[/C][C]0.031027[/C][C]0.371[/C][C]0.355583[/C][/ROW]
[ROW][C]30[/C][C]-0.060879[/C][C]-0.728[/C][C]0.2339[/C][/ROW]
[ROW][C]31[/C][C]0.072818[/C][C]0.8708[/C][C]0.192668[/C][/ROW]
[ROW][C]32[/C][C]-0.030125[/C][C]-0.3602[/C][C]0.3596[/C][/ROW]
[ROW][C]33[/C][C]0.005144[/C][C]0.0615[/C][C]0.475518[/C][/ROW]
[ROW][C]34[/C][C]0.146072[/C][C]1.7468[/C][C]0.041412[/C][/ROW]
[ROW][C]35[/C][C]-0.041264[/C][C]-0.4934[/C][C]0.311227[/C][/ROW]
[ROW][C]36[/C][C]-0.024448[/C][C]-0.2924[/C][C]0.38522[/C][/ROW]
[ROW][C]37[/C][C]-0.058036[/C][C]-0.694[/C][C]0.2444[/C][/ROW]
[ROW][C]38[/C][C]-0.115368[/C][C]-1.3796[/C][C]0.084932[/C][/ROW]
[ROW][C]39[/C][C]0.068486[/C][C]0.819[/C][C]0.207082[/C][/ROW]
[ROW][C]40[/C][C]0.072804[/C][C]0.8706[/C][C]0.192713[/C][/ROW]
[ROW][C]41[/C][C]-0.040717[/C][C]-0.4869[/C][C]0.313535[/C][/ROW]
[ROW][C]42[/C][C]-0.023172[/C][C]-0.2771[/C][C]0.391054[/C][/ROW]
[ROW][C]43[/C][C]0.02367[/C][C]0.2831[/C][C]0.388774[/C][/ROW]
[ROW][C]44[/C][C]-0.047001[/C][C]-0.5621[/C][C]0.287481[/C][/ROW]
[ROW][C]45[/C][C]-0.037678[/C][C]-0.4506[/C][C]0.326493[/C][/ROW]
[ROW][C]46[/C][C]0.01523[/C][C]0.1821[/C][C]0.427869[/C][/ROW]
[ROW][C]47[/C][C]-0.059741[/C][C]-0.7144[/C][C]0.238074[/C][/ROW]
[ROW][C]48[/C][C]0.089997[/C][C]1.0762[/C][C]0.141822[/C][/ROW]
[/TABLE]
Source: https://freestatistics.org/blog/index.php?pk=187776&T=2

Globally Unique Identifier (entire table): ba.freestatistics.org/blog/index.php?pk=187776&T=2

As an alternative you can also use a QR Code:  

The GUIDs for individual cells are displayed in the table below:

Partial Autocorrelation Function
Time lag kPACF(k)T-STATP-value
1-0.296743-3.54850.000262
2-0.203385-2.43210.008123
30.0066150.07910.468532
4-0.111052-1.3280.093149
5-0.047274-0.56530.286374
6-0.198296-2.37130.00953
7-0.17945-2.14590.016784
8-0.225603-2.69780.00391
9-0.048364-0.57840.281967
10-0.236743-2.8310.002654
11-0.548395-6.55790
120.5953537.11940
130.1186921.41940.078986
14-0.020938-0.25040.401326
15-0.051226-0.61260.270567
160.0230690.27590.391527
17-0.037182-0.44460.328628
18-0.049253-0.5890.278403
190.0045270.05410.47845
20-0.025819-0.30870.378982
21-0.188869-2.25850.012713
22-0.123963-1.48240.070219
230.0400780.47930.316241
240.1888532.25830.012719
250.1043811.24820.106996
260.1381091.65150.050411
27-0.146864-1.75620.040594
28-0.010364-0.12390.450773
290.0310270.3710.355583
30-0.060879-0.7280.2339
310.0728180.87080.192668
32-0.030125-0.36020.3596
330.0051440.06150.475518
340.1460721.74680.041412
35-0.041264-0.49340.311227
36-0.024448-0.29240.38522
37-0.058036-0.6940.2444
38-0.115368-1.37960.084932
390.0684860.8190.207082
400.0728040.87060.192713
41-0.040717-0.48690.313535
42-0.023172-0.27710.391054
430.023670.28310.388774
44-0.047001-0.56210.287481
45-0.037678-0.45060.326493
460.015230.18210.427869
47-0.059741-0.71440.238074
480.0899971.07620.141822


Parameters (Session):
par1 = 48 ; par2 = 1.0 ; par3 = 1 ; par4 = 0 ; par5 = 12 ; par6 = White Noise ; par7 = 0.95 ;
Parameters (R input):
par1 = 48 ; par2 = 1.0 ; par3 = 1 ; par4 = 0 ; par5 = 12 ; par6 = White Noise ; par7 = 0.95 ; par8 = ;
R code (references can be found in the software module):
if (par1 == 'Default') {
par1 = 10*log10(length(x))
} else {
par1 <- as.numeric(par1)
}
par2 <- as.numeric(par2)
par3 <- as.numeric(par3)
par4 <- as.numeric(par4)
par5 <- as.numeric(par5)
if (par6 == 'White Noise') par6 <- 'white' else par6 <- 'ma'
par7 <- as.numeric(par7)
if (par8 != '') par8 <- as.numeric(par8)
ox <- x
if (par8 == '') {
if (par2 == 0) {
x <- log(x)
} else {
x <- (x ^ par2 - 1) / par2
}
} else {
x <- log(x,base=par8)
}
if (par3 > 0) x <- diff(x,lag=1,difference=par3)
if (par4 > 0) x <- diff(x,lag=par5,difference=par4)
bitmap(file='picts.png')
op <- par(mfrow=c(2,1))
plot(ox,type='l',main='Original Time Series',xlab='time',ylab='value')
if (par8=='') {
mytitle <- paste('Working Time Series (lambda=',par2,', d=',par3,', D=',par4,')',sep='')
mysub <- paste('(lambda=',par2,', d=',par3,', D=',par4,', CI=', par7, ', CI type=',par6,')',sep='')
} else {
mytitle <- paste('Working Time Series (base=',par8,', d=',par3,', D=',par4,')',sep='')
mysub <- paste('(base=',par8,', d=',par3,', D=',par4,', CI=', par7, ', CI type=',par6,')',sep='')
}
plot(x,type='l', main=mytitle,xlab='time',ylab='value')
par(op)
dev.off()
bitmap(file='pic1.png')
racf <- acf(x, par1, main='Autocorrelation', xlab='time lag', ylab='ACF', ci.type=par6, ci=par7, sub=mysub)
dev.off()
bitmap(file='pic2.png')
rpacf <- pacf(x,par1,main='Partial Autocorrelation',xlab='lags',ylab='PACF',sub=mysub)
dev.off()
(myacf <- c(racf$acf))
(mypacf <- c(rpacf$acf))
lengthx <- length(x)
sqrtn <- sqrt(lengthx)
load(file='createtable')
a<-table.start()
a<-table.row.start(a)
a<-table.element(a,'Autocorrelation Function',4,TRUE)
a<-table.row.end(a)
a<-table.row.start(a)
a<-table.element(a,'Time lag k',header=TRUE)
a<-table.element(a,hyperlink('basics.htm','ACF(k)','click here for more information about the Autocorrelation Function'),header=TRUE)
a<-table.element(a,'T-STAT',header=TRUE)
a<-table.element(a,'P-value',header=TRUE)
a<-table.row.end(a)
for (i in 2:(par1+1)) {
a<-table.row.start(a)
a<-table.element(a,i-1,header=TRUE)
a<-table.element(a,round(myacf[i],6))
mytstat <- myacf[i]*sqrtn
a<-table.element(a,round(mytstat,4))
a<-table.element(a,round(1-pt(abs(mytstat),lengthx),6))
a<-table.row.end(a)
}
a<-table.end(a)
table.save(a,file='mytable.tab')
a<-table.start()
a<-table.row.start(a)
a<-table.element(a,'Partial Autocorrelation Function',4,TRUE)
a<-table.row.end(a)
a<-table.row.start(a)
a<-table.element(a,'Time lag k',header=TRUE)
a<-table.element(a,hyperlink('basics.htm','PACF(k)','click here for more information about the Partial Autocorrelation Function'),header=TRUE)
a<-table.element(a,'T-STAT',header=TRUE)
a<-table.element(a,'P-value',header=TRUE)
a<-table.row.end(a)
for (i in 1:par1) {
a<-table.row.start(a)
a<-table.element(a,i,header=TRUE)
a<-table.element(a,round(mypacf[i],6))
mytstat <- mypacf[i]*sqrtn
a<-table.element(a,round(mytstat,4))
a<-table.element(a,round(1-pt(abs(mytstat),lengthx),6))
a<-table.row.end(a)
}
a<-table.end(a)
table.save(a,file='mytable1.tab')