Free Statistics

of Irreproducible Research!

Author's title

Author*Unverified author*
R Software Modulerwasp_autocorrelation.wasp
Title produced by software(Partial) Autocorrelation Function
Date of computationMon, 12 Nov 2012 04:00:35 -0500
Cite this page as followsStatistical Computations at FreeStatistics.org, Office for Research Development and Education, URL https://freestatistics.org/blog/index.php?v=date/2012/Nov/12/t13527108504wmm1vzqw5l9r86.htm/, Retrieved Mon, 29 Apr 2024 04:02:14 +0000
Statistical Computations at FreeStatistics.org, Office for Research Development and Education, URL https://freestatistics.org/blog/index.php?pk=187697, Retrieved Mon, 29 Apr 2024 04:02:14 +0000
QR Codes:

Original text written by user:
IsPrivate?No (this computation is public)
User-defined keywords
Estimated Impact94
Family? (F = Feedback message, R = changed R code, M = changed R Module, P = changed Parameters, D = changed Data)
-     [(Partial) Autocorrelation Function] [] [2012-11-12 08:51:34] [9b490dd2ab715f1b5bf65aa31d98df3d]
-    D    [(Partial) Autocorrelation Function] [] [2012-11-12 09:00:35] [38a0db91cd47487c7649642dcb33e029] [Current]
Feedback Forum

Post a new message
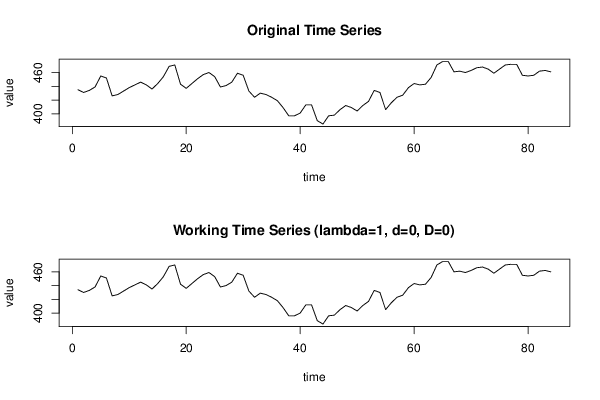
Dataseries X:
435
431
434
439
455
452
426
428
433
438
442
446
442
436
444
454
469
471
443
437
444
451
457
460
454
439
441
446
459
456
433
424
430
428
424
419
409
397
397
401
413
413
390
385
397
398
406
412
409
404
412
418
434
431
406
416
424
427
438
444
442
443
453
471
476
476
461
462
460
463
467
468
465
459
465
471
472
472
456
455
456
462
463
461


Summary of computational transaction
Raw Inputview raw input (R code)
Raw Outputview raw output of R engine
Computing time4 seconds
R Server'Gwilym Jenkins' @ jenkins.wessa.net

\begin{tabular}{lllllllll}
\hline
Summary of computational transaction \tabularnewline
Raw Input & view raw input (R code)  \tabularnewline
Raw Output & view raw output of R engine  \tabularnewline
Computing time & 4 seconds \tabularnewline
R Server & 'Gwilym Jenkins' @ jenkins.wessa.net \tabularnewline
\hline
\end{tabular}
%Source: https://freestatistics.org/blog/index.php?pk=187697&T=0

[TABLE]
[ROW][C]Summary of computational transaction[/C][/ROW]
[ROW][C]Raw Input[/C][C]view raw input (R code) [/C][/ROW]
[ROW][C]Raw Output[/C][C]view raw output of R engine [/C][/ROW]
[ROW][C]Computing time[/C][C]4 seconds[/C][/ROW]
[ROW][C]R Server[/C][C]'Gwilym Jenkins' @ jenkins.wessa.net[/C][/ROW]
[/TABLE]
Source: https://freestatistics.org/blog/index.php?pk=187697&T=0

Globally Unique Identifier (entire table): ba.freestatistics.org/blog/index.php?pk=187697&T=0

As an alternative you can also use a QR Code:  

The GUIDs for individual cells are displayed in the table below:

Summary of computational transaction
Raw Inputview raw input (R code)
Raw Outputview raw output of R engine
Computing time4 seconds
R Server'Gwilym Jenkins' @ jenkins.wessa.net


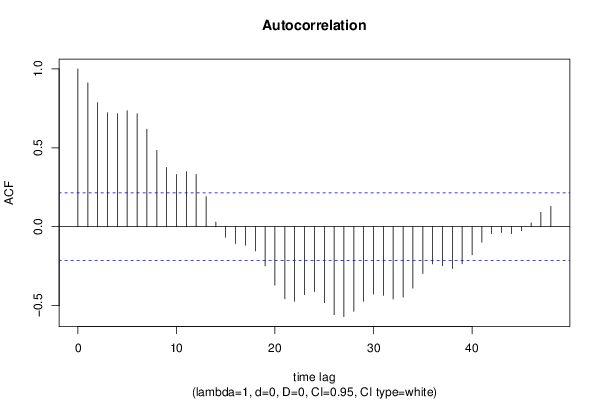
Autocorrelation Function
Time lag kACF(k)T-STATP-value
10.9118128.35690
20.7867477.21070
30.7228356.62490
40.7156786.55930
50.7352176.73840
60.7162776.56480
70.6183785.66750
80.4838094.43421.4e-05
90.3759333.44550.000446
100.331583.0390.001582
110.3488053.19680.000979
120.3316213.03940.00158
130.1910031.75060.041836
140.0302150.27690.391259
15-0.066904-0.61320.270707
16-0.106696-0.97790.16547
17-0.11723-1.07440.142853
18-0.153049-1.40270.082194
19-0.248443-2.2770.012664
20-0.370452-3.39530.000525
21-0.45651-4.1843.5e-05
22-0.472046-4.32642.1e-05
23-0.43062-3.94678.2e-05
24-0.411088-3.76770.000153
25-0.480989-4.40831.5e-05
26-0.557071-5.10561e-06
27-0.569997-5.22411e-06
28-0.535758-4.91032e-06
29-0.472294-4.32862.1e-05
30-0.427459-3.91779.1e-05
31-0.434477-3.9827.2e-05
32-0.458386-4.20123.3e-05
33-0.446286-4.09034.9e-05
34-0.389477-3.56960.000297
35-0.296829-2.72050.003961
36-0.235383-2.15730.016919
37-0.247754-2.27070.012862
38-0.264438-2.42360.008757
39-0.23515-2.15520.017005
40-0.177258-1.62460.053998
41-0.09861-0.90380.184349
42-0.044702-0.40970.341534
43-0.036637-0.33580.368936
44-0.043765-0.40110.344679
45-0.025986-0.23820.406168
460.0243970.22360.411806
470.091210.83590.202777
480.1300051.19150.118403

\begin{tabular}{lllllllll}
\hline
Autocorrelation Function \tabularnewline
Time lag k & ACF(k) & T-STAT & P-value \tabularnewline
1 & 0.911812 & 8.3569 & 0 \tabularnewline
2 & 0.786747 & 7.2107 & 0 \tabularnewline
3 & 0.722835 & 6.6249 & 0 \tabularnewline
4 & 0.715678 & 6.5593 & 0 \tabularnewline
5 & 0.735217 & 6.7384 & 0 \tabularnewline
6 & 0.716277 & 6.5648 & 0 \tabularnewline
7 & 0.618378 & 5.6675 & 0 \tabularnewline
8 & 0.483809 & 4.4342 & 1.4e-05 \tabularnewline
9 & 0.375933 & 3.4455 & 0.000446 \tabularnewline
10 & 0.33158 & 3.039 & 0.001582 \tabularnewline
11 & 0.348805 & 3.1968 & 0.000979 \tabularnewline
12 & 0.331621 & 3.0394 & 0.00158 \tabularnewline
13 & 0.191003 & 1.7506 & 0.041836 \tabularnewline
14 & 0.030215 & 0.2769 & 0.391259 \tabularnewline
15 & -0.066904 & -0.6132 & 0.270707 \tabularnewline
16 & -0.106696 & -0.9779 & 0.16547 \tabularnewline
17 & -0.11723 & -1.0744 & 0.142853 \tabularnewline
18 & -0.153049 & -1.4027 & 0.082194 \tabularnewline
19 & -0.248443 & -2.277 & 0.012664 \tabularnewline
20 & -0.370452 & -3.3953 & 0.000525 \tabularnewline
21 & -0.45651 & -4.184 & 3.5e-05 \tabularnewline
22 & -0.472046 & -4.3264 & 2.1e-05 \tabularnewline
23 & -0.43062 & -3.9467 & 8.2e-05 \tabularnewline
24 & -0.411088 & -3.7677 & 0.000153 \tabularnewline
25 & -0.480989 & -4.4083 & 1.5e-05 \tabularnewline
26 & -0.557071 & -5.1056 & 1e-06 \tabularnewline
27 & -0.569997 & -5.2241 & 1e-06 \tabularnewline
28 & -0.535758 & -4.9103 & 2e-06 \tabularnewline
29 & -0.472294 & -4.3286 & 2.1e-05 \tabularnewline
30 & -0.427459 & -3.9177 & 9.1e-05 \tabularnewline
31 & -0.434477 & -3.982 & 7.2e-05 \tabularnewline
32 & -0.458386 & -4.2012 & 3.3e-05 \tabularnewline
33 & -0.446286 & -4.0903 & 4.9e-05 \tabularnewline
34 & -0.389477 & -3.5696 & 0.000297 \tabularnewline
35 & -0.296829 & -2.7205 & 0.003961 \tabularnewline
36 & -0.235383 & -2.1573 & 0.016919 \tabularnewline
37 & -0.247754 & -2.2707 & 0.012862 \tabularnewline
38 & -0.264438 & -2.4236 & 0.008757 \tabularnewline
39 & -0.23515 & -2.1552 & 0.017005 \tabularnewline
40 & -0.177258 & -1.6246 & 0.053998 \tabularnewline
41 & -0.09861 & -0.9038 & 0.184349 \tabularnewline
42 & -0.044702 & -0.4097 & 0.341534 \tabularnewline
43 & -0.036637 & -0.3358 & 0.368936 \tabularnewline
44 & -0.043765 & -0.4011 & 0.344679 \tabularnewline
45 & -0.025986 & -0.2382 & 0.406168 \tabularnewline
46 & 0.024397 & 0.2236 & 0.411806 \tabularnewline
47 & 0.09121 & 0.8359 & 0.202777 \tabularnewline
48 & 0.130005 & 1.1915 & 0.118403 \tabularnewline
\hline
\end{tabular}
%Source: https://freestatistics.org/blog/index.php?pk=187697&T=1

[TABLE]
[ROW][C]Autocorrelation Function[/C][/ROW]
[ROW][C]Time lag k[/C][C]ACF(k)[/C][C]T-STAT[/C][C]P-value[/C][/ROW]
[ROW][C]1[/C][C]0.911812[/C][C]8.3569[/C][C]0[/C][/ROW]
[ROW][C]2[/C][C]0.786747[/C][C]7.2107[/C][C]0[/C][/ROW]
[ROW][C]3[/C][C]0.722835[/C][C]6.6249[/C][C]0[/C][/ROW]
[ROW][C]4[/C][C]0.715678[/C][C]6.5593[/C][C]0[/C][/ROW]
[ROW][C]5[/C][C]0.735217[/C][C]6.7384[/C][C]0[/C][/ROW]
[ROW][C]6[/C][C]0.716277[/C][C]6.5648[/C][C]0[/C][/ROW]
[ROW][C]7[/C][C]0.618378[/C][C]5.6675[/C][C]0[/C][/ROW]
[ROW][C]8[/C][C]0.483809[/C][C]4.4342[/C][C]1.4e-05[/C][/ROW]
[ROW][C]9[/C][C]0.375933[/C][C]3.4455[/C][C]0.000446[/C][/ROW]
[ROW][C]10[/C][C]0.33158[/C][C]3.039[/C][C]0.001582[/C][/ROW]
[ROW][C]11[/C][C]0.348805[/C][C]3.1968[/C][C]0.000979[/C][/ROW]
[ROW][C]12[/C][C]0.331621[/C][C]3.0394[/C][C]0.00158[/C][/ROW]
[ROW][C]13[/C][C]0.191003[/C][C]1.7506[/C][C]0.041836[/C][/ROW]
[ROW][C]14[/C][C]0.030215[/C][C]0.2769[/C][C]0.391259[/C][/ROW]
[ROW][C]15[/C][C]-0.066904[/C][C]-0.6132[/C][C]0.270707[/C][/ROW]
[ROW][C]16[/C][C]-0.106696[/C][C]-0.9779[/C][C]0.16547[/C][/ROW]
[ROW][C]17[/C][C]-0.11723[/C][C]-1.0744[/C][C]0.142853[/C][/ROW]
[ROW][C]18[/C][C]-0.153049[/C][C]-1.4027[/C][C]0.082194[/C][/ROW]
[ROW][C]19[/C][C]-0.248443[/C][C]-2.277[/C][C]0.012664[/C][/ROW]
[ROW][C]20[/C][C]-0.370452[/C][C]-3.3953[/C][C]0.000525[/C][/ROW]
[ROW][C]21[/C][C]-0.45651[/C][C]-4.184[/C][C]3.5e-05[/C][/ROW]
[ROW][C]22[/C][C]-0.472046[/C][C]-4.3264[/C][C]2.1e-05[/C][/ROW]
[ROW][C]23[/C][C]-0.43062[/C][C]-3.9467[/C][C]8.2e-05[/C][/ROW]
[ROW][C]24[/C][C]-0.411088[/C][C]-3.7677[/C][C]0.000153[/C][/ROW]
[ROW][C]25[/C][C]-0.480989[/C][C]-4.4083[/C][C]1.5e-05[/C][/ROW]
[ROW][C]26[/C][C]-0.557071[/C][C]-5.1056[/C][C]1e-06[/C][/ROW]
[ROW][C]27[/C][C]-0.569997[/C][C]-5.2241[/C][C]1e-06[/C][/ROW]
[ROW][C]28[/C][C]-0.535758[/C][C]-4.9103[/C][C]2e-06[/C][/ROW]
[ROW][C]29[/C][C]-0.472294[/C][C]-4.3286[/C][C]2.1e-05[/C][/ROW]
[ROW][C]30[/C][C]-0.427459[/C][C]-3.9177[/C][C]9.1e-05[/C][/ROW]
[ROW][C]31[/C][C]-0.434477[/C][C]-3.982[/C][C]7.2e-05[/C][/ROW]
[ROW][C]32[/C][C]-0.458386[/C][C]-4.2012[/C][C]3.3e-05[/C][/ROW]
[ROW][C]33[/C][C]-0.446286[/C][C]-4.0903[/C][C]4.9e-05[/C][/ROW]
[ROW][C]34[/C][C]-0.389477[/C][C]-3.5696[/C][C]0.000297[/C][/ROW]
[ROW][C]35[/C][C]-0.296829[/C][C]-2.7205[/C][C]0.003961[/C][/ROW]
[ROW][C]36[/C][C]-0.235383[/C][C]-2.1573[/C][C]0.016919[/C][/ROW]
[ROW][C]37[/C][C]-0.247754[/C][C]-2.2707[/C][C]0.012862[/C][/ROW]
[ROW][C]38[/C][C]-0.264438[/C][C]-2.4236[/C][C]0.008757[/C][/ROW]
[ROW][C]39[/C][C]-0.23515[/C][C]-2.1552[/C][C]0.017005[/C][/ROW]
[ROW][C]40[/C][C]-0.177258[/C][C]-1.6246[/C][C]0.053998[/C][/ROW]
[ROW][C]41[/C][C]-0.09861[/C][C]-0.9038[/C][C]0.184349[/C][/ROW]
[ROW][C]42[/C][C]-0.044702[/C][C]-0.4097[/C][C]0.341534[/C][/ROW]
[ROW][C]43[/C][C]-0.036637[/C][C]-0.3358[/C][C]0.368936[/C][/ROW]
[ROW][C]44[/C][C]-0.043765[/C][C]-0.4011[/C][C]0.344679[/C][/ROW]
[ROW][C]45[/C][C]-0.025986[/C][C]-0.2382[/C][C]0.406168[/C][/ROW]
[ROW][C]46[/C][C]0.024397[/C][C]0.2236[/C][C]0.411806[/C][/ROW]
[ROW][C]47[/C][C]0.09121[/C][C]0.8359[/C][C]0.202777[/C][/ROW]
[ROW][C]48[/C][C]0.130005[/C][C]1.1915[/C][C]0.118403[/C][/ROW]
[/TABLE]
Source: https://freestatistics.org/blog/index.php?pk=187697&T=1

Globally Unique Identifier (entire table): ba.freestatistics.org/blog/index.php?pk=187697&T=1

As an alternative you can also use a QR Code:  

The GUIDs for individual cells are displayed in the table below:

Autocorrelation Function
Time lag kACF(k)T-STATP-value
10.9118128.35690
20.7867477.21070
30.7228356.62490
40.7156786.55930
50.7352176.73840
60.7162776.56480
70.6183785.66750
80.4838094.43421.4e-05
90.3759333.44550.000446
100.331583.0390.001582
110.3488053.19680.000979
120.3316213.03940.00158
130.1910031.75060.041836
140.0302150.27690.391259
15-0.066904-0.61320.270707
16-0.106696-0.97790.16547
17-0.11723-1.07440.142853
18-0.153049-1.40270.082194
19-0.248443-2.2770.012664
20-0.370452-3.39530.000525
21-0.45651-4.1843.5e-05
22-0.472046-4.32642.1e-05
23-0.43062-3.94678.2e-05
24-0.411088-3.76770.000153
25-0.480989-4.40831.5e-05
26-0.557071-5.10561e-06
27-0.569997-5.22411e-06
28-0.535758-4.91032e-06
29-0.472294-4.32862.1e-05
30-0.427459-3.91779.1e-05
31-0.434477-3.9827.2e-05
32-0.458386-4.20123.3e-05
33-0.446286-4.09034.9e-05
34-0.389477-3.56960.000297
35-0.296829-2.72050.003961
36-0.235383-2.15730.016919
37-0.247754-2.27070.012862
38-0.264438-2.42360.008757
39-0.23515-2.15520.017005
40-0.177258-1.62460.053998
41-0.09861-0.90380.184349
42-0.044702-0.40970.341534
43-0.036637-0.33580.368936
44-0.043765-0.40110.344679
45-0.025986-0.23820.406168
460.0243970.22360.411806
470.091210.83590.202777
480.1300051.19150.118403


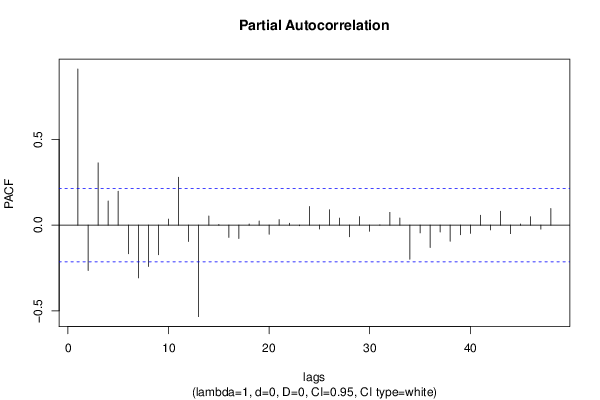
Partial Autocorrelation Function
Time lag kPACF(k)T-STATP-value
10.9118128.35690
2-0.264854-2.42740.008672
30.3633863.33050.000645
40.1412051.29420.099578
50.1980121.81480.036561
6-0.167367-1.53390.064401
7-0.308148-2.82420.002959
8-0.241044-2.20920.014941
9-0.173231-1.58770.058057
100.0353370.32390.373421
110.2793662.56040.006122
12-0.095613-0.87630.191682
13-0.534244-4.89642e-06
140.053660.49180.312072
150.0041110.03770.485018
16-0.071374-0.65410.257401
17-0.077957-0.71450.238452
180.0062970.05770.477059
190.0246650.22610.410853
20-0.052998-0.48570.314209
210.0323440.29640.383816
220.0108390.09930.460553
23-0.003193-0.02930.488361
240.1089060.99810.160539
25-0.022893-0.20980.41716
260.0895450.82070.207073
270.0410430.37620.353871
28-0.067356-0.61730.269344
290.0497640.45610.324749
30-0.035287-0.32340.373594
31-0.001221-0.01120.49555
320.0746550.68420.247858
330.0416790.3820.351714
34-0.199122-1.8250.035779
35-0.045431-0.41640.339095
36-0.130597-1.19690.117349
37-0.039942-0.36610.357614
38-0.093938-0.8610.195856
39-0.056567-0.51840.302756
40-0.048011-0.440.330524
410.0580650.53220.298005
42-0.027945-0.25610.399243
430.0813390.74550.229031
44-0.04957-0.45430.325385
450.006430.05890.476572
460.0490630.44970.327052
47-0.02346-0.2150.415137
480.096740.88660.188903

\begin{tabular}{lllllllll}
\hline
Partial Autocorrelation Function \tabularnewline
Time lag k & PACF(k) & T-STAT & P-value \tabularnewline
1 & 0.911812 & 8.3569 & 0 \tabularnewline
2 & -0.264854 & -2.4274 & 0.008672 \tabularnewline
3 & 0.363386 & 3.3305 & 0.000645 \tabularnewline
4 & 0.141205 & 1.2942 & 0.099578 \tabularnewline
5 & 0.198012 & 1.8148 & 0.036561 \tabularnewline
6 & -0.167367 & -1.5339 & 0.064401 \tabularnewline
7 & -0.308148 & -2.8242 & 0.002959 \tabularnewline
8 & -0.241044 & -2.2092 & 0.014941 \tabularnewline
9 & -0.173231 & -1.5877 & 0.058057 \tabularnewline
10 & 0.035337 & 0.3239 & 0.373421 \tabularnewline
11 & 0.279366 & 2.5604 & 0.006122 \tabularnewline
12 & -0.095613 & -0.8763 & 0.191682 \tabularnewline
13 & -0.534244 & -4.8964 & 2e-06 \tabularnewline
14 & 0.05366 & 0.4918 & 0.312072 \tabularnewline
15 & 0.004111 & 0.0377 & 0.485018 \tabularnewline
16 & -0.071374 & -0.6541 & 0.257401 \tabularnewline
17 & -0.077957 & -0.7145 & 0.238452 \tabularnewline
18 & 0.006297 & 0.0577 & 0.477059 \tabularnewline
19 & 0.024665 & 0.2261 & 0.410853 \tabularnewline
20 & -0.052998 & -0.4857 & 0.314209 \tabularnewline
21 & 0.032344 & 0.2964 & 0.383816 \tabularnewline
22 & 0.010839 & 0.0993 & 0.460553 \tabularnewline
23 & -0.003193 & -0.0293 & 0.488361 \tabularnewline
24 & 0.108906 & 0.9981 & 0.160539 \tabularnewline
25 & -0.022893 & -0.2098 & 0.41716 \tabularnewline
26 & 0.089545 & 0.8207 & 0.207073 \tabularnewline
27 & 0.041043 & 0.3762 & 0.353871 \tabularnewline
28 & -0.067356 & -0.6173 & 0.269344 \tabularnewline
29 & 0.049764 & 0.4561 & 0.324749 \tabularnewline
30 & -0.035287 & -0.3234 & 0.373594 \tabularnewline
31 & -0.001221 & -0.0112 & 0.49555 \tabularnewline
32 & 0.074655 & 0.6842 & 0.247858 \tabularnewline
33 & 0.041679 & 0.382 & 0.351714 \tabularnewline
34 & -0.199122 & -1.825 & 0.035779 \tabularnewline
35 & -0.045431 & -0.4164 & 0.339095 \tabularnewline
36 & -0.130597 & -1.1969 & 0.117349 \tabularnewline
37 & -0.039942 & -0.3661 & 0.357614 \tabularnewline
38 & -0.093938 & -0.861 & 0.195856 \tabularnewline
39 & -0.056567 & -0.5184 & 0.302756 \tabularnewline
40 & -0.048011 & -0.44 & 0.330524 \tabularnewline
41 & 0.058065 & 0.5322 & 0.298005 \tabularnewline
42 & -0.027945 & -0.2561 & 0.399243 \tabularnewline
43 & 0.081339 & 0.7455 & 0.229031 \tabularnewline
44 & -0.04957 & -0.4543 & 0.325385 \tabularnewline
45 & 0.00643 & 0.0589 & 0.476572 \tabularnewline
46 & 0.049063 & 0.4497 & 0.327052 \tabularnewline
47 & -0.02346 & -0.215 & 0.415137 \tabularnewline
48 & 0.09674 & 0.8866 & 0.188903 \tabularnewline
\hline
\end{tabular}
%Source: https://freestatistics.org/blog/index.php?pk=187697&T=2

[TABLE]
[ROW][C]Partial Autocorrelation Function[/C][/ROW]
[ROW][C]Time lag k[/C][C]PACF(k)[/C][C]T-STAT[/C][C]P-value[/C][/ROW]
[ROW][C]1[/C][C]0.911812[/C][C]8.3569[/C][C]0[/C][/ROW]
[ROW][C]2[/C][C]-0.264854[/C][C]-2.4274[/C][C]0.008672[/C][/ROW]
[ROW][C]3[/C][C]0.363386[/C][C]3.3305[/C][C]0.000645[/C][/ROW]
[ROW][C]4[/C][C]0.141205[/C][C]1.2942[/C][C]0.099578[/C][/ROW]
[ROW][C]5[/C][C]0.198012[/C][C]1.8148[/C][C]0.036561[/C][/ROW]
[ROW][C]6[/C][C]-0.167367[/C][C]-1.5339[/C][C]0.064401[/C][/ROW]
[ROW][C]7[/C][C]-0.308148[/C][C]-2.8242[/C][C]0.002959[/C][/ROW]
[ROW][C]8[/C][C]-0.241044[/C][C]-2.2092[/C][C]0.014941[/C][/ROW]
[ROW][C]9[/C][C]-0.173231[/C][C]-1.5877[/C][C]0.058057[/C][/ROW]
[ROW][C]10[/C][C]0.035337[/C][C]0.3239[/C][C]0.373421[/C][/ROW]
[ROW][C]11[/C][C]0.279366[/C][C]2.5604[/C][C]0.006122[/C][/ROW]
[ROW][C]12[/C][C]-0.095613[/C][C]-0.8763[/C][C]0.191682[/C][/ROW]
[ROW][C]13[/C][C]-0.534244[/C][C]-4.8964[/C][C]2e-06[/C][/ROW]
[ROW][C]14[/C][C]0.05366[/C][C]0.4918[/C][C]0.312072[/C][/ROW]
[ROW][C]15[/C][C]0.004111[/C][C]0.0377[/C][C]0.485018[/C][/ROW]
[ROW][C]16[/C][C]-0.071374[/C][C]-0.6541[/C][C]0.257401[/C][/ROW]
[ROW][C]17[/C][C]-0.077957[/C][C]-0.7145[/C][C]0.238452[/C][/ROW]
[ROW][C]18[/C][C]0.006297[/C][C]0.0577[/C][C]0.477059[/C][/ROW]
[ROW][C]19[/C][C]0.024665[/C][C]0.2261[/C][C]0.410853[/C][/ROW]
[ROW][C]20[/C][C]-0.052998[/C][C]-0.4857[/C][C]0.314209[/C][/ROW]
[ROW][C]21[/C][C]0.032344[/C][C]0.2964[/C][C]0.383816[/C][/ROW]
[ROW][C]22[/C][C]0.010839[/C][C]0.0993[/C][C]0.460553[/C][/ROW]
[ROW][C]23[/C][C]-0.003193[/C][C]-0.0293[/C][C]0.488361[/C][/ROW]
[ROW][C]24[/C][C]0.108906[/C][C]0.9981[/C][C]0.160539[/C][/ROW]
[ROW][C]25[/C][C]-0.022893[/C][C]-0.2098[/C][C]0.41716[/C][/ROW]
[ROW][C]26[/C][C]0.089545[/C][C]0.8207[/C][C]0.207073[/C][/ROW]
[ROW][C]27[/C][C]0.041043[/C][C]0.3762[/C][C]0.353871[/C][/ROW]
[ROW][C]28[/C][C]-0.067356[/C][C]-0.6173[/C][C]0.269344[/C][/ROW]
[ROW][C]29[/C][C]0.049764[/C][C]0.4561[/C][C]0.324749[/C][/ROW]
[ROW][C]30[/C][C]-0.035287[/C][C]-0.3234[/C][C]0.373594[/C][/ROW]
[ROW][C]31[/C][C]-0.001221[/C][C]-0.0112[/C][C]0.49555[/C][/ROW]
[ROW][C]32[/C][C]0.074655[/C][C]0.6842[/C][C]0.247858[/C][/ROW]
[ROW][C]33[/C][C]0.041679[/C][C]0.382[/C][C]0.351714[/C][/ROW]
[ROW][C]34[/C][C]-0.199122[/C][C]-1.825[/C][C]0.035779[/C][/ROW]
[ROW][C]35[/C][C]-0.045431[/C][C]-0.4164[/C][C]0.339095[/C][/ROW]
[ROW][C]36[/C][C]-0.130597[/C][C]-1.1969[/C][C]0.117349[/C][/ROW]
[ROW][C]37[/C][C]-0.039942[/C][C]-0.3661[/C][C]0.357614[/C][/ROW]
[ROW][C]38[/C][C]-0.093938[/C][C]-0.861[/C][C]0.195856[/C][/ROW]
[ROW][C]39[/C][C]-0.056567[/C][C]-0.5184[/C][C]0.302756[/C][/ROW]
[ROW][C]40[/C][C]-0.048011[/C][C]-0.44[/C][C]0.330524[/C][/ROW]
[ROW][C]41[/C][C]0.058065[/C][C]0.5322[/C][C]0.298005[/C][/ROW]
[ROW][C]42[/C][C]-0.027945[/C][C]-0.2561[/C][C]0.399243[/C][/ROW]
[ROW][C]43[/C][C]0.081339[/C][C]0.7455[/C][C]0.229031[/C][/ROW]
[ROW][C]44[/C][C]-0.04957[/C][C]-0.4543[/C][C]0.325385[/C][/ROW]
[ROW][C]45[/C][C]0.00643[/C][C]0.0589[/C][C]0.476572[/C][/ROW]
[ROW][C]46[/C][C]0.049063[/C][C]0.4497[/C][C]0.327052[/C][/ROW]
[ROW][C]47[/C][C]-0.02346[/C][C]-0.215[/C][C]0.415137[/C][/ROW]
[ROW][C]48[/C][C]0.09674[/C][C]0.8866[/C][C]0.188903[/C][/ROW]
[/TABLE]
Source: https://freestatistics.org/blog/index.php?pk=187697&T=2

Globally Unique Identifier (entire table): ba.freestatistics.org/blog/index.php?pk=187697&T=2

As an alternative you can also use a QR Code:  

The GUIDs for individual cells are displayed in the table below:

Partial Autocorrelation Function
Time lag kPACF(k)T-STATP-value
10.9118128.35690
2-0.264854-2.42740.008672
30.3633863.33050.000645
40.1412051.29420.099578
50.1980121.81480.036561
6-0.167367-1.53390.064401
7-0.308148-2.82420.002959
8-0.241044-2.20920.014941
9-0.173231-1.58770.058057
100.0353370.32390.373421
110.2793662.56040.006122
12-0.095613-0.87630.191682
13-0.534244-4.89642e-06
140.053660.49180.312072
150.0041110.03770.485018
16-0.071374-0.65410.257401
17-0.077957-0.71450.238452
180.0062970.05770.477059
190.0246650.22610.410853
20-0.052998-0.48570.314209
210.0323440.29640.383816
220.0108390.09930.460553
23-0.003193-0.02930.488361
240.1089060.99810.160539
25-0.022893-0.20980.41716
260.0895450.82070.207073
270.0410430.37620.353871
28-0.067356-0.61730.269344
290.0497640.45610.324749
30-0.035287-0.32340.373594
31-0.001221-0.01120.49555
320.0746550.68420.247858
330.0416790.3820.351714
34-0.199122-1.8250.035779
35-0.045431-0.41640.339095
36-0.130597-1.19690.117349
37-0.039942-0.36610.357614
38-0.093938-0.8610.195856
39-0.056567-0.51840.302756
40-0.048011-0.440.330524
410.0580650.53220.298005
42-0.027945-0.25610.399243
430.0813390.74550.229031
44-0.04957-0.45430.325385
450.006430.05890.476572
460.0490630.44970.327052
47-0.02346-0.2150.415137
480.096740.88660.188903


Parameters (Session):
par1 = 48 ; par2 = 1 ; par3 = 0 ; par4 = 0 ; par5 = 12 ; par6 = White Noise ; par7 = 0.95 ;
Parameters (R input):
par1 = 48 ; par2 = 1 ; par3 = 0 ; par4 = 0 ; par5 = 12 ; par6 = White Noise ; par7 = 0.95 ; par8 = ;
R code (references can be found in the software module):
if (par1 == 'Default') {
par1 = 10*log10(length(x))
} else {
par1 <- as.numeric(par1)
}
par2 <- as.numeric(par2)
par3 <- as.numeric(par3)
par4 <- as.numeric(par4)
par5 <- as.numeric(par5)
if (par6 == 'White Noise') par6 <- 'white' else par6 <- 'ma'
par7 <- as.numeric(par7)
if (par8 != '') par8 <- as.numeric(par8)
ox <- x
if (par8 == '') {
if (par2 == 0) {
x <- log(x)
} else {
x <- (x ^ par2 - 1) / par2
}
} else {
x <- log(x,base=par8)
}
if (par3 > 0) x <- diff(x,lag=1,difference=par3)
if (par4 > 0) x <- diff(x,lag=par5,difference=par4)
bitmap(file='picts.png')
op <- par(mfrow=c(2,1))
plot(ox,type='l',main='Original Time Series',xlab='time',ylab='value')
if (par8=='') {
mytitle <- paste('Working Time Series (lambda=',par2,', d=',par3,', D=',par4,')',sep='')
mysub <- paste('(lambda=',par2,', d=',par3,', D=',par4,', CI=', par7, ', CI type=',par6,')',sep='')
} else {
mytitle <- paste('Working Time Series (base=',par8,', d=',par3,', D=',par4,')',sep='')
mysub <- paste('(base=',par8,', d=',par3,', D=',par4,', CI=', par7, ', CI type=',par6,')',sep='')
}
plot(x,type='l', main=mytitle,xlab='time',ylab='value')
par(op)
dev.off()
bitmap(file='pic1.png')
racf <- acf(x, par1, main='Autocorrelation', xlab='time lag', ylab='ACF', ci.type=par6, ci=par7, sub=mysub)
dev.off()
bitmap(file='pic2.png')
rpacf <- pacf(x,par1,main='Partial Autocorrelation',xlab='lags',ylab='PACF',sub=mysub)
dev.off()
(myacf <- c(racf$acf))
(mypacf <- c(rpacf$acf))
lengthx <- length(x)
sqrtn <- sqrt(lengthx)
load(file='createtable')
a<-table.start()
a<-table.row.start(a)
a<-table.element(a,'Autocorrelation Function',4,TRUE)
a<-table.row.end(a)
a<-table.row.start(a)
a<-table.element(a,'Time lag k',header=TRUE)
a<-table.element(a,hyperlink('basics.htm','ACF(k)','click here for more information about the Autocorrelation Function'),header=TRUE)
a<-table.element(a,'T-STAT',header=TRUE)
a<-table.element(a,'P-value',header=TRUE)
a<-table.row.end(a)
for (i in 2:(par1+1)) {
a<-table.row.start(a)
a<-table.element(a,i-1,header=TRUE)
a<-table.element(a,round(myacf[i],6))
mytstat <- myacf[i]*sqrtn
a<-table.element(a,round(mytstat,4))
a<-table.element(a,round(1-pt(abs(mytstat),lengthx),6))
a<-table.row.end(a)
}
a<-table.end(a)
table.save(a,file='mytable.tab')
a<-table.start()
a<-table.row.start(a)
a<-table.element(a,'Partial Autocorrelation Function',4,TRUE)
a<-table.row.end(a)
a<-table.row.start(a)
a<-table.element(a,'Time lag k',header=TRUE)
a<-table.element(a,hyperlink('basics.htm','PACF(k)','click here for more information about the Partial Autocorrelation Function'),header=TRUE)
a<-table.element(a,'T-STAT',header=TRUE)
a<-table.element(a,'P-value',header=TRUE)
a<-table.row.end(a)
for (i in 1:par1) {
a<-table.row.start(a)
a<-table.element(a,i,header=TRUE)
a<-table.element(a,round(mypacf[i],6))
mytstat <- mypacf[i]*sqrtn
a<-table.element(a,round(mytstat,4))
a<-table.element(a,round(1-pt(abs(mytstat),lengthx),6))
a<-table.row.end(a)
}
a<-table.end(a)
table.save(a,file='mytable1.tab')