Free Statistics

of Irreproducible Research!

Author's title

Author*Unverified author*
R Software Modulerwasp_autocorrelation.wasp
Title produced by software(Partial) Autocorrelation Function
Date of computationMon, 12 Nov 2012 03:54:02 -0500
Cite this page as followsStatistical Computations at FreeStatistics.org, Office for Research Development and Education, URL https://freestatistics.org/blog/index.php?v=date/2012/Nov/12/t1352710514bivd9efjk52afbm.htm/, Retrieved Sun, 28 Apr 2024 20:26:55 +0000
Statistical Computations at FreeStatistics.org, Office for Research Development and Education, URL https://freestatistics.org/blog/index.php?pk=187667, Retrieved Sun, 28 Apr 2024 20:26:55 +0000
QR Codes:

Original text written by user:
IsPrivate?No (this computation is public)
User-defined keywords
Estimated Impact115
Family? (F = Feedback message, R = changed R code, M = changed R Module, P = changed Parameters, D = changed Data)
-     [Central Tendency] [aantal verkochte ...] [2012-10-18 13:05:29] [6e17e56f9bbdc65ea77b7e28bc808fc4]
- RMP   [Mean Plot] [verkoop aantal pr...] [2012-10-19 16:08:40] [6e17e56f9bbdc65ea77b7e28bc808fc4]
- RMP       [(Partial) Autocorrelation Function] [autocorrelatie ve...] [2012-11-12 08:54:02] [32426a9b6b43a24d932e8bdfe421cad9] [Current]
Feedback Forum

Post a new message
Dataseries X:
124275
58605
21828
42811
65963
128457
26867
143540
107458
258558
22475
294584
159848
289458
117950
78351
84589
44324
52285
185486
23846
13257
166999
148488
74747
55700
218584
187888
44788
18840
48787
69100
41892
90588
148574
50201
86828
102785
118844
145288
56790
287525
187880
87740
55258
58769
43366
77051
91574
15533
18425
65192
81059
73322
91261
86166
61842
25192
21059
15855
12618
101667
224275
55700
60748
41848
61781
120077
42032
46485
36861
55027
48999
68352
126987
86526
125340
69029
153287
135724
92108
119906
79798
97206


Summary of computational transaction
Raw Inputview raw input (R code)
Raw Outputview raw output of R engine
Computing time3 seconds
R Server'Gwilym Jenkins' @ jenkins.wessa.net

\begin{tabular}{lllllllll}
\hline
Summary of computational transaction \tabularnewline
Raw Input & view raw input (R code)  \tabularnewline
Raw Output & view raw output of R engine  \tabularnewline
Computing time & 3 seconds \tabularnewline
R Server & 'Gwilym Jenkins' @ jenkins.wessa.net \tabularnewline
\hline
\end{tabular}
%Source: https://freestatistics.org/blog/index.php?pk=187667&T=0

[TABLE]
[ROW][C]Summary of computational transaction[/C][/ROW]
[ROW][C]Raw Input[/C][C]view raw input (R code) [/C][/ROW]
[ROW][C]Raw Output[/C][C]view raw output of R engine [/C][/ROW]
[ROW][C]Computing time[/C][C]3 seconds[/C][/ROW]
[ROW][C]R Server[/C][C]'Gwilym Jenkins' @ jenkins.wessa.net[/C][/ROW]
[/TABLE]
Source: https://freestatistics.org/blog/index.php?pk=187667&T=0

Globally Unique Identifier (entire table): ba.freestatistics.org/blog/index.php?pk=187667&T=0

As an alternative you can also use a QR Code:  

The GUIDs for individual cells are displayed in the table below:

Summary of computational transaction
Raw Inputview raw input (R code)
Raw Outputview raw output of R engine
Computing time3 seconds
R Server'Gwilym Jenkins' @ jenkins.wessa.net


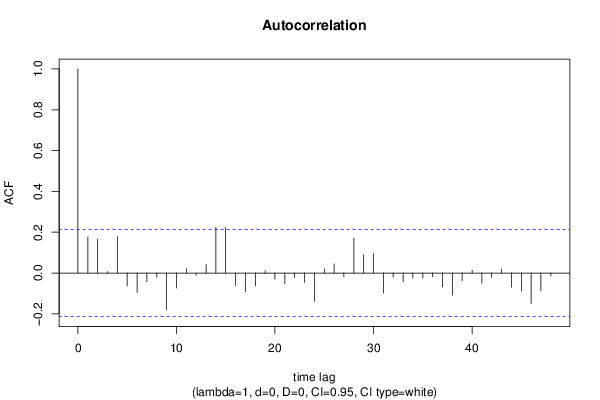
Autocorrelation Function
Time lag kACF(k)T-STATP-value
10.1758321.61150.055408
20.1667391.52820.065111
30.0070810.06490.474204
40.1785371.63630.052758
5-0.063432-0.58140.281275
6-0.095866-0.87860.191056
7-0.04219-0.38670.349988
8-0.020958-0.19210.42407
9-0.179475-1.64490.051862
10-0.073355-0.67230.251616
110.0217240.19910.421331
12-0.011041-0.10120.459821
130.0420910.38580.350321
140.2227482.04150.022169
150.2229262.04320.022086
16-0.06169-0.56540.286654
17-0.091793-0.84130.201286
18-0.063073-0.57810.282381
190.0115240.10560.458069
20-0.029982-0.27480.392077
21-0.052451-0.48070.315982
22-0.023116-0.21190.416366
23-0.046363-0.42490.335988
24-0.138504-1.26940.103901
250.0202430.18550.42663
260.0445180.4080.342151
27-0.017878-0.16390.43512
280.1708221.56560.0606
290.0893190.81860.20766
300.0950870.87150.192987
31-0.097771-0.89610.186385
32-0.019944-0.18280.4277
33-0.042718-0.39150.348202
34-0.024799-0.22730.410376
35-0.024526-0.22480.411346
36-0.018287-0.16760.433649
37-0.06816-0.62470.266931
38-0.108873-0.99780.160611
39-0.037271-0.34160.366755
400.0128770.1180.453169
41-0.050611-0.46390.321976
42-0.022379-0.20510.418992
430.0182920.16770.43363
44-0.069157-0.63380.263957
45-0.087842-0.80510.211523
46-0.148215-1.35840.088985
47-0.088354-0.80980.210179
48-0.014384-0.13180.447717

\begin{tabular}{lllllllll}
\hline
Autocorrelation Function \tabularnewline
Time lag k & ACF(k) & T-STAT & P-value \tabularnewline
1 & 0.175832 & 1.6115 & 0.055408 \tabularnewline
2 & 0.166739 & 1.5282 & 0.065111 \tabularnewline
3 & 0.007081 & 0.0649 & 0.474204 \tabularnewline
4 & 0.178537 & 1.6363 & 0.052758 \tabularnewline
5 & -0.063432 & -0.5814 & 0.281275 \tabularnewline
6 & -0.095866 & -0.8786 & 0.191056 \tabularnewline
7 & -0.04219 & -0.3867 & 0.349988 \tabularnewline
8 & -0.020958 & -0.1921 & 0.42407 \tabularnewline
9 & -0.179475 & -1.6449 & 0.051862 \tabularnewline
10 & -0.073355 & -0.6723 & 0.251616 \tabularnewline
11 & 0.021724 & 0.1991 & 0.421331 \tabularnewline
12 & -0.011041 & -0.1012 & 0.459821 \tabularnewline
13 & 0.042091 & 0.3858 & 0.350321 \tabularnewline
14 & 0.222748 & 2.0415 & 0.022169 \tabularnewline
15 & 0.222926 & 2.0432 & 0.022086 \tabularnewline
16 & -0.06169 & -0.5654 & 0.286654 \tabularnewline
17 & -0.091793 & -0.8413 & 0.201286 \tabularnewline
18 & -0.063073 & -0.5781 & 0.282381 \tabularnewline
19 & 0.011524 & 0.1056 & 0.458069 \tabularnewline
20 & -0.029982 & -0.2748 & 0.392077 \tabularnewline
21 & -0.052451 & -0.4807 & 0.315982 \tabularnewline
22 & -0.023116 & -0.2119 & 0.416366 \tabularnewline
23 & -0.046363 & -0.4249 & 0.335988 \tabularnewline
24 & -0.138504 & -1.2694 & 0.103901 \tabularnewline
25 & 0.020243 & 0.1855 & 0.42663 \tabularnewline
26 & 0.044518 & 0.408 & 0.342151 \tabularnewline
27 & -0.017878 & -0.1639 & 0.43512 \tabularnewline
28 & 0.170822 & 1.5656 & 0.0606 \tabularnewline
29 & 0.089319 & 0.8186 & 0.20766 \tabularnewline
30 & 0.095087 & 0.8715 & 0.192987 \tabularnewline
31 & -0.097771 & -0.8961 & 0.186385 \tabularnewline
32 & -0.019944 & -0.1828 & 0.4277 \tabularnewline
33 & -0.042718 & -0.3915 & 0.348202 \tabularnewline
34 & -0.024799 & -0.2273 & 0.410376 \tabularnewline
35 & -0.024526 & -0.2248 & 0.411346 \tabularnewline
36 & -0.018287 & -0.1676 & 0.433649 \tabularnewline
37 & -0.06816 & -0.6247 & 0.266931 \tabularnewline
38 & -0.108873 & -0.9978 & 0.160611 \tabularnewline
39 & -0.037271 & -0.3416 & 0.366755 \tabularnewline
40 & 0.012877 & 0.118 & 0.453169 \tabularnewline
41 & -0.050611 & -0.4639 & 0.321976 \tabularnewline
42 & -0.022379 & -0.2051 & 0.418992 \tabularnewline
43 & 0.018292 & 0.1677 & 0.43363 \tabularnewline
44 & -0.069157 & -0.6338 & 0.263957 \tabularnewline
45 & -0.087842 & -0.8051 & 0.211523 \tabularnewline
46 & -0.148215 & -1.3584 & 0.088985 \tabularnewline
47 & -0.088354 & -0.8098 & 0.210179 \tabularnewline
48 & -0.014384 & -0.1318 & 0.447717 \tabularnewline
\hline
\end{tabular}
%Source: https://freestatistics.org/blog/index.php?pk=187667&T=1

[TABLE]
[ROW][C]Autocorrelation Function[/C][/ROW]
[ROW][C]Time lag k[/C][C]ACF(k)[/C][C]T-STAT[/C][C]P-value[/C][/ROW]
[ROW][C]1[/C][C]0.175832[/C][C]1.6115[/C][C]0.055408[/C][/ROW]
[ROW][C]2[/C][C]0.166739[/C][C]1.5282[/C][C]0.065111[/C][/ROW]
[ROW][C]3[/C][C]0.007081[/C][C]0.0649[/C][C]0.474204[/C][/ROW]
[ROW][C]4[/C][C]0.178537[/C][C]1.6363[/C][C]0.052758[/C][/ROW]
[ROW][C]5[/C][C]-0.063432[/C][C]-0.5814[/C][C]0.281275[/C][/ROW]
[ROW][C]6[/C][C]-0.095866[/C][C]-0.8786[/C][C]0.191056[/C][/ROW]
[ROW][C]7[/C][C]-0.04219[/C][C]-0.3867[/C][C]0.349988[/C][/ROW]
[ROW][C]8[/C][C]-0.020958[/C][C]-0.1921[/C][C]0.42407[/C][/ROW]
[ROW][C]9[/C][C]-0.179475[/C][C]-1.6449[/C][C]0.051862[/C][/ROW]
[ROW][C]10[/C][C]-0.073355[/C][C]-0.6723[/C][C]0.251616[/C][/ROW]
[ROW][C]11[/C][C]0.021724[/C][C]0.1991[/C][C]0.421331[/C][/ROW]
[ROW][C]12[/C][C]-0.011041[/C][C]-0.1012[/C][C]0.459821[/C][/ROW]
[ROW][C]13[/C][C]0.042091[/C][C]0.3858[/C][C]0.350321[/C][/ROW]
[ROW][C]14[/C][C]0.222748[/C][C]2.0415[/C][C]0.022169[/C][/ROW]
[ROW][C]15[/C][C]0.222926[/C][C]2.0432[/C][C]0.022086[/C][/ROW]
[ROW][C]16[/C][C]-0.06169[/C][C]-0.5654[/C][C]0.286654[/C][/ROW]
[ROW][C]17[/C][C]-0.091793[/C][C]-0.8413[/C][C]0.201286[/C][/ROW]
[ROW][C]18[/C][C]-0.063073[/C][C]-0.5781[/C][C]0.282381[/C][/ROW]
[ROW][C]19[/C][C]0.011524[/C][C]0.1056[/C][C]0.458069[/C][/ROW]
[ROW][C]20[/C][C]-0.029982[/C][C]-0.2748[/C][C]0.392077[/C][/ROW]
[ROW][C]21[/C][C]-0.052451[/C][C]-0.4807[/C][C]0.315982[/C][/ROW]
[ROW][C]22[/C][C]-0.023116[/C][C]-0.2119[/C][C]0.416366[/C][/ROW]
[ROW][C]23[/C][C]-0.046363[/C][C]-0.4249[/C][C]0.335988[/C][/ROW]
[ROW][C]24[/C][C]-0.138504[/C][C]-1.2694[/C][C]0.103901[/C][/ROW]
[ROW][C]25[/C][C]0.020243[/C][C]0.1855[/C][C]0.42663[/C][/ROW]
[ROW][C]26[/C][C]0.044518[/C][C]0.408[/C][C]0.342151[/C][/ROW]
[ROW][C]27[/C][C]-0.017878[/C][C]-0.1639[/C][C]0.43512[/C][/ROW]
[ROW][C]28[/C][C]0.170822[/C][C]1.5656[/C][C]0.0606[/C][/ROW]
[ROW][C]29[/C][C]0.089319[/C][C]0.8186[/C][C]0.20766[/C][/ROW]
[ROW][C]30[/C][C]0.095087[/C][C]0.8715[/C][C]0.192987[/C][/ROW]
[ROW][C]31[/C][C]-0.097771[/C][C]-0.8961[/C][C]0.186385[/C][/ROW]
[ROW][C]32[/C][C]-0.019944[/C][C]-0.1828[/C][C]0.4277[/C][/ROW]
[ROW][C]33[/C][C]-0.042718[/C][C]-0.3915[/C][C]0.348202[/C][/ROW]
[ROW][C]34[/C][C]-0.024799[/C][C]-0.2273[/C][C]0.410376[/C][/ROW]
[ROW][C]35[/C][C]-0.024526[/C][C]-0.2248[/C][C]0.411346[/C][/ROW]
[ROW][C]36[/C][C]-0.018287[/C][C]-0.1676[/C][C]0.433649[/C][/ROW]
[ROW][C]37[/C][C]-0.06816[/C][C]-0.6247[/C][C]0.266931[/C][/ROW]
[ROW][C]38[/C][C]-0.108873[/C][C]-0.9978[/C][C]0.160611[/C][/ROW]
[ROW][C]39[/C][C]-0.037271[/C][C]-0.3416[/C][C]0.366755[/C][/ROW]
[ROW][C]40[/C][C]0.012877[/C][C]0.118[/C][C]0.453169[/C][/ROW]
[ROW][C]41[/C][C]-0.050611[/C][C]-0.4639[/C][C]0.321976[/C][/ROW]
[ROW][C]42[/C][C]-0.022379[/C][C]-0.2051[/C][C]0.418992[/C][/ROW]
[ROW][C]43[/C][C]0.018292[/C][C]0.1677[/C][C]0.43363[/C][/ROW]
[ROW][C]44[/C][C]-0.069157[/C][C]-0.6338[/C][C]0.263957[/C][/ROW]
[ROW][C]45[/C][C]-0.087842[/C][C]-0.8051[/C][C]0.211523[/C][/ROW]
[ROW][C]46[/C][C]-0.148215[/C][C]-1.3584[/C][C]0.088985[/C][/ROW]
[ROW][C]47[/C][C]-0.088354[/C][C]-0.8098[/C][C]0.210179[/C][/ROW]
[ROW][C]48[/C][C]-0.014384[/C][C]-0.1318[/C][C]0.447717[/C][/ROW]
[/TABLE]
Source: https://freestatistics.org/blog/index.php?pk=187667&T=1

Globally Unique Identifier (entire table): ba.freestatistics.org/blog/index.php?pk=187667&T=1

As an alternative you can also use a QR Code:  

The GUIDs for individual cells are displayed in the table below:

Autocorrelation Function
Time lag kACF(k)T-STATP-value
10.1758321.61150.055408
20.1667391.52820.065111
30.0070810.06490.474204
40.1785371.63630.052758
5-0.063432-0.58140.281275
6-0.095866-0.87860.191056
7-0.04219-0.38670.349988
8-0.020958-0.19210.42407
9-0.179475-1.64490.051862
10-0.073355-0.67230.251616
110.0217240.19910.421331
12-0.011041-0.10120.459821
130.0420910.38580.350321
140.2227482.04150.022169
150.2229262.04320.022086
16-0.06169-0.56540.286654
17-0.091793-0.84130.201286
18-0.063073-0.57810.282381
190.0115240.10560.458069
20-0.029982-0.27480.392077
21-0.052451-0.48070.315982
22-0.023116-0.21190.416366
23-0.046363-0.42490.335988
24-0.138504-1.26940.103901
250.0202430.18550.42663
260.0445180.4080.342151
27-0.017878-0.16390.43512
280.1708221.56560.0606
290.0893190.81860.20766
300.0950870.87150.192987
31-0.097771-0.89610.186385
32-0.019944-0.18280.4277
33-0.042718-0.39150.348202
34-0.024799-0.22730.410376
35-0.024526-0.22480.411346
36-0.018287-0.16760.433649
37-0.06816-0.62470.266931
38-0.108873-0.99780.160611
39-0.037271-0.34160.366755
400.0128770.1180.453169
41-0.050611-0.46390.321976
42-0.022379-0.20510.418992
430.0182920.16770.43363
44-0.069157-0.63380.263957
45-0.087842-0.80510.211523
46-0.148215-1.35840.088985
47-0.088354-0.80980.210179
48-0.014384-0.13180.447717


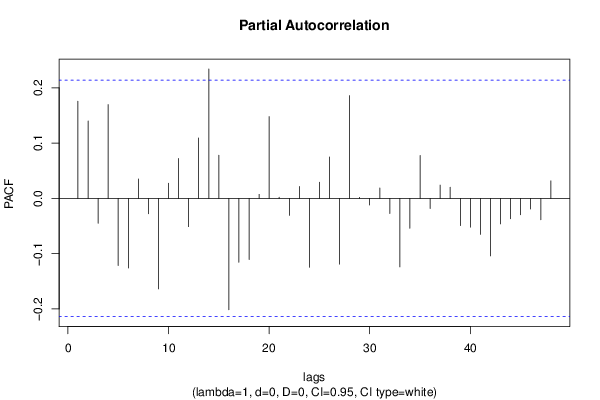
Partial Autocorrelation Function
Time lag kPACF(k)T-STATP-value
10.1758321.61150.055408
20.1401551.28450.101241
3-0.045021-0.41260.340468
40.1696341.55470.061887
5-0.121242-1.11120.134825
6-0.125892-1.15380.125924
70.0350630.32140.374367
8-0.027896-0.25570.399415
9-0.163655-1.49990.068692
100.0274550.25160.40097
110.0722790.66240.254749
12-0.050988-0.46730.320744
130.1091761.00060.159942
140.2341882.14640.017364
150.0781510.71630.237908
16-0.201435-1.84620.034194
17-0.115565-1.05920.146279
18-0.11037-1.01160.157328
190.0073570.06740.4732
200.1479431.35590.089379
210.0021580.01980.492133
22-0.030631-0.28070.389799
230.0215060.19710.422112
24-0.124651-1.14240.128258
250.0291610.26730.394961
260.0750040.68740.246854
27-0.118873-1.08950.139526
280.1859091.70390.04605
290.001920.01760.493003
30-0.01205-0.11040.45616
310.0188010.17230.431803
32-0.027202-0.24930.401864
33-0.123838-1.1350.129802
34-0.053962-0.49460.311098
350.0777650.71270.238995
36-0.01821-0.16690.433927
370.0240680.22060.412976
380.0200950.18420.427161
39-0.049163-0.45060.326724
40-0.051984-0.47640.317499
41-0.06499-0.59560.276509
42-0.103946-0.95270.171742
43-0.046043-0.4220.337055
44-0.036868-0.33790.368139
45-0.029501-0.27040.393766
46-0.019035-0.17450.430962
47-0.038637-0.35410.36207
480.0318170.29160.385651

\begin{tabular}{lllllllll}
\hline
Partial Autocorrelation Function \tabularnewline
Time lag k & PACF(k) & T-STAT & P-value \tabularnewline
1 & 0.175832 & 1.6115 & 0.055408 \tabularnewline
2 & 0.140155 & 1.2845 & 0.101241 \tabularnewline
3 & -0.045021 & -0.4126 & 0.340468 \tabularnewline
4 & 0.169634 & 1.5547 & 0.061887 \tabularnewline
5 & -0.121242 & -1.1112 & 0.134825 \tabularnewline
6 & -0.125892 & -1.1538 & 0.125924 \tabularnewline
7 & 0.035063 & 0.3214 & 0.374367 \tabularnewline
8 & -0.027896 & -0.2557 & 0.399415 \tabularnewline
9 & -0.163655 & -1.4999 & 0.068692 \tabularnewline
10 & 0.027455 & 0.2516 & 0.40097 \tabularnewline
11 & 0.072279 & 0.6624 & 0.254749 \tabularnewline
12 & -0.050988 & -0.4673 & 0.320744 \tabularnewline
13 & 0.109176 & 1.0006 & 0.159942 \tabularnewline
14 & 0.234188 & 2.1464 & 0.017364 \tabularnewline
15 & 0.078151 & 0.7163 & 0.237908 \tabularnewline
16 & -0.201435 & -1.8462 & 0.034194 \tabularnewline
17 & -0.115565 & -1.0592 & 0.146279 \tabularnewline
18 & -0.11037 & -1.0116 & 0.157328 \tabularnewline
19 & 0.007357 & 0.0674 & 0.4732 \tabularnewline
20 & 0.147943 & 1.3559 & 0.089379 \tabularnewline
21 & 0.002158 & 0.0198 & 0.492133 \tabularnewline
22 & -0.030631 & -0.2807 & 0.389799 \tabularnewline
23 & 0.021506 & 0.1971 & 0.422112 \tabularnewline
24 & -0.124651 & -1.1424 & 0.128258 \tabularnewline
25 & 0.029161 & 0.2673 & 0.394961 \tabularnewline
26 & 0.075004 & 0.6874 & 0.246854 \tabularnewline
27 & -0.118873 & -1.0895 & 0.139526 \tabularnewline
28 & 0.185909 & 1.7039 & 0.04605 \tabularnewline
29 & 0.00192 & 0.0176 & 0.493003 \tabularnewline
30 & -0.01205 & -0.1104 & 0.45616 \tabularnewline
31 & 0.018801 & 0.1723 & 0.431803 \tabularnewline
32 & -0.027202 & -0.2493 & 0.401864 \tabularnewline
33 & -0.123838 & -1.135 & 0.129802 \tabularnewline
34 & -0.053962 & -0.4946 & 0.311098 \tabularnewline
35 & 0.077765 & 0.7127 & 0.238995 \tabularnewline
36 & -0.01821 & -0.1669 & 0.433927 \tabularnewline
37 & 0.024068 & 0.2206 & 0.412976 \tabularnewline
38 & 0.020095 & 0.1842 & 0.427161 \tabularnewline
39 & -0.049163 & -0.4506 & 0.326724 \tabularnewline
40 & -0.051984 & -0.4764 & 0.317499 \tabularnewline
41 & -0.06499 & -0.5956 & 0.276509 \tabularnewline
42 & -0.103946 & -0.9527 & 0.171742 \tabularnewline
43 & -0.046043 & -0.422 & 0.337055 \tabularnewline
44 & -0.036868 & -0.3379 & 0.368139 \tabularnewline
45 & -0.029501 & -0.2704 & 0.393766 \tabularnewline
46 & -0.019035 & -0.1745 & 0.430962 \tabularnewline
47 & -0.038637 & -0.3541 & 0.36207 \tabularnewline
48 & 0.031817 & 0.2916 & 0.385651 \tabularnewline
\hline
\end{tabular}
%Source: https://freestatistics.org/blog/index.php?pk=187667&T=2

[TABLE]
[ROW][C]Partial Autocorrelation Function[/C][/ROW]
[ROW][C]Time lag k[/C][C]PACF(k)[/C][C]T-STAT[/C][C]P-value[/C][/ROW]
[ROW][C]1[/C][C]0.175832[/C][C]1.6115[/C][C]0.055408[/C][/ROW]
[ROW][C]2[/C][C]0.140155[/C][C]1.2845[/C][C]0.101241[/C][/ROW]
[ROW][C]3[/C][C]-0.045021[/C][C]-0.4126[/C][C]0.340468[/C][/ROW]
[ROW][C]4[/C][C]0.169634[/C][C]1.5547[/C][C]0.061887[/C][/ROW]
[ROW][C]5[/C][C]-0.121242[/C][C]-1.1112[/C][C]0.134825[/C][/ROW]
[ROW][C]6[/C][C]-0.125892[/C][C]-1.1538[/C][C]0.125924[/C][/ROW]
[ROW][C]7[/C][C]0.035063[/C][C]0.3214[/C][C]0.374367[/C][/ROW]
[ROW][C]8[/C][C]-0.027896[/C][C]-0.2557[/C][C]0.399415[/C][/ROW]
[ROW][C]9[/C][C]-0.163655[/C][C]-1.4999[/C][C]0.068692[/C][/ROW]
[ROW][C]10[/C][C]0.027455[/C][C]0.2516[/C][C]0.40097[/C][/ROW]
[ROW][C]11[/C][C]0.072279[/C][C]0.6624[/C][C]0.254749[/C][/ROW]
[ROW][C]12[/C][C]-0.050988[/C][C]-0.4673[/C][C]0.320744[/C][/ROW]
[ROW][C]13[/C][C]0.109176[/C][C]1.0006[/C][C]0.159942[/C][/ROW]
[ROW][C]14[/C][C]0.234188[/C][C]2.1464[/C][C]0.017364[/C][/ROW]
[ROW][C]15[/C][C]0.078151[/C][C]0.7163[/C][C]0.237908[/C][/ROW]
[ROW][C]16[/C][C]-0.201435[/C][C]-1.8462[/C][C]0.034194[/C][/ROW]
[ROW][C]17[/C][C]-0.115565[/C][C]-1.0592[/C][C]0.146279[/C][/ROW]
[ROW][C]18[/C][C]-0.11037[/C][C]-1.0116[/C][C]0.157328[/C][/ROW]
[ROW][C]19[/C][C]0.007357[/C][C]0.0674[/C][C]0.4732[/C][/ROW]
[ROW][C]20[/C][C]0.147943[/C][C]1.3559[/C][C]0.089379[/C][/ROW]
[ROW][C]21[/C][C]0.002158[/C][C]0.0198[/C][C]0.492133[/C][/ROW]
[ROW][C]22[/C][C]-0.030631[/C][C]-0.2807[/C][C]0.389799[/C][/ROW]
[ROW][C]23[/C][C]0.021506[/C][C]0.1971[/C][C]0.422112[/C][/ROW]
[ROW][C]24[/C][C]-0.124651[/C][C]-1.1424[/C][C]0.128258[/C][/ROW]
[ROW][C]25[/C][C]0.029161[/C][C]0.2673[/C][C]0.394961[/C][/ROW]
[ROW][C]26[/C][C]0.075004[/C][C]0.6874[/C][C]0.246854[/C][/ROW]
[ROW][C]27[/C][C]-0.118873[/C][C]-1.0895[/C][C]0.139526[/C][/ROW]
[ROW][C]28[/C][C]0.185909[/C][C]1.7039[/C][C]0.04605[/C][/ROW]
[ROW][C]29[/C][C]0.00192[/C][C]0.0176[/C][C]0.493003[/C][/ROW]
[ROW][C]30[/C][C]-0.01205[/C][C]-0.1104[/C][C]0.45616[/C][/ROW]
[ROW][C]31[/C][C]0.018801[/C][C]0.1723[/C][C]0.431803[/C][/ROW]
[ROW][C]32[/C][C]-0.027202[/C][C]-0.2493[/C][C]0.401864[/C][/ROW]
[ROW][C]33[/C][C]-0.123838[/C][C]-1.135[/C][C]0.129802[/C][/ROW]
[ROW][C]34[/C][C]-0.053962[/C][C]-0.4946[/C][C]0.311098[/C][/ROW]
[ROW][C]35[/C][C]0.077765[/C][C]0.7127[/C][C]0.238995[/C][/ROW]
[ROW][C]36[/C][C]-0.01821[/C][C]-0.1669[/C][C]0.433927[/C][/ROW]
[ROW][C]37[/C][C]0.024068[/C][C]0.2206[/C][C]0.412976[/C][/ROW]
[ROW][C]38[/C][C]0.020095[/C][C]0.1842[/C][C]0.427161[/C][/ROW]
[ROW][C]39[/C][C]-0.049163[/C][C]-0.4506[/C][C]0.326724[/C][/ROW]
[ROW][C]40[/C][C]-0.051984[/C][C]-0.4764[/C][C]0.317499[/C][/ROW]
[ROW][C]41[/C][C]-0.06499[/C][C]-0.5956[/C][C]0.276509[/C][/ROW]
[ROW][C]42[/C][C]-0.103946[/C][C]-0.9527[/C][C]0.171742[/C][/ROW]
[ROW][C]43[/C][C]-0.046043[/C][C]-0.422[/C][C]0.337055[/C][/ROW]
[ROW][C]44[/C][C]-0.036868[/C][C]-0.3379[/C][C]0.368139[/C][/ROW]
[ROW][C]45[/C][C]-0.029501[/C][C]-0.2704[/C][C]0.393766[/C][/ROW]
[ROW][C]46[/C][C]-0.019035[/C][C]-0.1745[/C][C]0.430962[/C][/ROW]
[ROW][C]47[/C][C]-0.038637[/C][C]-0.3541[/C][C]0.36207[/C][/ROW]
[ROW][C]48[/C][C]0.031817[/C][C]0.2916[/C][C]0.385651[/C][/ROW]
[/TABLE]
Source: https://freestatistics.org/blog/index.php?pk=187667&T=2

Globally Unique Identifier (entire table): ba.freestatistics.org/blog/index.php?pk=187667&T=2

As an alternative you can also use a QR Code:  

The GUIDs for individual cells are displayed in the table below:

Partial Autocorrelation Function
Time lag kPACF(k)T-STATP-value
10.1758321.61150.055408
20.1401551.28450.101241
3-0.045021-0.41260.340468
40.1696341.55470.061887
5-0.121242-1.11120.134825
6-0.125892-1.15380.125924
70.0350630.32140.374367
8-0.027896-0.25570.399415
9-0.163655-1.49990.068692
100.0274550.25160.40097
110.0722790.66240.254749
12-0.050988-0.46730.320744
130.1091761.00060.159942
140.2341882.14640.017364
150.0781510.71630.237908
16-0.201435-1.84620.034194
17-0.115565-1.05920.146279
18-0.11037-1.01160.157328
190.0073570.06740.4732
200.1479431.35590.089379
210.0021580.01980.492133
22-0.030631-0.28070.389799
230.0215060.19710.422112
24-0.124651-1.14240.128258
250.0291610.26730.394961
260.0750040.68740.246854
27-0.118873-1.08950.139526
280.1859091.70390.04605
290.001920.01760.493003
30-0.01205-0.11040.45616
310.0188010.17230.431803
32-0.027202-0.24930.401864
33-0.123838-1.1350.129802
34-0.053962-0.49460.311098
350.0777650.71270.238995
36-0.01821-0.16690.433927
370.0240680.22060.412976
380.0200950.18420.427161
39-0.049163-0.45060.326724
40-0.051984-0.47640.317499
41-0.06499-0.59560.276509
42-0.103946-0.95270.171742
43-0.046043-0.4220.337055
44-0.036868-0.33790.368139
45-0.029501-0.27040.393766
46-0.019035-0.17450.430962
47-0.038637-0.35410.36207
480.0318170.29160.385651


Parameters (Session):
par1 = 48 ; par2 = 1 ; par3 = 0 ; par4 = 0 ; par5 = 12 ; par6 = White Noise ; par7 = 0.95 ;
Parameters (R input):
par1 = 48 ; par2 = 1 ; par3 = 0 ; par4 = 0 ; par5 = 12 ; par6 = White Noise ; par7 = 0.95 ; par8 = ;
R code (references can be found in the software module):
if (par1 == 'Default') {
par1 = 10*log10(length(x))
} else {
par1 <- as.numeric(par1)
}
par2 <- as.numeric(par2)
par3 <- as.numeric(par3)
par4 <- as.numeric(par4)
par5 <- as.numeric(par5)
if (par6 == 'White Noise') par6 <- 'white' else par6 <- 'ma'
par7 <- as.numeric(par7)
if (par8 != '') par8 <- as.numeric(par8)
ox <- x
if (par8 == '') {
if (par2 == 0) {
x <- log(x)
} else {
x <- (x ^ par2 - 1) / par2
}
} else {
x <- log(x,base=par8)
}
if (par3 > 0) x <- diff(x,lag=1,difference=par3)
if (par4 > 0) x <- diff(x,lag=par5,difference=par4)
bitmap(file='picts.png')
op <- par(mfrow=c(2,1))
plot(ox,type='l',main='Original Time Series',xlab='time',ylab='value')
if (par8=='') {
mytitle <- paste('Working Time Series (lambda=',par2,', d=',par3,', D=',par4,')',sep='')
mysub <- paste('(lambda=',par2,', d=',par3,', D=',par4,', CI=', par7, ', CI type=',par6,')',sep='')
} else {
mytitle <- paste('Working Time Series (base=',par8,', d=',par3,', D=',par4,')',sep='')
mysub <- paste('(base=',par8,', d=',par3,', D=',par4,', CI=', par7, ', CI type=',par6,')',sep='')
}
plot(x,type='l', main=mytitle,xlab='time',ylab='value')
par(op)
dev.off()
bitmap(file='pic1.png')
racf <- acf(x, par1, main='Autocorrelation', xlab='time lag', ylab='ACF', ci.type=par6, ci=par7, sub=mysub)
dev.off()
bitmap(file='pic2.png')
rpacf <- pacf(x,par1,main='Partial Autocorrelation',xlab='lags',ylab='PACF',sub=mysub)
dev.off()
(myacf <- c(racf$acf))
(mypacf <- c(rpacf$acf))
lengthx <- length(x)
sqrtn <- sqrt(lengthx)
load(file='createtable')
a<-table.start()
a<-table.row.start(a)
a<-table.element(a,'Autocorrelation Function',4,TRUE)
a<-table.row.end(a)
a<-table.row.start(a)
a<-table.element(a,'Time lag k',header=TRUE)
a<-table.element(a,hyperlink('basics.htm','ACF(k)','click here for more information about the Autocorrelation Function'),header=TRUE)
a<-table.element(a,'T-STAT',header=TRUE)
a<-table.element(a,'P-value',header=TRUE)
a<-table.row.end(a)
for (i in 2:(par1+1)) {
a<-table.row.start(a)
a<-table.element(a,i-1,header=TRUE)
a<-table.element(a,round(myacf[i],6))
mytstat <- myacf[i]*sqrtn
a<-table.element(a,round(mytstat,4))
a<-table.element(a,round(1-pt(abs(mytstat),lengthx),6))
a<-table.row.end(a)
}
a<-table.end(a)
table.save(a,file='mytable.tab')
a<-table.start()
a<-table.row.start(a)
a<-table.element(a,'Partial Autocorrelation Function',4,TRUE)
a<-table.row.end(a)
a<-table.row.start(a)
a<-table.element(a,'Time lag k',header=TRUE)
a<-table.element(a,hyperlink('basics.htm','PACF(k)','click here for more information about the Partial Autocorrelation Function'),header=TRUE)
a<-table.element(a,'T-STAT',header=TRUE)
a<-table.element(a,'P-value',header=TRUE)
a<-table.row.end(a)
for (i in 1:par1) {
a<-table.row.start(a)
a<-table.element(a,i,header=TRUE)
a<-table.element(a,round(mypacf[i],6))
mytstat <- mypacf[i]*sqrtn
a<-table.element(a,round(mytstat,4))
a<-table.element(a,round(1-pt(abs(mytstat),lengthx),6))
a<-table.row.end(a)
}
a<-table.end(a)
table.save(a,file='mytable1.tab')