| Tabulation of Results | ||
| Lear x Sof | ||
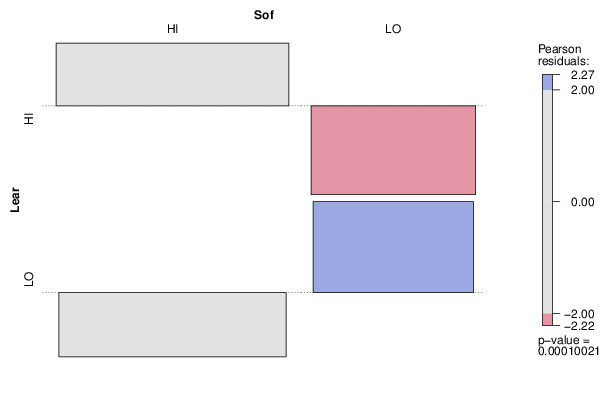
| HI | LO | HI | 67 | 16 | LO | 41 | 38 |
| Tabulation of Expected Results | ||
| Lear x Sof | ||
| HI | LO | HI | 55.33 | 27.67 | LO | 52.67 | 26.33 |
| Statistical Results | |
| Pearson's Chi-squared test with Yates' continuity correction | |
| Pearson Chi Square Statistic | 13.86 |
| Degrees of Freedom | 1 |
| P value | 0 |