| Multiple Linear Regression - Estimated Regression Equation |
| Waalsm[t] = -130.339838114327 + 0.034984131069266Vlaamsm[t] -0.206430397593295Vlaamsvr[t] + 1.33218483391395Waalsvr[t] + 0.334891195292699Brusselm[t] -0.352391285465773Brusselvr[t] + e[t] |
| Multiple Linear Regression - Ordinary Least Squares | |||||
| Variable | Parameter | S.D. | T-STAT H0: parameter = 0 | 2-tail p-value | 1-tail p-value |
| (Intercept) | -130.339838114327 | 94.597577 | -1.3778 | 0.175222 | 0.087611 |
| Vlaamsm | 0.034984131069266 | 0.127584 | 0.2742 | 0.785211 | 0.392605 |
| Vlaamsvr | -0.206430397593295 | 0.114762 | -1.7988 | 0.078918 | 0.039459 |
| Waalsvr | 1.33218483391395 | 0.071816 | 18.5499 | 0 | 0 |
| Brusselm | 0.334891195292699 | 0.236957 | 1.4133 | 0.164604 | 0.082302 |
| Brusselvr | -0.352391285465773 | 0.211367 | -1.6672 | 0.102578 | 0.051289 |
| Multiple Linear Regression - Regression Statistics | |
| Multiple R | 0.99873293121104 |
| R-squared | 0.997467467885395 |
| Adjusted R-squared | 0.997179680145099 |
| F-TEST (value) | 3465.98318211721 |
| F-TEST (DF numerator) | 5 |
| F-TEST (DF denominator) | 44 |
| p-value | 0 |
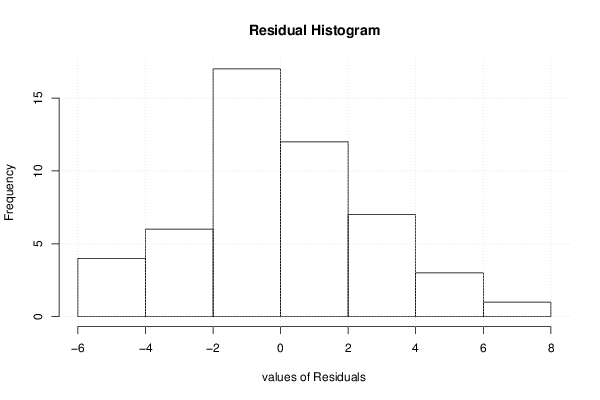
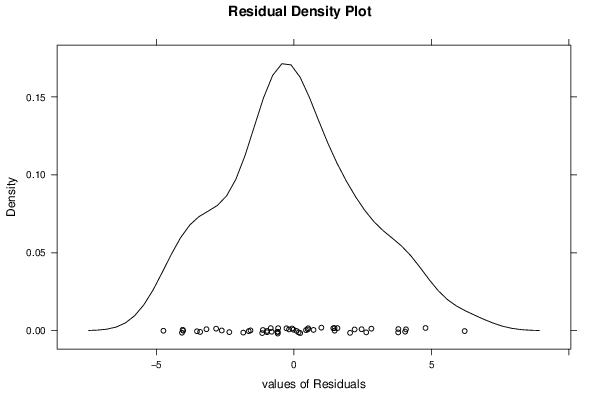
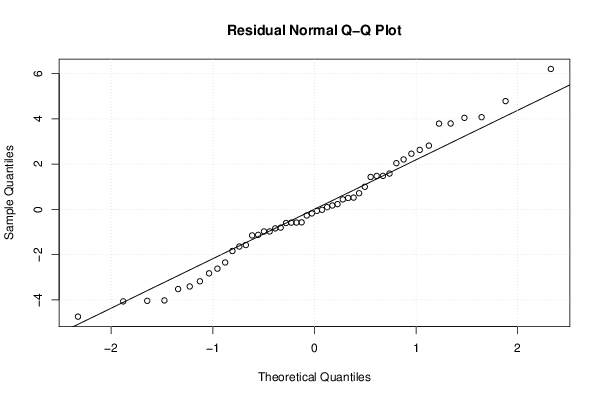
| Multiple Linear Regression - Residual Statistics | |
| Residual Standard Deviation | 2.63857676401103 |
| Sum Squared Residuals | 306.331842941472 |
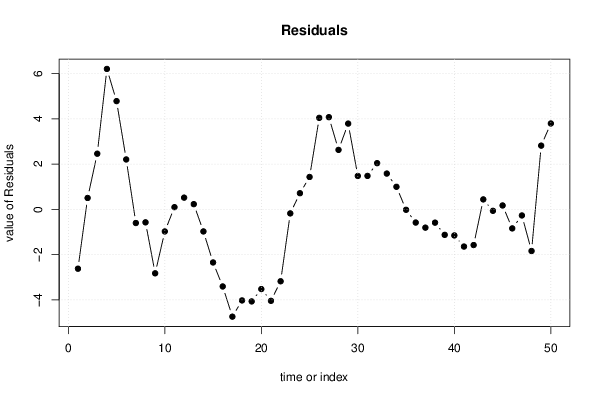
| Multiple Linear Regression - Actuals, Interpolation, and Residuals | |||
| Time or Index | Actuals | Interpolation Forecast | Residuals Prediction Error |
| 1 | 1512 | 1514.61987017451 | -2.61987017450808 |
| 2 | 1517 | 1516.49416670248 | 0.505833297520852 |
| 3 | 1525 | 1522.5379453641 | 2.4620546358996 |
| 4 | 1540 | 1533.79146921754 | 6.20853078245799 |
| 5 | 1547 | 1542.21373618412 | 4.78626381588153 |
| 6 | 1547 | 1544.7914276008 | 2.20857239919528 |
| 7 | 1547 | 1547.60105084301 | -0.601050843012691 |
| 8 | 1547 | 1547.57129007888 | -0.571290078876164 |
| 9 | 1546 | 1548.82472036551 | -2.82472036551043 |
| 10 | 1533 | 1533.97386527973 | -0.973865279728585 |
| 11 | 1538 | 1537.90114793733 | 0.0988520626684176 |
| 12 | 1543 | 1542.47924757924 | 0.520752420761695 |
| 13 | 1549 | 1548.76740871918 | 0.232591280823706 |
| 14 | 1556 | 1556.97357521868 | -0.973575218678098 |
| 15 | 1559 | 1561.34511868127 | -2.34511868126749 |
| 16 | 1559 | 1562.40603453921 | -3.40603453921207 |
| 17 | 1563 | 1567.73991960791 | -4.73991960790721 |
| 18 | 1563 | 1567.02279872912 | -4.02279872911882 |
| 19 | 1564 | 1568.06621449689 | -4.06621449689033 |
| 20 | 1564 | 1567.52052383535 | -3.52052383534908 |
| 21 | 1557 | 1561.04068651572 | -4.04068651572201 |
| 22 | 1554 | 1557.1762090315 | -3.17620903150279 |
| 23 | 1552 | 1552.17649440782 | -0.176494407822091 |
| 24 | 1552 | 1551.28429499341 | 0.715705006590435 |
| 25 | 1551 | 1549.5662482069 | 1.43375179310018 |
| 26 | 1552 | 1547.9531538136 | 4.04684618640213 |
| 27 | 1554 | 1549.92375312685 | 4.07624687314883 |
| 28 | 1567 | 1564.36845214976 | 2.63154785023535 |
| 29 | 1572 | 1568.20667535722 | 3.7933246427766 |
| 30 | 1579 | 1577.5210801536 | 1.4789198464041 |
| 31 | 1588 | 1586.51810989413 | 1.48189010587435 |
| 32 | 1597 | 1594.95628585304 | 2.04371414695742 |
| 33 | 1603 | 1601.41587721023 | 1.58412278977228 |
| 34 | 1607 | 1605.99984333545 | 1.00015666454794 |
| 35 | 1607 | 1607.01626026063 | -0.0162602606327763 |
| 36 | 1609 | 1609.58075907118 | -0.580759071184693 |
| 37 | 1612 | 1612.80555756918 | -0.805557569181171 |
| 38 | 1615 | 1615.58448811508 | -0.584488115081739 |
| 39 | 1619 | 1620.12397135682 | -1.12397135681909 |
| 40 | 1622 | 1623.1503247457 | -1.15032474570075 |
| 41 | 1628 | 1629.64136164803 | -1.64136164802533 |
| 42 | 1634 | 1635.57496454951 | -1.57496454950602 |
| 43 | 1640 | 1639.55771281479 | 0.442287185208588 |
| 44 | 1648 | 1648.06235054847 | -0.0623505484707959 |
| 45 | 1657 | 1656.82599658416 | 0.174003415843905 |
| 46 | 1668 | 1668.83981676404 | -0.839816764042268 |
| 47 | 1678 | 1678.26733055916 | -0.267330559164706 |
| 48 | 1687 | 1688.8380828315 | -1.83808283150399 |
| 49 | 1700 | 1697.18083463569 | 2.81916536430642 |
| 50 | 1714 | 1710.20149274196 | 3.79850725804165 |
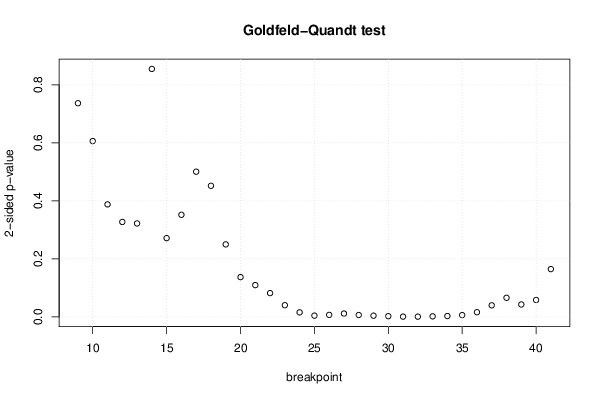
| Goldfeld-Quandt test for Heteroskedasticity | |||
| p-values | Alternative Hypothesis | ||
| breakpoint index | greater | 2-sided | less |
| 9 | 0.368215645734727 | 0.736431291469454 | 0.631784354265273 |
| 10 | 0.303002846335439 | 0.606005692670878 | 0.696997153664561 |
| 11 | 0.193950193205303 | 0.387900386410606 | 0.806049806794697 |
| 12 | 0.163652523057557 | 0.327305046115115 | 0.836347476942443 |
| 13 | 0.161093764157218 | 0.322187528314437 | 0.838906235842781 |
| 14 | 0.57270503928245 | 0.854589921435101 | 0.42729496071755 |
| 15 | 0.864237346688417 | 0.271525306623165 | 0.135762653311583 |
| 16 | 0.8240042934166 | 0.3519914131668 | 0.1759957065834 |
| 17 | 0.749766542966346 | 0.500466914067309 | 0.250233457033654 |
| 18 | 0.774021165785398 | 0.451957668429203 | 0.225978834214602 |
| 19 | 0.874982171481606 | 0.250035657036788 | 0.125017828518394 |
| 20 | 0.931395390675884 | 0.137209218648233 | 0.0686046093241163 |
| 21 | 0.945151830229876 | 0.109696339540249 | 0.0548481697701244 |
| 22 | 0.958924354713148 | 0.0821512905737034 | 0.0410756452868517 |
| 23 | 0.979828483775935 | 0.0403430324481299 | 0.0201715162240649 |
| 24 | 0.99213049735611 | 0.0157390052877809 | 0.00786950264389047 |
| 25 | 0.997769392772786 | 0.00446121445442781 | 0.00223060722721391 |
| 26 | 0.996520420371904 | 0.00695915925619211 | 0.00347957962809605 |
| 27 | 0.994204553167968 | 0.0115908936640632 | 0.0057954468320316 |
| 28 | 0.996684808659726 | 0.00663038268054841 | 0.00331519134027421 |
| 29 | 0.997911490934923 | 0.00417701813015341 | 0.0020885090650767 |
| 30 | 0.998709148401858 | 0.00258170319628329 | 0.00129085159814164 |
| 31 | 0.999482758177923 | 0.00103448364415479 | 0.000517241822077394 |
| 32 | 0.999527391462197 | 0.000945217075605814 | 0.000472608537802907 |
| 33 | 0.998981676244676 | 0.00203664751064884 | 0.00101832375532442 |
| 34 | 0.99849282530945 | 0.00301434938109949 | 0.00150717469054974 |
| 35 | 0.996832562655847 | 0.00633487468830518 | 0.00316743734415259 |
| 36 | 0.991865345927472 | 0.0162693081450557 | 0.00813465407252785 |
| 37 | 0.979999496557087 | 0.0400010068858258 | 0.0200005034429129 |
| 38 | 0.967031460322736 | 0.0659370793545287 | 0.0329685396772644 |
| 39 | 0.978553524974393 | 0.0428929500512141 | 0.021446475025607 |
| 40 | 0.970856815648735 | 0.0582863687025291 | 0.0291431843512646 |
| 41 | 0.917589197114531 | 0.164821605770938 | 0.0824108028854691 |
| Meta Analysis of Goldfeld-Quandt test for Heteroskedasticity | |||
| Description | # significant tests | % significant tests | OK/NOK |
| 1% type I error level | 10 | 0.303030303030303 | NOK |
| 5% type I error level | 16 | 0.484848484848485 | NOK |
| 10% type I error level | 19 | 0.575757575757576 | NOK |