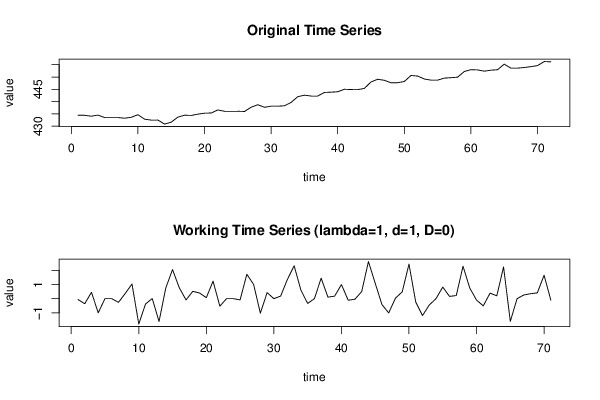
Free Statistics

of Irreproducible Research!

Author's title

Author*Unverified author*
R Software Modulerwasp_autocorrelation.wasp
Title produced by software(Partial) Autocorrelation Function
Date of computationSun, 30 Dec 2012 12:39:40 -0500
Cite this page as followsStatistical Computations at FreeStatistics.org, Office for Research Development and Education, URL https://freestatistics.org/blog/index.php?v=date/2012/Dec/30/t1356889376tafws5xjtrolz7g.htm/, Retrieved Fri, 26 Apr 2024 22:24:51 +0000
Statistical Computations at FreeStatistics.org, Office for Research Development and Education, URL https://freestatistics.org/blog/index.php?pk=204957, Retrieved Fri, 26 Apr 2024 22:24:51 +0000
QR Codes:

Original text written by user:
IsPrivate?No (this computation is public)
User-defined keywords
Estimated Impact140
Family? (F = Feedback message, R = changed R code, M = changed R Module, P = changed Parameters, D = changed Data)
-       [(Partial) Autocorrelation Function] [Gemiddelde prijs ...] [2012-12-30 17:39:40] [5ebf8d45d440e2351c3182f635b9c69f] [Current]
Feedback Forum

Post a new message
Dataseries X:
434.49
434.43
434.07
434.52
433.52
433.52
433.52
433.26
433.63
434.67
432.87
432.49
432.5
430.88
431.64
433.7
434.47
434.38
434.9
435.3
435.37
436.61
436.08
436.08
436.08
435.99
437.72
438.73
437.7
438.13
438.13
438.31
439.67
442
442.61
442.27
442.27
443.72
443.83
444.01
445.01
444.9
444.86
445.36
447.99
449.08
448.66
447.65
447.69
448.17
450.62
450.38
449.18
448.73
448.73
449.55
449.71
449.93
452.23
452.98
452.88
452.37
452.76
452.96
455.21
453.6
453.6
453.86
454.21
454.62
456.28
456.17


Summary of computational transaction
Raw Inputview raw input (R code)
Raw Outputview raw output of R engine
Computing time2 seconds
R Server'Sir Ronald Aylmer Fisher' @ fisher.wessa.net
R Framework error message
Warning: there are blank lines in the 'Data' field.
Please, use NA for missing data - blank lines are simply
 deleted and are NOT treated as missing values.

\begin{tabular}{lllllllll}
\hline
Summary of computational transaction \tabularnewline
Raw Input & view raw input (R code)  \tabularnewline
Raw Output & view raw output of R engine  \tabularnewline
Computing time & 2 seconds \tabularnewline
R Server & 'Sir Ronald Aylmer Fisher' @ fisher.wessa.net \tabularnewline
R Framework error message & 
Warning: there are blank lines in the 'Data' field.
Please, use NA for missing data - blank lines are simply
 deleted and are NOT treated as missing values.
\tabularnewline \hline \end{tabular} %Source: https://freestatistics.org/blog/index.php?pk=204957&T=0

[TABLE]
[ROW][C]Summary of computational transaction[/C][/ROW]
[ROW][C]Raw Input[/C][C]view raw input (R code) [/C][/ROW]
[ROW][C]Raw Output[/C][C]view raw output of R engine [/C][/ROW]
[ROW][C]Computing time[/C][C]2 seconds[/C][/ROW]
[ROW][C]R Server[/C][C]'Sir Ronald Aylmer Fisher' @ fisher.wessa.net[/C][/ROW]
[ROW][C]R Framework error message[/C][C]
Warning: there are blank lines in the 'Data' field.
Please, use NA for missing data - blank lines are simply
 deleted and are NOT treated as missing values.
[/C][/ROW] [/TABLE] Source: https://freestatistics.org/blog/index.php?pk=204957&T=0

Globally Unique Identifier (entire table): ba.freestatistics.org/blog/index.php?pk=204957&T=0

As an alternative you can also use a QR Code:  

The GUIDs for individual cells are displayed in the table below:

Summary of computational transaction
Raw Inputview raw input (R code)
Raw Outputview raw output of R engine
Computing time2 seconds
R Server'Sir Ronald Aylmer Fisher' @ fisher.wessa.net
R Framework error message
Warning: there are blank lines in the 'Data' field.
Please, use NA for missing data - blank lines are simply
 deleted and are NOT treated as missing values.


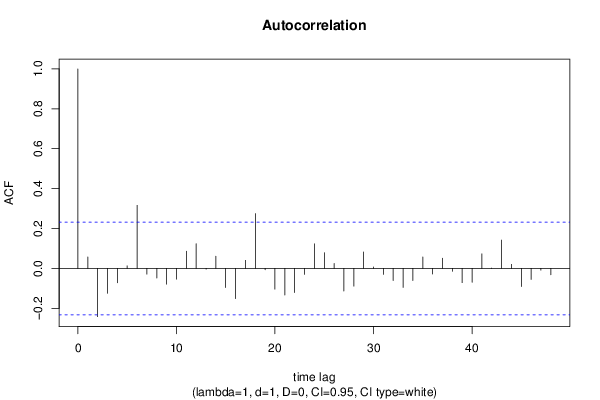
Autocorrelation Function
Time lag kACF(k)T-STATP-value
10.057480.48430.314819
2-0.241994-2.03910.022583
3-0.124767-1.05130.148342
4-0.071961-0.60640.273107
50.0128190.1080.457145
60.3160452.6630.004787
7-0.028735-0.24210.40469
8-0.047961-0.40410.343666
9-0.078942-0.66520.254045
10-0.054014-0.45510.325201
110.0861410.72580.235162
120.1236291.04170.150539
13-0.003827-0.03220.487182
140.0609280.51340.304637
15-0.096099-0.80970.210395
16-0.151461-1.27620.103016
170.0403480.340.367439
180.2747882.31540.011742
19-0.00658-0.05540.477971
20-0.104038-0.87660.19182
21-0.13317-1.12210.132798
22-0.120763-1.01760.15617
23-0.030105-0.25370.400242
240.1229421.03590.151876
250.0787760.66380.254491
260.0248340.20930.417423
27-0.113073-0.95280.17197
28-0.089119-0.75090.227588
290.0825180.69530.244567
300.0074290.06260.475131
31-0.030106-0.25370.40024
32-0.060943-0.51350.304592
33-0.095115-0.80150.212771
34-0.060646-0.5110.305464
350.0573880.48360.315092
36-0.028493-0.24010.405477
370.0509690.42950.33444
38-0.013998-0.11790.453222
39-0.071416-0.60180.274626
40-0.069348-0.58430.280422
410.0728420.61380.270661
42-0.000791-0.00670.49735
430.1419511.19610.117818
440.0200830.16920.433051
45-0.090876-0.76570.223186
46-0.055083-0.46410.321984
47-0.008944-0.07540.470068
48-0.031536-0.26570.39561

\begin{tabular}{lllllllll}
\hline
Autocorrelation Function \tabularnewline
Time lag k & ACF(k) & T-STAT & P-value \tabularnewline
1 & 0.05748 & 0.4843 & 0.314819 \tabularnewline
2 & -0.241994 & -2.0391 & 0.022583 \tabularnewline
3 & -0.124767 & -1.0513 & 0.148342 \tabularnewline
4 & -0.071961 & -0.6064 & 0.273107 \tabularnewline
5 & 0.012819 & 0.108 & 0.457145 \tabularnewline
6 & 0.316045 & 2.663 & 0.004787 \tabularnewline
7 & -0.028735 & -0.2421 & 0.40469 \tabularnewline
8 & -0.047961 & -0.4041 & 0.343666 \tabularnewline
9 & -0.078942 & -0.6652 & 0.254045 \tabularnewline
10 & -0.054014 & -0.4551 & 0.325201 \tabularnewline
11 & 0.086141 & 0.7258 & 0.235162 \tabularnewline
12 & 0.123629 & 1.0417 & 0.150539 \tabularnewline
13 & -0.003827 & -0.0322 & 0.487182 \tabularnewline
14 & 0.060928 & 0.5134 & 0.304637 \tabularnewline
15 & -0.096099 & -0.8097 & 0.210395 \tabularnewline
16 & -0.151461 & -1.2762 & 0.103016 \tabularnewline
17 & 0.040348 & 0.34 & 0.367439 \tabularnewline
18 & 0.274788 & 2.3154 & 0.011742 \tabularnewline
19 & -0.00658 & -0.0554 & 0.477971 \tabularnewline
20 & -0.104038 & -0.8766 & 0.19182 \tabularnewline
21 & -0.13317 & -1.1221 & 0.132798 \tabularnewline
22 & -0.120763 & -1.0176 & 0.15617 \tabularnewline
23 & -0.030105 & -0.2537 & 0.400242 \tabularnewline
24 & 0.122942 & 1.0359 & 0.151876 \tabularnewline
25 & 0.078776 & 0.6638 & 0.254491 \tabularnewline
26 & 0.024834 & 0.2093 & 0.417423 \tabularnewline
27 & -0.113073 & -0.9528 & 0.17197 \tabularnewline
28 & -0.089119 & -0.7509 & 0.227588 \tabularnewline
29 & 0.082518 & 0.6953 & 0.244567 \tabularnewline
30 & 0.007429 & 0.0626 & 0.475131 \tabularnewline
31 & -0.030106 & -0.2537 & 0.40024 \tabularnewline
32 & -0.060943 & -0.5135 & 0.304592 \tabularnewline
33 & -0.095115 & -0.8015 & 0.212771 \tabularnewline
34 & -0.060646 & -0.511 & 0.305464 \tabularnewline
35 & 0.057388 & 0.4836 & 0.315092 \tabularnewline
36 & -0.028493 & -0.2401 & 0.405477 \tabularnewline
37 & 0.050969 & 0.4295 & 0.33444 \tabularnewline
38 & -0.013998 & -0.1179 & 0.453222 \tabularnewline
39 & -0.071416 & -0.6018 & 0.274626 \tabularnewline
40 & -0.069348 & -0.5843 & 0.280422 \tabularnewline
41 & 0.072842 & 0.6138 & 0.270661 \tabularnewline
42 & -0.000791 & -0.0067 & 0.49735 \tabularnewline
43 & 0.141951 & 1.1961 & 0.117818 \tabularnewline
44 & 0.020083 & 0.1692 & 0.433051 \tabularnewline
45 & -0.090876 & -0.7657 & 0.223186 \tabularnewline
46 & -0.055083 & -0.4641 & 0.321984 \tabularnewline
47 & -0.008944 & -0.0754 & 0.470068 \tabularnewline
48 & -0.031536 & -0.2657 & 0.39561 \tabularnewline
\hline
\end{tabular}
%Source: https://freestatistics.org/blog/index.php?pk=204957&T=1

[TABLE]
[ROW][C]Autocorrelation Function[/C][/ROW]
[ROW][C]Time lag k[/C][C]ACF(k)[/C][C]T-STAT[/C][C]P-value[/C][/ROW]
[ROW][C]1[/C][C]0.05748[/C][C]0.4843[/C][C]0.314819[/C][/ROW]
[ROW][C]2[/C][C]-0.241994[/C][C]-2.0391[/C][C]0.022583[/C][/ROW]
[ROW][C]3[/C][C]-0.124767[/C][C]-1.0513[/C][C]0.148342[/C][/ROW]
[ROW][C]4[/C][C]-0.071961[/C][C]-0.6064[/C][C]0.273107[/C][/ROW]
[ROW][C]5[/C][C]0.012819[/C][C]0.108[/C][C]0.457145[/C][/ROW]
[ROW][C]6[/C][C]0.316045[/C][C]2.663[/C][C]0.004787[/C][/ROW]
[ROW][C]7[/C][C]-0.028735[/C][C]-0.2421[/C][C]0.40469[/C][/ROW]
[ROW][C]8[/C][C]-0.047961[/C][C]-0.4041[/C][C]0.343666[/C][/ROW]
[ROW][C]9[/C][C]-0.078942[/C][C]-0.6652[/C][C]0.254045[/C][/ROW]
[ROW][C]10[/C][C]-0.054014[/C][C]-0.4551[/C][C]0.325201[/C][/ROW]
[ROW][C]11[/C][C]0.086141[/C][C]0.7258[/C][C]0.235162[/C][/ROW]
[ROW][C]12[/C][C]0.123629[/C][C]1.0417[/C][C]0.150539[/C][/ROW]
[ROW][C]13[/C][C]-0.003827[/C][C]-0.0322[/C][C]0.487182[/C][/ROW]
[ROW][C]14[/C][C]0.060928[/C][C]0.5134[/C][C]0.304637[/C][/ROW]
[ROW][C]15[/C][C]-0.096099[/C][C]-0.8097[/C][C]0.210395[/C][/ROW]
[ROW][C]16[/C][C]-0.151461[/C][C]-1.2762[/C][C]0.103016[/C][/ROW]
[ROW][C]17[/C][C]0.040348[/C][C]0.34[/C][C]0.367439[/C][/ROW]
[ROW][C]18[/C][C]0.274788[/C][C]2.3154[/C][C]0.011742[/C][/ROW]
[ROW][C]19[/C][C]-0.00658[/C][C]-0.0554[/C][C]0.477971[/C][/ROW]
[ROW][C]20[/C][C]-0.104038[/C][C]-0.8766[/C][C]0.19182[/C][/ROW]
[ROW][C]21[/C][C]-0.13317[/C][C]-1.1221[/C][C]0.132798[/C][/ROW]
[ROW][C]22[/C][C]-0.120763[/C][C]-1.0176[/C][C]0.15617[/C][/ROW]
[ROW][C]23[/C][C]-0.030105[/C][C]-0.2537[/C][C]0.400242[/C][/ROW]
[ROW][C]24[/C][C]0.122942[/C][C]1.0359[/C][C]0.151876[/C][/ROW]
[ROW][C]25[/C][C]0.078776[/C][C]0.6638[/C][C]0.254491[/C][/ROW]
[ROW][C]26[/C][C]0.024834[/C][C]0.2093[/C][C]0.417423[/C][/ROW]
[ROW][C]27[/C][C]-0.113073[/C][C]-0.9528[/C][C]0.17197[/C][/ROW]
[ROW][C]28[/C][C]-0.089119[/C][C]-0.7509[/C][C]0.227588[/C][/ROW]
[ROW][C]29[/C][C]0.082518[/C][C]0.6953[/C][C]0.244567[/C][/ROW]
[ROW][C]30[/C][C]0.007429[/C][C]0.0626[/C][C]0.475131[/C][/ROW]
[ROW][C]31[/C][C]-0.030106[/C][C]-0.2537[/C][C]0.40024[/C][/ROW]
[ROW][C]32[/C][C]-0.060943[/C][C]-0.5135[/C][C]0.304592[/C][/ROW]
[ROW][C]33[/C][C]-0.095115[/C][C]-0.8015[/C][C]0.212771[/C][/ROW]
[ROW][C]34[/C][C]-0.060646[/C][C]-0.511[/C][C]0.305464[/C][/ROW]
[ROW][C]35[/C][C]0.057388[/C][C]0.4836[/C][C]0.315092[/C][/ROW]
[ROW][C]36[/C][C]-0.028493[/C][C]-0.2401[/C][C]0.405477[/C][/ROW]
[ROW][C]37[/C][C]0.050969[/C][C]0.4295[/C][C]0.33444[/C][/ROW]
[ROW][C]38[/C][C]-0.013998[/C][C]-0.1179[/C][C]0.453222[/C][/ROW]
[ROW][C]39[/C][C]-0.071416[/C][C]-0.6018[/C][C]0.274626[/C][/ROW]
[ROW][C]40[/C][C]-0.069348[/C][C]-0.5843[/C][C]0.280422[/C][/ROW]
[ROW][C]41[/C][C]0.072842[/C][C]0.6138[/C][C]0.270661[/C][/ROW]
[ROW][C]42[/C][C]-0.000791[/C][C]-0.0067[/C][C]0.49735[/C][/ROW]
[ROW][C]43[/C][C]0.141951[/C][C]1.1961[/C][C]0.117818[/C][/ROW]
[ROW][C]44[/C][C]0.020083[/C][C]0.1692[/C][C]0.433051[/C][/ROW]
[ROW][C]45[/C][C]-0.090876[/C][C]-0.7657[/C][C]0.223186[/C][/ROW]
[ROW][C]46[/C][C]-0.055083[/C][C]-0.4641[/C][C]0.321984[/C][/ROW]
[ROW][C]47[/C][C]-0.008944[/C][C]-0.0754[/C][C]0.470068[/C][/ROW]
[ROW][C]48[/C][C]-0.031536[/C][C]-0.2657[/C][C]0.39561[/C][/ROW]
[/TABLE]
Source: https://freestatistics.org/blog/index.php?pk=204957&T=1

Globally Unique Identifier (entire table): ba.freestatistics.org/blog/index.php?pk=204957&T=1

As an alternative you can also use a QR Code:  

The GUIDs for individual cells are displayed in the table below:

Autocorrelation Function
Time lag kACF(k)T-STATP-value
10.057480.48430.314819
2-0.241994-2.03910.022583
3-0.124767-1.05130.148342
4-0.071961-0.60640.273107
50.0128190.1080.457145
60.3160452.6630.004787
7-0.028735-0.24210.40469
8-0.047961-0.40410.343666
9-0.078942-0.66520.254045
10-0.054014-0.45510.325201
110.0861410.72580.235162
120.1236291.04170.150539
13-0.003827-0.03220.487182
140.0609280.51340.304637
15-0.096099-0.80970.210395
16-0.151461-1.27620.103016
170.0403480.340.367439
180.2747882.31540.011742
19-0.00658-0.05540.477971
20-0.104038-0.87660.19182
21-0.13317-1.12210.132798
22-0.120763-1.01760.15617
23-0.030105-0.25370.400242
240.1229421.03590.151876
250.0787760.66380.254491
260.0248340.20930.417423
27-0.113073-0.95280.17197
28-0.089119-0.75090.227588
290.0825180.69530.244567
300.0074290.06260.475131
31-0.030106-0.25370.40024
32-0.060943-0.51350.304592
33-0.095115-0.80150.212771
34-0.060646-0.5110.305464
350.0573880.48360.315092
36-0.028493-0.24010.405477
370.0509690.42950.33444
38-0.013998-0.11790.453222
39-0.071416-0.60180.274626
40-0.069348-0.58430.280422
410.0728420.61380.270661
42-0.000791-0.00670.49735
430.1419511.19610.117818
440.0200830.16920.433051
45-0.090876-0.76570.223186
46-0.055083-0.46410.321984
47-0.008944-0.07540.470068
48-0.031536-0.26570.39561


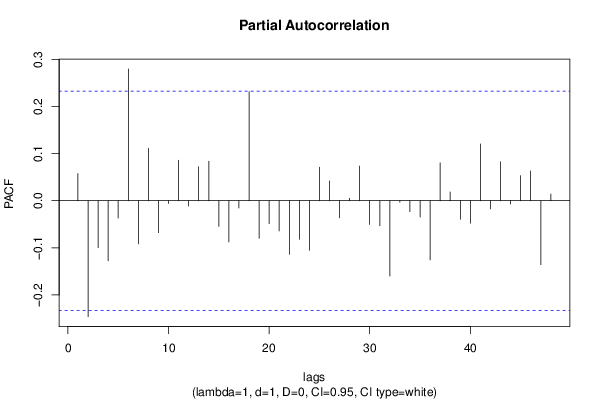
Partial Autocorrelation Function
Time lag kPACF(k)T-STATP-value
10.057480.48430.314819
2-0.246111-2.07380.020865
3-0.099631-0.83950.202001
4-0.12749-1.07430.143174
5-0.0369-0.31090.378384
60.2796482.35640.01061
7-0.091657-0.77230.221245
80.1113950.93860.175551
9-0.067722-0.57060.285025
10-0.006031-0.05080.479808
110.0857870.72290.236071
12-0.011464-0.09660.461659
130.0720410.6070.272884
140.0839330.70720.24087
15-0.054599-0.46010.32344
16-0.087419-0.73660.231895
17-0.015607-0.13150.447874
180.2314981.95060.027524
19-0.079672-0.67130.252094
20-0.048685-0.41020.341439
21-0.064075-0.53990.295477
22-0.113736-0.95840.170567
23-0.081808-0.68930.246433
24-0.105221-0.88660.189141
250.0709040.59750.276053
260.0418720.35280.362636
27-0.036404-0.30670.379967
280.0051060.0430.4829
290.0734440.61880.268998
30-0.050671-0.4270.33535
31-0.053228-0.44850.327576
32-0.159791-1.34640.091224
33-0.003321-0.0280.488878
34-0.023192-0.19540.422811
35-0.034459-0.29040.386195
36-0.125648-1.05870.146657
370.0803510.6770.250288
380.0183240.15440.438865
39-0.039318-0.33130.370699
40-0.047611-0.40120.344747
410.1202651.01340.157161
42-0.017355-0.14620.442076
430.0827330.69710.244001
44-0.006987-0.05890.476608
450.0533230.44930.327288
460.0631130.53180.298264
47-0.135644-1.1430.128449
480.0139630.11770.453338

\begin{tabular}{lllllllll}
\hline
Partial Autocorrelation Function \tabularnewline
Time lag k & PACF(k) & T-STAT & P-value \tabularnewline
1 & 0.05748 & 0.4843 & 0.314819 \tabularnewline
2 & -0.246111 & -2.0738 & 0.020865 \tabularnewline
3 & -0.099631 & -0.8395 & 0.202001 \tabularnewline
4 & -0.12749 & -1.0743 & 0.143174 \tabularnewline
5 & -0.0369 & -0.3109 & 0.378384 \tabularnewline
6 & 0.279648 & 2.3564 & 0.01061 \tabularnewline
7 & -0.091657 & -0.7723 & 0.221245 \tabularnewline
8 & 0.111395 & 0.9386 & 0.175551 \tabularnewline
9 & -0.067722 & -0.5706 & 0.285025 \tabularnewline
10 & -0.006031 & -0.0508 & 0.479808 \tabularnewline
11 & 0.085787 & 0.7229 & 0.236071 \tabularnewline
12 & -0.011464 & -0.0966 & 0.461659 \tabularnewline
13 & 0.072041 & 0.607 & 0.272884 \tabularnewline
14 & 0.083933 & 0.7072 & 0.24087 \tabularnewline
15 & -0.054599 & -0.4601 & 0.32344 \tabularnewline
16 & -0.087419 & -0.7366 & 0.231895 \tabularnewline
17 & -0.015607 & -0.1315 & 0.447874 \tabularnewline
18 & 0.231498 & 1.9506 & 0.027524 \tabularnewline
19 & -0.079672 & -0.6713 & 0.252094 \tabularnewline
20 & -0.048685 & -0.4102 & 0.341439 \tabularnewline
21 & -0.064075 & -0.5399 & 0.295477 \tabularnewline
22 & -0.113736 & -0.9584 & 0.170567 \tabularnewline
23 & -0.081808 & -0.6893 & 0.246433 \tabularnewline
24 & -0.105221 & -0.8866 & 0.189141 \tabularnewline
25 & 0.070904 & 0.5975 & 0.276053 \tabularnewline
26 & 0.041872 & 0.3528 & 0.362636 \tabularnewline
27 & -0.036404 & -0.3067 & 0.379967 \tabularnewline
28 & 0.005106 & 0.043 & 0.4829 \tabularnewline
29 & 0.073444 & 0.6188 & 0.268998 \tabularnewline
30 & -0.050671 & -0.427 & 0.33535 \tabularnewline
31 & -0.053228 & -0.4485 & 0.327576 \tabularnewline
32 & -0.159791 & -1.3464 & 0.091224 \tabularnewline
33 & -0.003321 & -0.028 & 0.488878 \tabularnewline
34 & -0.023192 & -0.1954 & 0.422811 \tabularnewline
35 & -0.034459 & -0.2904 & 0.386195 \tabularnewline
36 & -0.125648 & -1.0587 & 0.146657 \tabularnewline
37 & 0.080351 & 0.677 & 0.250288 \tabularnewline
38 & 0.018324 & 0.1544 & 0.438865 \tabularnewline
39 & -0.039318 & -0.3313 & 0.370699 \tabularnewline
40 & -0.047611 & -0.4012 & 0.344747 \tabularnewline
41 & 0.120265 & 1.0134 & 0.157161 \tabularnewline
42 & -0.017355 & -0.1462 & 0.442076 \tabularnewline
43 & 0.082733 & 0.6971 & 0.244001 \tabularnewline
44 & -0.006987 & -0.0589 & 0.476608 \tabularnewline
45 & 0.053323 & 0.4493 & 0.327288 \tabularnewline
46 & 0.063113 & 0.5318 & 0.298264 \tabularnewline
47 & -0.135644 & -1.143 & 0.128449 \tabularnewline
48 & 0.013963 & 0.1177 & 0.453338 \tabularnewline
\hline
\end{tabular}
%Source: https://freestatistics.org/blog/index.php?pk=204957&T=2

[TABLE]
[ROW][C]Partial Autocorrelation Function[/C][/ROW]
[ROW][C]Time lag k[/C][C]PACF(k)[/C][C]T-STAT[/C][C]P-value[/C][/ROW]
[ROW][C]1[/C][C]0.05748[/C][C]0.4843[/C][C]0.314819[/C][/ROW]
[ROW][C]2[/C][C]-0.246111[/C][C]-2.0738[/C][C]0.020865[/C][/ROW]
[ROW][C]3[/C][C]-0.099631[/C][C]-0.8395[/C][C]0.202001[/C][/ROW]
[ROW][C]4[/C][C]-0.12749[/C][C]-1.0743[/C][C]0.143174[/C][/ROW]
[ROW][C]5[/C][C]-0.0369[/C][C]-0.3109[/C][C]0.378384[/C][/ROW]
[ROW][C]6[/C][C]0.279648[/C][C]2.3564[/C][C]0.01061[/C][/ROW]
[ROW][C]7[/C][C]-0.091657[/C][C]-0.7723[/C][C]0.221245[/C][/ROW]
[ROW][C]8[/C][C]0.111395[/C][C]0.9386[/C][C]0.175551[/C][/ROW]
[ROW][C]9[/C][C]-0.067722[/C][C]-0.5706[/C][C]0.285025[/C][/ROW]
[ROW][C]10[/C][C]-0.006031[/C][C]-0.0508[/C][C]0.479808[/C][/ROW]
[ROW][C]11[/C][C]0.085787[/C][C]0.7229[/C][C]0.236071[/C][/ROW]
[ROW][C]12[/C][C]-0.011464[/C][C]-0.0966[/C][C]0.461659[/C][/ROW]
[ROW][C]13[/C][C]0.072041[/C][C]0.607[/C][C]0.272884[/C][/ROW]
[ROW][C]14[/C][C]0.083933[/C][C]0.7072[/C][C]0.24087[/C][/ROW]
[ROW][C]15[/C][C]-0.054599[/C][C]-0.4601[/C][C]0.32344[/C][/ROW]
[ROW][C]16[/C][C]-0.087419[/C][C]-0.7366[/C][C]0.231895[/C][/ROW]
[ROW][C]17[/C][C]-0.015607[/C][C]-0.1315[/C][C]0.447874[/C][/ROW]
[ROW][C]18[/C][C]0.231498[/C][C]1.9506[/C][C]0.027524[/C][/ROW]
[ROW][C]19[/C][C]-0.079672[/C][C]-0.6713[/C][C]0.252094[/C][/ROW]
[ROW][C]20[/C][C]-0.048685[/C][C]-0.4102[/C][C]0.341439[/C][/ROW]
[ROW][C]21[/C][C]-0.064075[/C][C]-0.5399[/C][C]0.295477[/C][/ROW]
[ROW][C]22[/C][C]-0.113736[/C][C]-0.9584[/C][C]0.170567[/C][/ROW]
[ROW][C]23[/C][C]-0.081808[/C][C]-0.6893[/C][C]0.246433[/C][/ROW]
[ROW][C]24[/C][C]-0.105221[/C][C]-0.8866[/C][C]0.189141[/C][/ROW]
[ROW][C]25[/C][C]0.070904[/C][C]0.5975[/C][C]0.276053[/C][/ROW]
[ROW][C]26[/C][C]0.041872[/C][C]0.3528[/C][C]0.362636[/C][/ROW]
[ROW][C]27[/C][C]-0.036404[/C][C]-0.3067[/C][C]0.379967[/C][/ROW]
[ROW][C]28[/C][C]0.005106[/C][C]0.043[/C][C]0.4829[/C][/ROW]
[ROW][C]29[/C][C]0.073444[/C][C]0.6188[/C][C]0.268998[/C][/ROW]
[ROW][C]30[/C][C]-0.050671[/C][C]-0.427[/C][C]0.33535[/C][/ROW]
[ROW][C]31[/C][C]-0.053228[/C][C]-0.4485[/C][C]0.327576[/C][/ROW]
[ROW][C]32[/C][C]-0.159791[/C][C]-1.3464[/C][C]0.091224[/C][/ROW]
[ROW][C]33[/C][C]-0.003321[/C][C]-0.028[/C][C]0.488878[/C][/ROW]
[ROW][C]34[/C][C]-0.023192[/C][C]-0.1954[/C][C]0.422811[/C][/ROW]
[ROW][C]35[/C][C]-0.034459[/C][C]-0.2904[/C][C]0.386195[/C][/ROW]
[ROW][C]36[/C][C]-0.125648[/C][C]-1.0587[/C][C]0.146657[/C][/ROW]
[ROW][C]37[/C][C]0.080351[/C][C]0.677[/C][C]0.250288[/C][/ROW]
[ROW][C]38[/C][C]0.018324[/C][C]0.1544[/C][C]0.438865[/C][/ROW]
[ROW][C]39[/C][C]-0.039318[/C][C]-0.3313[/C][C]0.370699[/C][/ROW]
[ROW][C]40[/C][C]-0.047611[/C][C]-0.4012[/C][C]0.344747[/C][/ROW]
[ROW][C]41[/C][C]0.120265[/C][C]1.0134[/C][C]0.157161[/C][/ROW]
[ROW][C]42[/C][C]-0.017355[/C][C]-0.1462[/C][C]0.442076[/C][/ROW]
[ROW][C]43[/C][C]0.082733[/C][C]0.6971[/C][C]0.244001[/C][/ROW]
[ROW][C]44[/C][C]-0.006987[/C][C]-0.0589[/C][C]0.476608[/C][/ROW]
[ROW][C]45[/C][C]0.053323[/C][C]0.4493[/C][C]0.327288[/C][/ROW]
[ROW][C]46[/C][C]0.063113[/C][C]0.5318[/C][C]0.298264[/C][/ROW]
[ROW][C]47[/C][C]-0.135644[/C][C]-1.143[/C][C]0.128449[/C][/ROW]
[ROW][C]48[/C][C]0.013963[/C][C]0.1177[/C][C]0.453338[/C][/ROW]
[/TABLE]
Source: https://freestatistics.org/blog/index.php?pk=204957&T=2

Globally Unique Identifier (entire table): ba.freestatistics.org/blog/index.php?pk=204957&T=2

As an alternative you can also use a QR Code:  

The GUIDs for individual cells are displayed in the table below:

Partial Autocorrelation Function
Time lag kPACF(k)T-STATP-value
10.057480.48430.314819
2-0.246111-2.07380.020865
3-0.099631-0.83950.202001
4-0.12749-1.07430.143174
5-0.0369-0.31090.378384
60.2796482.35640.01061
7-0.091657-0.77230.221245
80.1113950.93860.175551
9-0.067722-0.57060.285025
10-0.006031-0.05080.479808
110.0857870.72290.236071
12-0.011464-0.09660.461659
130.0720410.6070.272884
140.0839330.70720.24087
15-0.054599-0.46010.32344
16-0.087419-0.73660.231895
17-0.015607-0.13150.447874
180.2314981.95060.027524
19-0.079672-0.67130.252094
20-0.048685-0.41020.341439
21-0.064075-0.53990.295477
22-0.113736-0.95840.170567
23-0.081808-0.68930.246433
24-0.105221-0.88660.189141
250.0709040.59750.276053
260.0418720.35280.362636
27-0.036404-0.30670.379967
280.0051060.0430.4829
290.0734440.61880.268998
30-0.050671-0.4270.33535
31-0.053228-0.44850.327576
32-0.159791-1.34640.091224
33-0.003321-0.0280.488878
34-0.023192-0.19540.422811
35-0.034459-0.29040.386195
36-0.125648-1.05870.146657
370.0803510.6770.250288
380.0183240.15440.438865
39-0.039318-0.33130.370699
40-0.047611-0.40120.344747
410.1202651.01340.157161
42-0.017355-0.14620.442076
430.0827330.69710.244001
44-0.006987-0.05890.476608
450.0533230.44930.327288
460.0631130.53180.298264
47-0.135644-1.1430.128449
480.0139630.11770.453338


Parameters (Session):
par1 = 48 ; par2 = 1 ; par3 = 1 ; par4 = 0 ; par5 = 12 ; par6 = White Noise ; par7 = 0.95 ;
Parameters (R input):
par1 = 48 ; par2 = 1 ; par3 = 1 ; par4 = 0 ; par5 = 12 ; par6 = White Noise ; par7 = 0.95 ; par8 = ;
R code (references can be found in the software module):
par8 <- ''
par7 <- '0.95'
par6 <- 'White Noise'
par5 <- '12'
par4 <- '0'
par3 <- '0'
par2 <- '1'
par1 <- '48'
if (par1 == 'Default') {
par1 = 10*log10(length(x))
} else {
par1 <- as.numeric(par1)
}
par2 <- as.numeric(par2)
par3 <- as.numeric(par3)
par4 <- as.numeric(par4)
par5 <- as.numeric(par5)
if (par6 == 'White Noise') par6 <- 'white' else par6 <- 'ma'
par7 <- as.numeric(par7)
if (par8 != '') par8 <- as.numeric(par8)
ox <- x
if (par8 == '') {
if (par2 == 0) {
x <- log(x)
} else {
x <- (x ^ par2 - 1) / par2
}
} else {
x <- log(x,base=par8)
}
if (par3 > 0) x <- diff(x,lag=1,difference=par3)
if (par4 > 0) x <- diff(x,lag=par5,difference=par4)
bitmap(file='picts.png')
op <- par(mfrow=c(2,1))
plot(ox,type='l',main='Original Time Series',xlab='time',ylab='value')
if (par8=='') {
mytitle <- paste('Working Time Series (lambda=',par2,', d=',par3,', D=',par4,')',sep='')
mysub <- paste('(lambda=',par2,', d=',par3,', D=',par4,', CI=', par7, ', CI type=',par6,')',sep='')
} else {
mytitle <- paste('Working Time Series (base=',par8,', d=',par3,', D=',par4,')',sep='')
mysub <- paste('(base=',par8,', d=',par3,', D=',par4,', CI=', par7, ', CI type=',par6,')',sep='')
}
plot(x,type='l', main=mytitle,xlab='time',ylab='value')
par(op)
dev.off()
bitmap(file='pic1.png')
racf <- acf(x, par1, main='Autocorrelation', xlab='time lag', ylab='ACF', ci.type=par6, ci=par7, sub=mysub)
dev.off()
bitmap(file='pic2.png')
rpacf <- pacf(x,par1,main='Partial Autocorrelation',xlab='lags',ylab='PACF',sub=mysub)
dev.off()
(myacf <- c(racf$acf))
(mypacf <- c(rpacf$acf))
lengthx <- length(x)
sqrtn <- sqrt(lengthx)
load(file='createtable')
a<-table.start()
a<-table.row.start(a)
a<-table.element(a,'Autocorrelation Function',4,TRUE)
a<-table.row.end(a)
a<-table.row.start(a)
a<-table.element(a,'Time lag k',header=TRUE)
a<-table.element(a,hyperlink('basics.htm','ACF(k)','click here for more information about the Autocorrelation Function'),header=TRUE)
a<-table.element(a,'T-STAT',header=TRUE)
a<-table.element(a,'P-value',header=TRUE)
a<-table.row.end(a)
for (i in 2:(par1+1)) {
a<-table.row.start(a)
a<-table.element(a,i-1,header=TRUE)
a<-table.element(a,round(myacf[i],6))
mytstat <- myacf[i]*sqrtn
a<-table.element(a,round(mytstat,4))
a<-table.element(a,round(1-pt(abs(mytstat),lengthx),6))
a<-table.row.end(a)
}
a<-table.end(a)
table.save(a,file='mytable.tab')
a<-table.start()
a<-table.row.start(a)
a<-table.element(a,'Partial Autocorrelation Function',4,TRUE)
a<-table.row.end(a)
a<-table.row.start(a)
a<-table.element(a,'Time lag k',header=TRUE)
a<-table.element(a,hyperlink('basics.htm','PACF(k)','click here for more information about the Partial Autocorrelation Function'),header=TRUE)
a<-table.element(a,'T-STAT',header=TRUE)
a<-table.element(a,'P-value',header=TRUE)
a<-table.row.end(a)
for (i in 1:par1) {
a<-table.row.start(a)
a<-table.element(a,i,header=TRUE)
a<-table.element(a,round(mypacf[i],6))
mytstat <- mypacf[i]*sqrtn
a<-table.element(a,round(mytstat,4))
a<-table.element(a,round(1-pt(abs(mytstat),lengthx),6))
a<-table.row.end(a)
}
a<-table.end(a)
table.save(a,file='mytable1.tab')