Free Statistics

of Irreproducible Research!

Author's title

Author*Unverified author*
R Software Modulerwasp_autocorrelation.wasp
Title produced by software(Partial) Autocorrelation Function
Date of computationSun, 30 Dec 2012 12:04:14 -0500
Cite this page as followsStatistical Computations at FreeStatistics.org, Office for Research Development and Education, URL https://freestatistics.org/blog/index.php?v=date/2012/Dec/30/t1356888739a2a85tv0jn3st7t.htm/, Retrieved Thu, 25 Apr 2024 17:53:24 +0000
Statistical Computations at FreeStatistics.org, Office for Research Development and Education, URL https://freestatistics.org/blog/index.php?pk=204956, Retrieved Thu, 25 Apr 2024 17:53:24 +0000
QR Codes:

Original text written by user:
IsPrivate?No (this computation is public)
User-defined keywords
Estimated Impact141
Family? (F = Feedback message, R = changed R code, M = changed R Module, P = changed Parameters, D = changed Data)
-       [(Partial) Autocorrelation Function] [Gemiddelde prijs ...] [2012-12-30 17:04:14] [5ebf8d45d440e2351c3182f635b9c69f] [Current]
Feedback Forum

Post a new message
Dataseries X:
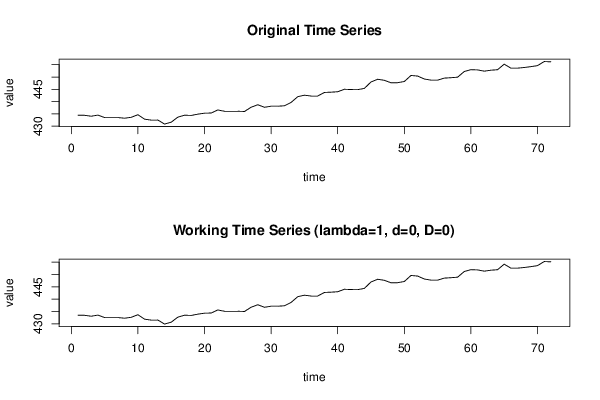
434,49
434,43
434,07
434,52
433,52
433,52
433,52
433,26
433,63
434,67
432,87
432,49
432,5
430,88
431,64
433,7
434,47
434,38
434,9
435,3
435,37
436,61
436,08
436,08
436,08
435,99
437,72
438,73
437,7
438,13
438,13
438,31
439,67
442
442,61
442,27
442,27
443,72
443,83
444,01
445,01
444,9
444,86
445,36
447,99
449,08
448,66
447,65
447,69
448,17
450,62
450,38
449,18
448,73
448,73
449,55
449,71
449,93
452,23
452,98
452,88
452,37
452,76
452,96
455,21
453,6
453,6
453,86
454,21
454,62
456,28
456,17


Summary of computational transaction
Raw Inputview raw input (R code)
Raw Outputview raw output of R engine
Computing time3 seconds
R Server'Sir Ronald Aylmer Fisher' @ fisher.wessa.net
R Framework error message
Warning: there are blank lines in the 'Data' field.
Please, use NA for missing data - blank lines are simply
 deleted and are NOT treated as missing values.

\begin{tabular}{lllllllll}
\hline
Summary of computational transaction \tabularnewline
Raw Input & view raw input (R code)  \tabularnewline
Raw Output & view raw output of R engine  \tabularnewline
Computing time & 3 seconds \tabularnewline
R Server & 'Sir Ronald Aylmer Fisher' @ fisher.wessa.net \tabularnewline
R Framework error message & 
Warning: there are blank lines in the 'Data' field.
Please, use NA for missing data - blank lines are simply
 deleted and are NOT treated as missing values.
\tabularnewline \hline \end{tabular} %Source: https://freestatistics.org/blog/index.php?pk=204956&T=0

[TABLE]
[ROW][C]Summary of computational transaction[/C][/ROW]
[ROW][C]Raw Input[/C][C]view raw input (R code) [/C][/ROW]
[ROW][C]Raw Output[/C][C]view raw output of R engine [/C][/ROW]
[ROW][C]Computing time[/C][C]3 seconds[/C][/ROW]
[ROW][C]R Server[/C][C]'Sir Ronald Aylmer Fisher' @ fisher.wessa.net[/C][/ROW]
[ROW][C]R Framework error message[/C][C]
Warning: there are blank lines in the 'Data' field.
Please, use NA for missing data - blank lines are simply
 deleted and are NOT treated as missing values.
[/C][/ROW] [/TABLE] Source: https://freestatistics.org/blog/index.php?pk=204956&T=0

Globally Unique Identifier (entire table): ba.freestatistics.org/blog/index.php?pk=204956&T=0

As an alternative you can also use a QR Code:  

The GUIDs for individual cells are displayed in the table below:

Summary of computational transaction
Raw Inputview raw input (R code)
Raw Outputview raw output of R engine
Computing time3 seconds
R Server'Sir Ronald Aylmer Fisher' @ fisher.wessa.net
R Framework error message
Warning: there are blank lines in the 'Data' field.
Please, use NA for missing data - blank lines are simply
 deleted and are NOT treated as missing values.


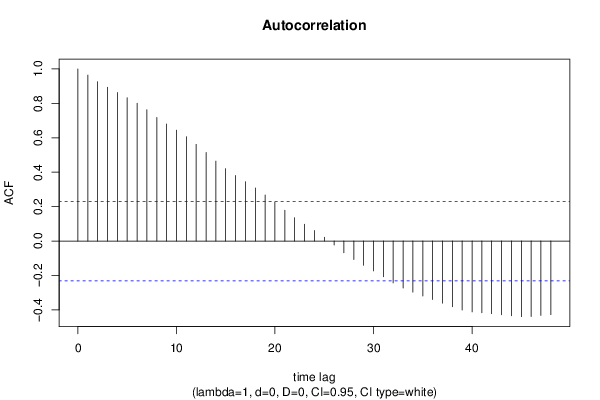
Autocorrelation Function
Time lag kACF(k)T-STATP-value
10.9642628.1820
20.9257527.85530
30.8934967.58160
40.8636297.32810
50.8324657.06370
60.800426.79180
70.7624876.46990
80.717926.09180
90.6800315.77030
100.6443445.46740
110.6056715.13931e-06
120.5619094.7685e-06
130.5144844.36552.1e-05
140.4646153.94249.3e-05
150.4207413.57010.00032
160.3812913.23540.000918
170.3444822.9230.002315
180.3080862.61420.005442
190.2675222.270.013101
200.2250721.90980.030071
210.1790951.51970.066486
220.135141.14670.127651
230.0980010.83160.204202
240.0614490.52140.301841
250.0220110.18680.426182
26-0.02315-0.19640.422411
27-0.068032-0.57730.28278
28-0.107363-0.9110.182666
29-0.140525-1.19240.118511
30-0.173584-1.47290.072566
31-0.207968-1.76470.04093
32-0.243048-2.06230.021393
33-0.272686-2.31380.011768
34-0.296932-2.51950.006985
35-0.319658-2.71240.004175
36-0.340153-2.88630.002571
37-0.361013-3.06330.001539
38-0.381605-3.2380.000911
39-0.400622-3.39940.000552
40-0.411768-3.4940.000409
41-0.416341-3.53280.000361
42-0.421979-3.58060.000309
43-0.428102-3.63260.000261
44-0.434329-3.68540.00022
45-0.439336-3.72790.000191
46-0.438151-3.71780.000197
47-0.431833-3.66420.000235
48-0.427743-3.62950.000264

\begin{tabular}{lllllllll}
\hline
Autocorrelation Function \tabularnewline
Time lag k & ACF(k) & T-STAT & P-value \tabularnewline
1 & 0.964262 & 8.182 & 0 \tabularnewline
2 & 0.925752 & 7.8553 & 0 \tabularnewline
3 & 0.893496 & 7.5816 & 0 \tabularnewline
4 & 0.863629 & 7.3281 & 0 \tabularnewline
5 & 0.832465 & 7.0637 & 0 \tabularnewline
6 & 0.80042 & 6.7918 & 0 \tabularnewline
7 & 0.762487 & 6.4699 & 0 \tabularnewline
8 & 0.71792 & 6.0918 & 0 \tabularnewline
9 & 0.680031 & 5.7703 & 0 \tabularnewline
10 & 0.644344 & 5.4674 & 0 \tabularnewline
11 & 0.605671 & 5.1393 & 1e-06 \tabularnewline
12 & 0.561909 & 4.768 & 5e-06 \tabularnewline
13 & 0.514484 & 4.3655 & 2.1e-05 \tabularnewline
14 & 0.464615 & 3.9424 & 9.3e-05 \tabularnewline
15 & 0.420741 & 3.5701 & 0.00032 \tabularnewline
16 & 0.381291 & 3.2354 & 0.000918 \tabularnewline
17 & 0.344482 & 2.923 & 0.002315 \tabularnewline
18 & 0.308086 & 2.6142 & 0.005442 \tabularnewline
19 & 0.267522 & 2.27 & 0.013101 \tabularnewline
20 & 0.225072 & 1.9098 & 0.030071 \tabularnewline
21 & 0.179095 & 1.5197 & 0.066486 \tabularnewline
22 & 0.13514 & 1.1467 & 0.127651 \tabularnewline
23 & 0.098001 & 0.8316 & 0.204202 \tabularnewline
24 & 0.061449 & 0.5214 & 0.301841 \tabularnewline
25 & 0.022011 & 0.1868 & 0.426182 \tabularnewline
26 & -0.02315 & -0.1964 & 0.422411 \tabularnewline
27 & -0.068032 & -0.5773 & 0.28278 \tabularnewline
28 & -0.107363 & -0.911 & 0.182666 \tabularnewline
29 & -0.140525 & -1.1924 & 0.118511 \tabularnewline
30 & -0.173584 & -1.4729 & 0.072566 \tabularnewline
31 & -0.207968 & -1.7647 & 0.04093 \tabularnewline
32 & -0.243048 & -2.0623 & 0.021393 \tabularnewline
33 & -0.272686 & -2.3138 & 0.011768 \tabularnewline
34 & -0.296932 & -2.5195 & 0.006985 \tabularnewline
35 & -0.319658 & -2.7124 & 0.004175 \tabularnewline
36 & -0.340153 & -2.8863 & 0.002571 \tabularnewline
37 & -0.361013 & -3.0633 & 0.001539 \tabularnewline
38 & -0.381605 & -3.238 & 0.000911 \tabularnewline
39 & -0.400622 & -3.3994 & 0.000552 \tabularnewline
40 & -0.411768 & -3.494 & 0.000409 \tabularnewline
41 & -0.416341 & -3.5328 & 0.000361 \tabularnewline
42 & -0.421979 & -3.5806 & 0.000309 \tabularnewline
43 & -0.428102 & -3.6326 & 0.000261 \tabularnewline
44 & -0.434329 & -3.6854 & 0.00022 \tabularnewline
45 & -0.439336 & -3.7279 & 0.000191 \tabularnewline
46 & -0.438151 & -3.7178 & 0.000197 \tabularnewline
47 & -0.431833 & -3.6642 & 0.000235 \tabularnewline
48 & -0.427743 & -3.6295 & 0.000264 \tabularnewline
\hline
\end{tabular}
%Source: https://freestatistics.org/blog/index.php?pk=204956&T=1

[TABLE]
[ROW][C]Autocorrelation Function[/C][/ROW]
[ROW][C]Time lag k[/C][C]ACF(k)[/C][C]T-STAT[/C][C]P-value[/C][/ROW]
[ROW][C]1[/C][C]0.964262[/C][C]8.182[/C][C]0[/C][/ROW]
[ROW][C]2[/C][C]0.925752[/C][C]7.8553[/C][C]0[/C][/ROW]
[ROW][C]3[/C][C]0.893496[/C][C]7.5816[/C][C]0[/C][/ROW]
[ROW][C]4[/C][C]0.863629[/C][C]7.3281[/C][C]0[/C][/ROW]
[ROW][C]5[/C][C]0.832465[/C][C]7.0637[/C][C]0[/C][/ROW]
[ROW][C]6[/C][C]0.80042[/C][C]6.7918[/C][C]0[/C][/ROW]
[ROW][C]7[/C][C]0.762487[/C][C]6.4699[/C][C]0[/C][/ROW]
[ROW][C]8[/C][C]0.71792[/C][C]6.0918[/C][C]0[/C][/ROW]
[ROW][C]9[/C][C]0.680031[/C][C]5.7703[/C][C]0[/C][/ROW]
[ROW][C]10[/C][C]0.644344[/C][C]5.4674[/C][C]0[/C][/ROW]
[ROW][C]11[/C][C]0.605671[/C][C]5.1393[/C][C]1e-06[/C][/ROW]
[ROW][C]12[/C][C]0.561909[/C][C]4.768[/C][C]5e-06[/C][/ROW]
[ROW][C]13[/C][C]0.514484[/C][C]4.3655[/C][C]2.1e-05[/C][/ROW]
[ROW][C]14[/C][C]0.464615[/C][C]3.9424[/C][C]9.3e-05[/C][/ROW]
[ROW][C]15[/C][C]0.420741[/C][C]3.5701[/C][C]0.00032[/C][/ROW]
[ROW][C]16[/C][C]0.381291[/C][C]3.2354[/C][C]0.000918[/C][/ROW]
[ROW][C]17[/C][C]0.344482[/C][C]2.923[/C][C]0.002315[/C][/ROW]
[ROW][C]18[/C][C]0.308086[/C][C]2.6142[/C][C]0.005442[/C][/ROW]
[ROW][C]19[/C][C]0.267522[/C][C]2.27[/C][C]0.013101[/C][/ROW]
[ROW][C]20[/C][C]0.225072[/C][C]1.9098[/C][C]0.030071[/C][/ROW]
[ROW][C]21[/C][C]0.179095[/C][C]1.5197[/C][C]0.066486[/C][/ROW]
[ROW][C]22[/C][C]0.13514[/C][C]1.1467[/C][C]0.127651[/C][/ROW]
[ROW][C]23[/C][C]0.098001[/C][C]0.8316[/C][C]0.204202[/C][/ROW]
[ROW][C]24[/C][C]0.061449[/C][C]0.5214[/C][C]0.301841[/C][/ROW]
[ROW][C]25[/C][C]0.022011[/C][C]0.1868[/C][C]0.426182[/C][/ROW]
[ROW][C]26[/C][C]-0.02315[/C][C]-0.1964[/C][C]0.422411[/C][/ROW]
[ROW][C]27[/C][C]-0.068032[/C][C]-0.5773[/C][C]0.28278[/C][/ROW]
[ROW][C]28[/C][C]-0.107363[/C][C]-0.911[/C][C]0.182666[/C][/ROW]
[ROW][C]29[/C][C]-0.140525[/C][C]-1.1924[/C][C]0.118511[/C][/ROW]
[ROW][C]30[/C][C]-0.173584[/C][C]-1.4729[/C][C]0.072566[/C][/ROW]
[ROW][C]31[/C][C]-0.207968[/C][C]-1.7647[/C][C]0.04093[/C][/ROW]
[ROW][C]32[/C][C]-0.243048[/C][C]-2.0623[/C][C]0.021393[/C][/ROW]
[ROW][C]33[/C][C]-0.272686[/C][C]-2.3138[/C][C]0.011768[/C][/ROW]
[ROW][C]34[/C][C]-0.296932[/C][C]-2.5195[/C][C]0.006985[/C][/ROW]
[ROW][C]35[/C][C]-0.319658[/C][C]-2.7124[/C][C]0.004175[/C][/ROW]
[ROW][C]36[/C][C]-0.340153[/C][C]-2.8863[/C][C]0.002571[/C][/ROW]
[ROW][C]37[/C][C]-0.361013[/C][C]-3.0633[/C][C]0.001539[/C][/ROW]
[ROW][C]38[/C][C]-0.381605[/C][C]-3.238[/C][C]0.000911[/C][/ROW]
[ROW][C]39[/C][C]-0.400622[/C][C]-3.3994[/C][C]0.000552[/C][/ROW]
[ROW][C]40[/C][C]-0.411768[/C][C]-3.494[/C][C]0.000409[/C][/ROW]
[ROW][C]41[/C][C]-0.416341[/C][C]-3.5328[/C][C]0.000361[/C][/ROW]
[ROW][C]42[/C][C]-0.421979[/C][C]-3.5806[/C][C]0.000309[/C][/ROW]
[ROW][C]43[/C][C]-0.428102[/C][C]-3.6326[/C][C]0.000261[/C][/ROW]
[ROW][C]44[/C][C]-0.434329[/C][C]-3.6854[/C][C]0.00022[/C][/ROW]
[ROW][C]45[/C][C]-0.439336[/C][C]-3.7279[/C][C]0.000191[/C][/ROW]
[ROW][C]46[/C][C]-0.438151[/C][C]-3.7178[/C][C]0.000197[/C][/ROW]
[ROW][C]47[/C][C]-0.431833[/C][C]-3.6642[/C][C]0.000235[/C][/ROW]
[ROW][C]48[/C][C]-0.427743[/C][C]-3.6295[/C][C]0.000264[/C][/ROW]
[/TABLE]
Source: https://freestatistics.org/blog/index.php?pk=204956&T=1

Globally Unique Identifier (entire table): ba.freestatistics.org/blog/index.php?pk=204956&T=1

As an alternative you can also use a QR Code:  

The GUIDs for individual cells are displayed in the table below:

Autocorrelation Function
Time lag kACF(k)T-STATP-value
10.9642628.1820
20.9257527.85530
30.8934967.58160
40.8636297.32810
50.8324657.06370
60.800426.79180
70.7624876.46990
80.717926.09180
90.6800315.77030
100.6443445.46740
110.6056715.13931e-06
120.5619094.7685e-06
130.5144844.36552.1e-05
140.4646153.94249.3e-05
150.4207413.57010.00032
160.3812913.23540.000918
170.3444822.9230.002315
180.3080862.61420.005442
190.2675222.270.013101
200.2250721.90980.030071
210.1790951.51970.066486
220.135141.14670.127651
230.0980010.83160.204202
240.0614490.52140.301841
250.0220110.18680.426182
26-0.02315-0.19640.422411
27-0.068032-0.57730.28278
28-0.107363-0.9110.182666
29-0.140525-1.19240.118511
30-0.173584-1.47290.072566
31-0.207968-1.76470.04093
32-0.243048-2.06230.021393
33-0.272686-2.31380.011768
34-0.296932-2.51950.006985
35-0.319658-2.71240.004175
36-0.340153-2.88630.002571
37-0.361013-3.06330.001539
38-0.381605-3.2380.000911
39-0.400622-3.39940.000552
40-0.411768-3.4940.000409
41-0.416341-3.53280.000361
42-0.421979-3.58060.000309
43-0.428102-3.63260.000261
44-0.434329-3.68540.00022
45-0.439336-3.72790.000191
46-0.438151-3.71780.000197
47-0.431833-3.66420.000235
48-0.427743-3.62950.000264


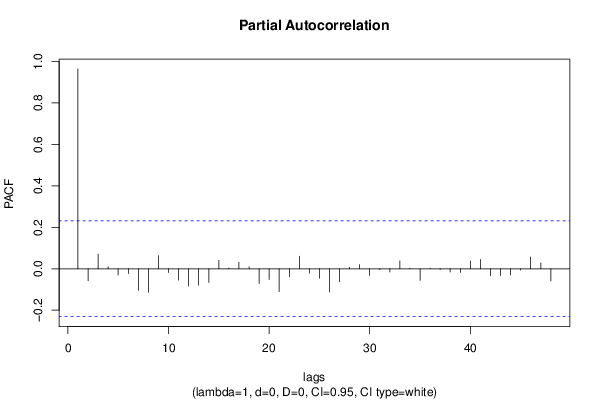
Partial Autocorrelation Function
Time lag kPACF(k)T-STATP-value
10.9642628.1820
2-0.057665-0.48930.313056
30.0708550.60120.27479
40.0099170.08420.466585
5-0.029603-0.25120.401191
6-0.02314-0.19630.422445
7-0.103489-0.87810.191396
8-0.113574-0.96370.169209
90.0635470.53920.295702
10-0.018357-0.15580.438328
11-0.054604-0.46330.322261
12-0.083045-0.70470.241649
13-0.078994-0.67030.252411
14-0.065708-0.55760.28944
150.040530.34390.365958
160.003370.02860.488635
170.0309490.26260.396802
180.0093210.07910.468591
19-0.071221-0.60430.273763
20-0.051849-0.440.330644
21-0.110083-0.93410.17669
22-0.03847-0.32640.372525
230.0605250.51360.304562
24-0.020938-0.17770.429743
25-0.045859-0.38910.349167
26-0.11229-0.95280.171936
27-0.062846-0.53330.297746
280.007830.06640.473606
290.0201370.17090.432403
30-0.032555-0.27620.391579
31-0.004011-0.0340.486472
32-0.015761-0.13370.446992
330.0381180.32340.37365
340.0008960.00760.496978
35-0.055879-0.47420.318413
360.0023110.01960.492205
37-0.003468-0.02940.488301
38-0.015455-0.13110.448016
39-0.018124-0.15380.439104
400.0375060.31830.375608
410.0447670.37990.352584
42-0.03345-0.28380.388677
43-0.032543-0.27610.391618
44-0.030066-0.25510.39968
45-0.006083-0.05160.47949
460.0571390.48480.31463
470.0279720.23730.40653
48-0.058457-0.4960.310693

\begin{tabular}{lllllllll}
\hline
Partial Autocorrelation Function \tabularnewline
Time lag k & PACF(k) & T-STAT & P-value \tabularnewline
1 & 0.964262 & 8.182 & 0 \tabularnewline
2 & -0.057665 & -0.4893 & 0.313056 \tabularnewline
3 & 0.070855 & 0.6012 & 0.27479 \tabularnewline
4 & 0.009917 & 0.0842 & 0.466585 \tabularnewline
5 & -0.029603 & -0.2512 & 0.401191 \tabularnewline
6 & -0.02314 & -0.1963 & 0.422445 \tabularnewline
7 & -0.103489 & -0.8781 & 0.191396 \tabularnewline
8 & -0.113574 & -0.9637 & 0.169209 \tabularnewline
9 & 0.063547 & 0.5392 & 0.295702 \tabularnewline
10 & -0.018357 & -0.1558 & 0.438328 \tabularnewline
11 & -0.054604 & -0.4633 & 0.322261 \tabularnewline
12 & -0.083045 & -0.7047 & 0.241649 \tabularnewline
13 & -0.078994 & -0.6703 & 0.252411 \tabularnewline
14 & -0.065708 & -0.5576 & 0.28944 \tabularnewline
15 & 0.04053 & 0.3439 & 0.365958 \tabularnewline
16 & 0.00337 & 0.0286 & 0.488635 \tabularnewline
17 & 0.030949 & 0.2626 & 0.396802 \tabularnewline
18 & 0.009321 & 0.0791 & 0.468591 \tabularnewline
19 & -0.071221 & -0.6043 & 0.273763 \tabularnewline
20 & -0.051849 & -0.44 & 0.330644 \tabularnewline
21 & -0.110083 & -0.9341 & 0.17669 \tabularnewline
22 & -0.03847 & -0.3264 & 0.372525 \tabularnewline
23 & 0.060525 & 0.5136 & 0.304562 \tabularnewline
24 & -0.020938 & -0.1777 & 0.429743 \tabularnewline
25 & -0.045859 & -0.3891 & 0.349167 \tabularnewline
26 & -0.11229 & -0.9528 & 0.171936 \tabularnewline
27 & -0.062846 & -0.5333 & 0.297746 \tabularnewline
28 & 0.00783 & 0.0664 & 0.473606 \tabularnewline
29 & 0.020137 & 0.1709 & 0.432403 \tabularnewline
30 & -0.032555 & -0.2762 & 0.391579 \tabularnewline
31 & -0.004011 & -0.034 & 0.486472 \tabularnewline
32 & -0.015761 & -0.1337 & 0.446992 \tabularnewline
33 & 0.038118 & 0.3234 & 0.37365 \tabularnewline
34 & 0.000896 & 0.0076 & 0.496978 \tabularnewline
35 & -0.055879 & -0.4742 & 0.318413 \tabularnewline
36 & 0.002311 & 0.0196 & 0.492205 \tabularnewline
37 & -0.003468 & -0.0294 & 0.488301 \tabularnewline
38 & -0.015455 & -0.1311 & 0.448016 \tabularnewline
39 & -0.018124 & -0.1538 & 0.439104 \tabularnewline
40 & 0.037506 & 0.3183 & 0.375608 \tabularnewline
41 & 0.044767 & 0.3799 & 0.352584 \tabularnewline
42 & -0.03345 & -0.2838 & 0.388677 \tabularnewline
43 & -0.032543 & -0.2761 & 0.391618 \tabularnewline
44 & -0.030066 & -0.2551 & 0.39968 \tabularnewline
45 & -0.006083 & -0.0516 & 0.47949 \tabularnewline
46 & 0.057139 & 0.4848 & 0.31463 \tabularnewline
47 & 0.027972 & 0.2373 & 0.40653 \tabularnewline
48 & -0.058457 & -0.496 & 0.310693 \tabularnewline
\hline
\end{tabular}
%Source: https://freestatistics.org/blog/index.php?pk=204956&T=2

[TABLE]
[ROW][C]Partial Autocorrelation Function[/C][/ROW]
[ROW][C]Time lag k[/C][C]PACF(k)[/C][C]T-STAT[/C][C]P-value[/C][/ROW]
[ROW][C]1[/C][C]0.964262[/C][C]8.182[/C][C]0[/C][/ROW]
[ROW][C]2[/C][C]-0.057665[/C][C]-0.4893[/C][C]0.313056[/C][/ROW]
[ROW][C]3[/C][C]0.070855[/C][C]0.6012[/C][C]0.27479[/C][/ROW]
[ROW][C]4[/C][C]0.009917[/C][C]0.0842[/C][C]0.466585[/C][/ROW]
[ROW][C]5[/C][C]-0.029603[/C][C]-0.2512[/C][C]0.401191[/C][/ROW]
[ROW][C]6[/C][C]-0.02314[/C][C]-0.1963[/C][C]0.422445[/C][/ROW]
[ROW][C]7[/C][C]-0.103489[/C][C]-0.8781[/C][C]0.191396[/C][/ROW]
[ROW][C]8[/C][C]-0.113574[/C][C]-0.9637[/C][C]0.169209[/C][/ROW]
[ROW][C]9[/C][C]0.063547[/C][C]0.5392[/C][C]0.295702[/C][/ROW]
[ROW][C]10[/C][C]-0.018357[/C][C]-0.1558[/C][C]0.438328[/C][/ROW]
[ROW][C]11[/C][C]-0.054604[/C][C]-0.4633[/C][C]0.322261[/C][/ROW]
[ROW][C]12[/C][C]-0.083045[/C][C]-0.7047[/C][C]0.241649[/C][/ROW]
[ROW][C]13[/C][C]-0.078994[/C][C]-0.6703[/C][C]0.252411[/C][/ROW]
[ROW][C]14[/C][C]-0.065708[/C][C]-0.5576[/C][C]0.28944[/C][/ROW]
[ROW][C]15[/C][C]0.04053[/C][C]0.3439[/C][C]0.365958[/C][/ROW]
[ROW][C]16[/C][C]0.00337[/C][C]0.0286[/C][C]0.488635[/C][/ROW]
[ROW][C]17[/C][C]0.030949[/C][C]0.2626[/C][C]0.396802[/C][/ROW]
[ROW][C]18[/C][C]0.009321[/C][C]0.0791[/C][C]0.468591[/C][/ROW]
[ROW][C]19[/C][C]-0.071221[/C][C]-0.6043[/C][C]0.273763[/C][/ROW]
[ROW][C]20[/C][C]-0.051849[/C][C]-0.44[/C][C]0.330644[/C][/ROW]
[ROW][C]21[/C][C]-0.110083[/C][C]-0.9341[/C][C]0.17669[/C][/ROW]
[ROW][C]22[/C][C]-0.03847[/C][C]-0.3264[/C][C]0.372525[/C][/ROW]
[ROW][C]23[/C][C]0.060525[/C][C]0.5136[/C][C]0.304562[/C][/ROW]
[ROW][C]24[/C][C]-0.020938[/C][C]-0.1777[/C][C]0.429743[/C][/ROW]
[ROW][C]25[/C][C]-0.045859[/C][C]-0.3891[/C][C]0.349167[/C][/ROW]
[ROW][C]26[/C][C]-0.11229[/C][C]-0.9528[/C][C]0.171936[/C][/ROW]
[ROW][C]27[/C][C]-0.062846[/C][C]-0.5333[/C][C]0.297746[/C][/ROW]
[ROW][C]28[/C][C]0.00783[/C][C]0.0664[/C][C]0.473606[/C][/ROW]
[ROW][C]29[/C][C]0.020137[/C][C]0.1709[/C][C]0.432403[/C][/ROW]
[ROW][C]30[/C][C]-0.032555[/C][C]-0.2762[/C][C]0.391579[/C][/ROW]
[ROW][C]31[/C][C]-0.004011[/C][C]-0.034[/C][C]0.486472[/C][/ROW]
[ROW][C]32[/C][C]-0.015761[/C][C]-0.1337[/C][C]0.446992[/C][/ROW]
[ROW][C]33[/C][C]0.038118[/C][C]0.3234[/C][C]0.37365[/C][/ROW]
[ROW][C]34[/C][C]0.000896[/C][C]0.0076[/C][C]0.496978[/C][/ROW]
[ROW][C]35[/C][C]-0.055879[/C][C]-0.4742[/C][C]0.318413[/C][/ROW]
[ROW][C]36[/C][C]0.002311[/C][C]0.0196[/C][C]0.492205[/C][/ROW]
[ROW][C]37[/C][C]-0.003468[/C][C]-0.0294[/C][C]0.488301[/C][/ROW]
[ROW][C]38[/C][C]-0.015455[/C][C]-0.1311[/C][C]0.448016[/C][/ROW]
[ROW][C]39[/C][C]-0.018124[/C][C]-0.1538[/C][C]0.439104[/C][/ROW]
[ROW][C]40[/C][C]0.037506[/C][C]0.3183[/C][C]0.375608[/C][/ROW]
[ROW][C]41[/C][C]0.044767[/C][C]0.3799[/C][C]0.352584[/C][/ROW]
[ROW][C]42[/C][C]-0.03345[/C][C]-0.2838[/C][C]0.388677[/C][/ROW]
[ROW][C]43[/C][C]-0.032543[/C][C]-0.2761[/C][C]0.391618[/C][/ROW]
[ROW][C]44[/C][C]-0.030066[/C][C]-0.2551[/C][C]0.39968[/C][/ROW]
[ROW][C]45[/C][C]-0.006083[/C][C]-0.0516[/C][C]0.47949[/C][/ROW]
[ROW][C]46[/C][C]0.057139[/C][C]0.4848[/C][C]0.31463[/C][/ROW]
[ROW][C]47[/C][C]0.027972[/C][C]0.2373[/C][C]0.40653[/C][/ROW]
[ROW][C]48[/C][C]-0.058457[/C][C]-0.496[/C][C]0.310693[/C][/ROW]
[/TABLE]
Source: https://freestatistics.org/blog/index.php?pk=204956&T=2

Globally Unique Identifier (entire table): ba.freestatistics.org/blog/index.php?pk=204956&T=2

As an alternative you can also use a QR Code:  

The GUIDs for individual cells are displayed in the table below:

Partial Autocorrelation Function
Time lag kPACF(k)T-STATP-value
10.9642628.1820
2-0.057665-0.48930.313056
30.0708550.60120.27479
40.0099170.08420.466585
5-0.029603-0.25120.401191
6-0.02314-0.19630.422445
7-0.103489-0.87810.191396
8-0.113574-0.96370.169209
90.0635470.53920.295702
10-0.018357-0.15580.438328
11-0.054604-0.46330.322261
12-0.083045-0.70470.241649
13-0.078994-0.67030.252411
14-0.065708-0.55760.28944
150.040530.34390.365958
160.003370.02860.488635
170.0309490.26260.396802
180.0093210.07910.468591
19-0.071221-0.60430.273763
20-0.051849-0.440.330644
21-0.110083-0.93410.17669
22-0.03847-0.32640.372525
230.0605250.51360.304562
24-0.020938-0.17770.429743
25-0.045859-0.38910.349167
26-0.11229-0.95280.171936
27-0.062846-0.53330.297746
280.007830.06640.473606
290.0201370.17090.432403
30-0.032555-0.27620.391579
31-0.004011-0.0340.486472
32-0.015761-0.13370.446992
330.0381180.32340.37365
340.0008960.00760.496978
35-0.055879-0.47420.318413
360.0023110.01960.492205
37-0.003468-0.02940.488301
38-0.015455-0.13110.448016
39-0.018124-0.15380.439104
400.0375060.31830.375608
410.0447670.37990.352584
42-0.03345-0.28380.388677
43-0.032543-0.27610.391618
44-0.030066-0.25510.39968
45-0.006083-0.05160.47949
460.0571390.48480.31463
470.0279720.23730.40653
48-0.058457-0.4960.310693


Parameters (Session):
par1 = 48 ; par2 = 1 ; par3 = 0 ; par4 = 0 ; par5 = 12 ; par6 = White Noise ; par7 = 0.95 ;
Parameters (R input):
par1 = 48 ; par2 = 1 ; par3 = 0 ; par4 = 0 ; par5 = 12 ; par6 = White Noise ; par7 = 0.95 ; par8 = ;
R code (references can be found in the software module):
if (par1 == 'Default') {
par1 = 10*log10(length(x))
} else {
par1 <- as.numeric(par1)
}
par2 <- as.numeric(par2)
par3 <- as.numeric(par3)
par4 <- as.numeric(par4)
par5 <- as.numeric(par5)
if (par6 == 'White Noise') par6 <- 'white' else par6 <- 'ma'
par7 <- as.numeric(par7)
if (par8 != '') par8 <- as.numeric(par8)
ox <- x
if (par8 == '') {
if (par2 == 0) {
x <- log(x)
} else {
x <- (x ^ par2 - 1) / par2
}
} else {
x <- log(x,base=par8)
}
if (par3 > 0) x <- diff(x,lag=1,difference=par3)
if (par4 > 0) x <- diff(x,lag=par5,difference=par4)
bitmap(file='picts.png')
op <- par(mfrow=c(2,1))
plot(ox,type='l',main='Original Time Series',xlab='time',ylab='value')
if (par8=='') {
mytitle <- paste('Working Time Series (lambda=',par2,', d=',par3,', D=',par4,')',sep='')
mysub <- paste('(lambda=',par2,', d=',par3,', D=',par4,', CI=', par7, ', CI type=',par6,')',sep='')
} else {
mytitle <- paste('Working Time Series (base=',par8,', d=',par3,', D=',par4,')',sep='')
mysub <- paste('(base=',par8,', d=',par3,', D=',par4,', CI=', par7, ', CI type=',par6,')',sep='')
}
plot(x,type='l', main=mytitle,xlab='time',ylab='value')
par(op)
dev.off()
bitmap(file='pic1.png')
racf <- acf(x, par1, main='Autocorrelation', xlab='time lag', ylab='ACF', ci.type=par6, ci=par7, sub=mysub)
dev.off()
bitmap(file='pic2.png')
rpacf <- pacf(x,par1,main='Partial Autocorrelation',xlab='lags',ylab='PACF',sub=mysub)
dev.off()
(myacf <- c(racf$acf))
(mypacf <- c(rpacf$acf))
lengthx <- length(x)
sqrtn <- sqrt(lengthx)
load(file='createtable')
a<-table.start()
a<-table.row.start(a)
a<-table.element(a,'Autocorrelation Function',4,TRUE)
a<-table.row.end(a)
a<-table.row.start(a)
a<-table.element(a,'Time lag k',header=TRUE)
a<-table.element(a,hyperlink('basics.htm','ACF(k)','click here for more information about the Autocorrelation Function'),header=TRUE)
a<-table.element(a,'T-STAT',header=TRUE)
a<-table.element(a,'P-value',header=TRUE)
a<-table.row.end(a)
for (i in 2:(par1+1)) {
a<-table.row.start(a)
a<-table.element(a,i-1,header=TRUE)
a<-table.element(a,round(myacf[i],6))
mytstat <- myacf[i]*sqrtn
a<-table.element(a,round(mytstat,4))
a<-table.element(a,round(1-pt(abs(mytstat),lengthx),6))
a<-table.row.end(a)
}
a<-table.end(a)
table.save(a,file='mytable.tab')
a<-table.start()
a<-table.row.start(a)
a<-table.element(a,'Partial Autocorrelation Function',4,TRUE)
a<-table.row.end(a)
a<-table.row.start(a)
a<-table.element(a,'Time lag k',header=TRUE)
a<-table.element(a,hyperlink('basics.htm','PACF(k)','click here for more information about the Partial Autocorrelation Function'),header=TRUE)
a<-table.element(a,'T-STAT',header=TRUE)
a<-table.element(a,'P-value',header=TRUE)
a<-table.row.end(a)
for (i in 1:par1) {
a<-table.row.start(a)
a<-table.element(a,i,header=TRUE)
a<-table.element(a,round(mypacf[i],6))
mytstat <- mypacf[i]*sqrtn
a<-table.element(a,round(mytstat,4))
a<-table.element(a,round(1-pt(abs(mytstat),lengthx),6))
a<-table.row.end(a)
}
a<-table.end(a)
table.save(a,file='mytable1.tab')