Free Statistics

of Irreproducible Research!

Author's title

Author*Unverified author*
R Software Modulerwasp_centraltendency.wasp
Title produced by softwareCentral Tendency
Date of computationSun, 30 Dec 2012 06:25:30 -0500
Cite this page as followsStatistical Computations at FreeStatistics.org, Office for Research Development and Education, URL https://freestatistics.org/blog/index.php?v=date/2012/Dec/30/t1356867697ndf7zhfbj1mhjk5.htm/, Retrieved Fri, 19 Apr 2024 19:18:50 +0000
Statistical Computations at FreeStatistics.org, Office for Research Development and Education, URL https://freestatistics.org/blog/index.php?pk=204938, Retrieved Fri, 19 Apr 2024 19:18:50 +0000
QR Codes:

Original text written by user:
IsPrivate?No (this computation is public)
User-defined keywords
Estimated Impact176
Family? (F = Feedback message, R = changed R code, M = changed R Module, P = changed Parameters, D = changed Data)
-       [Central Tendency] [Gemiddelde prijs ...] [2012-12-30 11:25:30] [5ebf8d45d440e2351c3182f635b9c69f] [Current]
Feedback Forum

Post a new message
Dataseries X:
434,49
434,43
434,07
434,52
433,52
433,52
433,52
433,26
433,63
434,67
432,87
432,49
432,5
430,88
431,64
433,7
434,47
434,38
434,9
435,3
435,37
436,61
436,08
436,08
436,08
435,99
437,72
438,73
437,7
438,13
438,13
438,31
439,67
442
442,61
442,27
442,27
443,72
443,83
444,01
445,01
444,9
444,86
445,36
447,99
449,08
448,66
447,65
447,69
448,17
450,62
450,38
449,18
448,73
448,73
449,55
449,71
449,93
452,23
452,98
452,88
452,37
452,76
452,96
455,21
453,6
453,6
453,86
454,21
454,62
456,28
456,17


Summary of computational transaction
Raw Inputview raw input (R code)
Raw Outputview raw output of R engine
Computing time2 seconds
R Server'Gertrude Mary Cox' @ cox.wessa.net

\begin{tabular}{lllllllll}
\hline
Summary of computational transaction \tabularnewline
Raw Input & view raw input (R code)  \tabularnewline
Raw Output & view raw output of R engine  \tabularnewline
Computing time & 2 seconds \tabularnewline
R Server & 'Gertrude Mary Cox' @ cox.wessa.net \tabularnewline
\hline
\end{tabular}
%Source: https://freestatistics.org/blog/index.php?pk=204938&T=0

[TABLE]
[ROW][C]Summary of computational transaction[/C][/ROW]
[ROW][C]Raw Input[/C][C]view raw input (R code) [/C][/ROW]
[ROW][C]Raw Output[/C][C]view raw output of R engine [/C][/ROW]
[ROW][C]Computing time[/C][C]2 seconds[/C][/ROW]
[ROW][C]R Server[/C][C]'Gertrude Mary Cox' @ cox.wessa.net[/C][/ROW]
[/TABLE]
Source: https://freestatistics.org/blog/index.php?pk=204938&T=0

Globally Unique Identifier (entire table): ba.freestatistics.org/blog/index.php?pk=204938&T=0

As an alternative you can also use a QR Code:  

The GUIDs for individual cells are displayed in the table below:

Summary of computational transaction
Raw Inputview raw input (R code)
Raw Outputview raw output of R engine
Computing time2 seconds
R Server'Gertrude Mary Cox' @ cox.wessa.net


Central Tendency - Ungrouped Data
MeasureValueS.E.Value/S.E.
Arithmetic Mean442.750.930234165414232475.95542763455
Geometric Mean442.680730118174
Harmonic Mean442.611583969114
Quadratic Mean442.81937776906
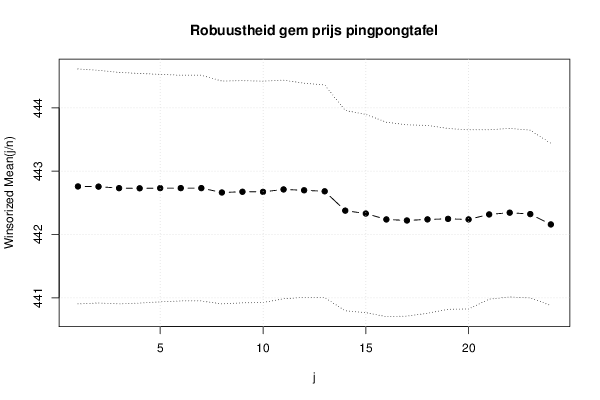
Winsorized Mean ( 1 / 24 )442.7590277777780.928083031126628477.068336483105
Winsorized Mean ( 2 / 24 )442.7559722222220.918973317631194481.794154114832
Winsorized Mean ( 3 / 24 )442.7318055555560.914310294595849484.224894078498
Winsorized Mean ( 4 / 24 )442.7295833333330.907000323460059488.12505561673
Winsorized Mean ( 5 / 24 )442.7323611111110.898629988669319492.674812429423
Winsorized Mean ( 6 / 24 )442.7323611111110.891696008754541496.50593561531
Winsorized Mean ( 7 / 24 )442.7323611111110.891696008754541496.50593561531
Winsorized Mean ( 8 / 24 )442.6634722222220.880095162190899502.972282133969
Winsorized Mean ( 9 / 24 )442.6747222222220.877678595627745504.369964617408
Winsorized Mean ( 10 / 24 )442.6733333333330.874440151771254506.236284366243
Winsorized Mean ( 11 / 24 )442.7115277777780.863360311443417512.777251756716
Winsorized Mean ( 12 / 24 )442.6981944444440.845574165905342523.547445386361
Winsorized Mean ( 13 / 24 )442.6819444444440.840265431433243526.835840062301
Winsorized Mean ( 14 / 24 )442.3766666666670.791093862457248559.196180959593
Winsorized Mean ( 15 / 24 )442.3308333333330.783218844645096564.760202537988
Winsorized Mean ( 16 / 24 )442.23750.767984062813497575.842027736709
Winsorized Mean ( 17 / 24 )442.2209722222220.755695850909255585.183803364993
Winsorized Mean ( 18 / 24 )442.2384722222220.742077842970842595.946202155504
Winsorized Mean ( 19 / 24 )442.2463888888890.714039493652777619.358442803368
Winsorized Mean ( 20 / 24 )442.2380555555560.707587169513722624.994452428351
Winsorized Mean ( 21 / 24 )442.3168055555560.669339092735311660.826194609358
Winsorized Mean ( 22 / 24 )442.3443055555560.665686098888274664.493830191574
Winsorized Mean ( 23 / 24 )442.3219444444440.662669373007462667.485117709618
Winsorized Mean ( 24 / 24 )442.1586111111110.640875321602134689.929220563139
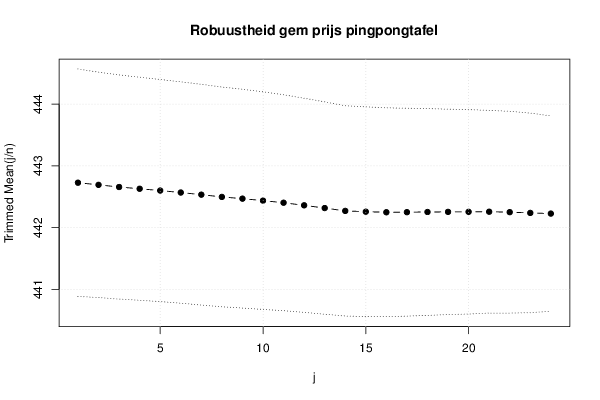
Trimmed Mean ( 1 / 24 )442.7262857142860.921291562831471480.549593175068
Trimmed Mean ( 2 / 24 )442.6916176470590.91277605323909484.994776184275
Trimmed Mean ( 3 / 24 )442.6565151515150.907751300681658487.640739064886
Trimmed Mean ( 4 / 24 )442.628281250.903130922968646490.104225193679
Trimmed Mean ( 5 / 24 )442.5988709677420.899389977904635492.110076653169
Trimmed Mean ( 6 / 24 )442.5668333333330.896506007859435493.65740937982
Trimmed Mean ( 7 / 24 )442.5325862068970.893875022911304495.072101651964
Trimmed Mean ( 8 / 24 )442.4958928571430.889649309894902497.382381951622
Trimmed Mean ( 9 / 24 )442.4679629629630.886110794199439499.337064686942
Trimmed Mean ( 10 / 24 )442.4361538461540.881127634930475502.124932083266
Trimmed Mean ( 11 / 24 )442.4020.874473089164824505.906934680542
Trimmed Mean ( 12 / 24 )442.3597916666670.867234256800742510.081086162979
Trimmed Mean ( 13 / 24 )442.3156521739130.860500901883553514.021137230336
Trimmed Mean ( 14 / 24 )442.2695454545450.851619707541638519.327513839764
Trimmed Mean ( 15 / 24 )442.2564285714290.849135094665664520.831645458679
Trimmed Mean ( 16 / 24 )442.24750.845539332509442523.035987796654
Trimmed Mean ( 17 / 24 )442.2486842105260.841899833806825525.298457669016
Trimmed Mean ( 18 / 24 )442.2519444444440.837351343778518528.155770848588
Trimmed Mean ( 19 / 24 )442.2535294117650.831716100862355531.736164483553
Trimmed Mean ( 20 / 24 )442.2543750.827828598812639534.234231137133
Trimmed Mean ( 21 / 24 )442.2563333333330.820592648650448538.947471757968
Trimmed Mean ( 22 / 24 )442.2489285714290.817028643343574541.289380947022
Trimmed Mean ( 23 / 24 )442.2369230769230.808220603782593547.173532829018
Trimmed Mean ( 24 / 24 )442.2258333333330.791058252098137559.030680939628
Median442.44
Midrange443.58
Midmean - Weighted Average at Xnp442.047027027027
Midmean - Weighted Average at X(n+1)p442.251944444444
Midmean - Empirical Distribution Function442.047027027027
Midmean - Empirical Distribution Function - Averaging442.251944444444
Midmean - Empirical Distribution Function - Interpolation442.251944444444
Midmean - Closest Observation442.047027027027
Midmean - True Basic - Statistics Graphics Toolkit442.251944444444
Midmean - MS Excel (old versions)442.248684210526
Number of observations72

\begin{tabular}{lllllllll}
\hline
Central Tendency - Ungrouped Data \tabularnewline
Measure & Value & S.E. & Value/S.E. \tabularnewline
Arithmetic Mean & 442.75 & 0.930234165414232 & 475.95542763455 \tabularnewline
Geometric Mean & 442.680730118174 &  &  \tabularnewline
Harmonic Mean & 442.611583969114 &  &  \tabularnewline
Quadratic Mean & 442.81937776906 &  &  \tabularnewline
Winsorized Mean ( 1 / 24 ) & 442.759027777778 & 0.928083031126628 & 477.068336483105 \tabularnewline
Winsorized Mean ( 2 / 24 ) & 442.755972222222 & 0.918973317631194 & 481.794154114832 \tabularnewline
Winsorized Mean ( 3 / 24 ) & 442.731805555556 & 0.914310294595849 & 484.224894078498 \tabularnewline
Winsorized Mean ( 4 / 24 ) & 442.729583333333 & 0.907000323460059 & 488.12505561673 \tabularnewline
Winsorized Mean ( 5 / 24 ) & 442.732361111111 & 0.898629988669319 & 492.674812429423 \tabularnewline
Winsorized Mean ( 6 / 24 ) & 442.732361111111 & 0.891696008754541 & 496.50593561531 \tabularnewline
Winsorized Mean ( 7 / 24 ) & 442.732361111111 & 0.891696008754541 & 496.50593561531 \tabularnewline
Winsorized Mean ( 8 / 24 ) & 442.663472222222 & 0.880095162190899 & 502.972282133969 \tabularnewline
Winsorized Mean ( 9 / 24 ) & 442.674722222222 & 0.877678595627745 & 504.369964617408 \tabularnewline
Winsorized Mean ( 10 / 24 ) & 442.673333333333 & 0.874440151771254 & 506.236284366243 \tabularnewline
Winsorized Mean ( 11 / 24 ) & 442.711527777778 & 0.863360311443417 & 512.777251756716 \tabularnewline
Winsorized Mean ( 12 / 24 ) & 442.698194444444 & 0.845574165905342 & 523.547445386361 \tabularnewline
Winsorized Mean ( 13 / 24 ) & 442.681944444444 & 0.840265431433243 & 526.835840062301 \tabularnewline
Winsorized Mean ( 14 / 24 ) & 442.376666666667 & 0.791093862457248 & 559.196180959593 \tabularnewline
Winsorized Mean ( 15 / 24 ) & 442.330833333333 & 0.783218844645096 & 564.760202537988 \tabularnewline
Winsorized Mean ( 16 / 24 ) & 442.2375 & 0.767984062813497 & 575.842027736709 \tabularnewline
Winsorized Mean ( 17 / 24 ) & 442.220972222222 & 0.755695850909255 & 585.183803364993 \tabularnewline
Winsorized Mean ( 18 / 24 ) & 442.238472222222 & 0.742077842970842 & 595.946202155504 \tabularnewline
Winsorized Mean ( 19 / 24 ) & 442.246388888889 & 0.714039493652777 & 619.358442803368 \tabularnewline
Winsorized Mean ( 20 / 24 ) & 442.238055555556 & 0.707587169513722 & 624.994452428351 \tabularnewline
Winsorized Mean ( 21 / 24 ) & 442.316805555556 & 0.669339092735311 & 660.826194609358 \tabularnewline
Winsorized Mean ( 22 / 24 ) & 442.344305555556 & 0.665686098888274 & 664.493830191574 \tabularnewline
Winsorized Mean ( 23 / 24 ) & 442.321944444444 & 0.662669373007462 & 667.485117709618 \tabularnewline
Winsorized Mean ( 24 / 24 ) & 442.158611111111 & 0.640875321602134 & 689.929220563139 \tabularnewline
Trimmed Mean ( 1 / 24 ) & 442.726285714286 & 0.921291562831471 & 480.549593175068 \tabularnewline
Trimmed Mean ( 2 / 24 ) & 442.691617647059 & 0.91277605323909 & 484.994776184275 \tabularnewline
Trimmed Mean ( 3 / 24 ) & 442.656515151515 & 0.907751300681658 & 487.640739064886 \tabularnewline
Trimmed Mean ( 4 / 24 ) & 442.62828125 & 0.903130922968646 & 490.104225193679 \tabularnewline
Trimmed Mean ( 5 / 24 ) & 442.598870967742 & 0.899389977904635 & 492.110076653169 \tabularnewline
Trimmed Mean ( 6 / 24 ) & 442.566833333333 & 0.896506007859435 & 493.65740937982 \tabularnewline
Trimmed Mean ( 7 / 24 ) & 442.532586206897 & 0.893875022911304 & 495.072101651964 \tabularnewline
Trimmed Mean ( 8 / 24 ) & 442.495892857143 & 0.889649309894902 & 497.382381951622 \tabularnewline
Trimmed Mean ( 9 / 24 ) & 442.467962962963 & 0.886110794199439 & 499.337064686942 \tabularnewline
Trimmed Mean ( 10 / 24 ) & 442.436153846154 & 0.881127634930475 & 502.124932083266 \tabularnewline
Trimmed Mean ( 11 / 24 ) & 442.402 & 0.874473089164824 & 505.906934680542 \tabularnewline
Trimmed Mean ( 12 / 24 ) & 442.359791666667 & 0.867234256800742 & 510.081086162979 \tabularnewline
Trimmed Mean ( 13 / 24 ) & 442.315652173913 & 0.860500901883553 & 514.021137230336 \tabularnewline
Trimmed Mean ( 14 / 24 ) & 442.269545454545 & 0.851619707541638 & 519.327513839764 \tabularnewline
Trimmed Mean ( 15 / 24 ) & 442.256428571429 & 0.849135094665664 & 520.831645458679 \tabularnewline
Trimmed Mean ( 16 / 24 ) & 442.2475 & 0.845539332509442 & 523.035987796654 \tabularnewline
Trimmed Mean ( 17 / 24 ) & 442.248684210526 & 0.841899833806825 & 525.298457669016 \tabularnewline
Trimmed Mean ( 18 / 24 ) & 442.251944444444 & 0.837351343778518 & 528.155770848588 \tabularnewline
Trimmed Mean ( 19 / 24 ) & 442.253529411765 & 0.831716100862355 & 531.736164483553 \tabularnewline
Trimmed Mean ( 20 / 24 ) & 442.254375 & 0.827828598812639 & 534.234231137133 \tabularnewline
Trimmed Mean ( 21 / 24 ) & 442.256333333333 & 0.820592648650448 & 538.947471757968 \tabularnewline
Trimmed Mean ( 22 / 24 ) & 442.248928571429 & 0.817028643343574 & 541.289380947022 \tabularnewline
Trimmed Mean ( 23 / 24 ) & 442.236923076923 & 0.808220603782593 & 547.173532829018 \tabularnewline
Trimmed Mean ( 24 / 24 ) & 442.225833333333 & 0.791058252098137 & 559.030680939628 \tabularnewline
Median & 442.44 &  &  \tabularnewline
Midrange & 443.58 &  &  \tabularnewline
Midmean - Weighted Average at Xnp & 442.047027027027 &  &  \tabularnewline
Midmean - Weighted Average at X(n+1)p & 442.251944444444 &  &  \tabularnewline
Midmean - Empirical Distribution Function & 442.047027027027 &  &  \tabularnewline
Midmean - Empirical Distribution Function - Averaging & 442.251944444444 &  &  \tabularnewline
Midmean - Empirical Distribution Function - Interpolation & 442.251944444444 &  &  \tabularnewline
Midmean - Closest Observation & 442.047027027027 &  &  \tabularnewline
Midmean - True Basic - Statistics Graphics Toolkit & 442.251944444444 &  &  \tabularnewline
Midmean - MS Excel (old versions) & 442.248684210526 &  &  \tabularnewline
Number of observations & 72 &  &  \tabularnewline
\hline
\end{tabular}
%Source: https://freestatistics.org/blog/index.php?pk=204938&T=1

[TABLE]
[ROW][C]Central Tendency - Ungrouped Data[/C][/ROW]
[ROW][C]Measure[/C][C]Value[/C][C]S.E.[/C][C]Value/S.E.[/C][/ROW]
[ROW][C]Arithmetic Mean[/C][C]442.75[/C][C]0.930234165414232[/C][C]475.95542763455[/C][/ROW]
[ROW][C]Geometric Mean[/C][C]442.680730118174[/C][C][/C][C][/C][/ROW]
[ROW][C]Harmonic Mean[/C][C]442.611583969114[/C][C][/C][C][/C][/ROW]
[ROW][C]Quadratic Mean[/C][C]442.81937776906[/C][C][/C][C][/C][/ROW]
[ROW][C]Winsorized Mean ( 1 / 24 )[/C][C]442.759027777778[/C][C]0.928083031126628[/C][C]477.068336483105[/C][/ROW]
[ROW][C]Winsorized Mean ( 2 / 24 )[/C][C]442.755972222222[/C][C]0.918973317631194[/C][C]481.794154114832[/C][/ROW]
[ROW][C]Winsorized Mean ( 3 / 24 )[/C][C]442.731805555556[/C][C]0.914310294595849[/C][C]484.224894078498[/C][/ROW]
[ROW][C]Winsorized Mean ( 4 / 24 )[/C][C]442.729583333333[/C][C]0.907000323460059[/C][C]488.12505561673[/C][/ROW]
[ROW][C]Winsorized Mean ( 5 / 24 )[/C][C]442.732361111111[/C][C]0.898629988669319[/C][C]492.674812429423[/C][/ROW]
[ROW][C]Winsorized Mean ( 6 / 24 )[/C][C]442.732361111111[/C][C]0.891696008754541[/C][C]496.50593561531[/C][/ROW]
[ROW][C]Winsorized Mean ( 7 / 24 )[/C][C]442.732361111111[/C][C]0.891696008754541[/C][C]496.50593561531[/C][/ROW]
[ROW][C]Winsorized Mean ( 8 / 24 )[/C][C]442.663472222222[/C][C]0.880095162190899[/C][C]502.972282133969[/C][/ROW]
[ROW][C]Winsorized Mean ( 9 / 24 )[/C][C]442.674722222222[/C][C]0.877678595627745[/C][C]504.369964617408[/C][/ROW]
[ROW][C]Winsorized Mean ( 10 / 24 )[/C][C]442.673333333333[/C][C]0.874440151771254[/C][C]506.236284366243[/C][/ROW]
[ROW][C]Winsorized Mean ( 11 / 24 )[/C][C]442.711527777778[/C][C]0.863360311443417[/C][C]512.777251756716[/C][/ROW]
[ROW][C]Winsorized Mean ( 12 / 24 )[/C][C]442.698194444444[/C][C]0.845574165905342[/C][C]523.547445386361[/C][/ROW]
[ROW][C]Winsorized Mean ( 13 / 24 )[/C][C]442.681944444444[/C][C]0.840265431433243[/C][C]526.835840062301[/C][/ROW]
[ROW][C]Winsorized Mean ( 14 / 24 )[/C][C]442.376666666667[/C][C]0.791093862457248[/C][C]559.196180959593[/C][/ROW]
[ROW][C]Winsorized Mean ( 15 / 24 )[/C][C]442.330833333333[/C][C]0.783218844645096[/C][C]564.760202537988[/C][/ROW]
[ROW][C]Winsorized Mean ( 16 / 24 )[/C][C]442.2375[/C][C]0.767984062813497[/C][C]575.842027736709[/C][/ROW]
[ROW][C]Winsorized Mean ( 17 / 24 )[/C][C]442.220972222222[/C][C]0.755695850909255[/C][C]585.183803364993[/C][/ROW]
[ROW][C]Winsorized Mean ( 18 / 24 )[/C][C]442.238472222222[/C][C]0.742077842970842[/C][C]595.946202155504[/C][/ROW]
[ROW][C]Winsorized Mean ( 19 / 24 )[/C][C]442.246388888889[/C][C]0.714039493652777[/C][C]619.358442803368[/C][/ROW]
[ROW][C]Winsorized Mean ( 20 / 24 )[/C][C]442.238055555556[/C][C]0.707587169513722[/C][C]624.994452428351[/C][/ROW]
[ROW][C]Winsorized Mean ( 21 / 24 )[/C][C]442.316805555556[/C][C]0.669339092735311[/C][C]660.826194609358[/C][/ROW]
[ROW][C]Winsorized Mean ( 22 / 24 )[/C][C]442.344305555556[/C][C]0.665686098888274[/C][C]664.493830191574[/C][/ROW]
[ROW][C]Winsorized Mean ( 23 / 24 )[/C][C]442.321944444444[/C][C]0.662669373007462[/C][C]667.485117709618[/C][/ROW]
[ROW][C]Winsorized Mean ( 24 / 24 )[/C][C]442.158611111111[/C][C]0.640875321602134[/C][C]689.929220563139[/C][/ROW]
[ROW][C]Trimmed Mean ( 1 / 24 )[/C][C]442.726285714286[/C][C]0.921291562831471[/C][C]480.549593175068[/C][/ROW]
[ROW][C]Trimmed Mean ( 2 / 24 )[/C][C]442.691617647059[/C][C]0.91277605323909[/C][C]484.994776184275[/C][/ROW]
[ROW][C]Trimmed Mean ( 3 / 24 )[/C][C]442.656515151515[/C][C]0.907751300681658[/C][C]487.640739064886[/C][/ROW]
[ROW][C]Trimmed Mean ( 4 / 24 )[/C][C]442.62828125[/C][C]0.903130922968646[/C][C]490.104225193679[/C][/ROW]
[ROW][C]Trimmed Mean ( 5 / 24 )[/C][C]442.598870967742[/C][C]0.899389977904635[/C][C]492.110076653169[/C][/ROW]
[ROW][C]Trimmed Mean ( 6 / 24 )[/C][C]442.566833333333[/C][C]0.896506007859435[/C][C]493.65740937982[/C][/ROW]
[ROW][C]Trimmed Mean ( 7 / 24 )[/C][C]442.532586206897[/C][C]0.893875022911304[/C][C]495.072101651964[/C][/ROW]
[ROW][C]Trimmed Mean ( 8 / 24 )[/C][C]442.495892857143[/C][C]0.889649309894902[/C][C]497.382381951622[/C][/ROW]
[ROW][C]Trimmed Mean ( 9 / 24 )[/C][C]442.467962962963[/C][C]0.886110794199439[/C][C]499.337064686942[/C][/ROW]
[ROW][C]Trimmed Mean ( 10 / 24 )[/C][C]442.436153846154[/C][C]0.881127634930475[/C][C]502.124932083266[/C][/ROW]
[ROW][C]Trimmed Mean ( 11 / 24 )[/C][C]442.402[/C][C]0.874473089164824[/C][C]505.906934680542[/C][/ROW]
[ROW][C]Trimmed Mean ( 12 / 24 )[/C][C]442.359791666667[/C][C]0.867234256800742[/C][C]510.081086162979[/C][/ROW]
[ROW][C]Trimmed Mean ( 13 / 24 )[/C][C]442.315652173913[/C][C]0.860500901883553[/C][C]514.021137230336[/C][/ROW]
[ROW][C]Trimmed Mean ( 14 / 24 )[/C][C]442.269545454545[/C][C]0.851619707541638[/C][C]519.327513839764[/C][/ROW]
[ROW][C]Trimmed Mean ( 15 / 24 )[/C][C]442.256428571429[/C][C]0.849135094665664[/C][C]520.831645458679[/C][/ROW]
[ROW][C]Trimmed Mean ( 16 / 24 )[/C][C]442.2475[/C][C]0.845539332509442[/C][C]523.035987796654[/C][/ROW]
[ROW][C]Trimmed Mean ( 17 / 24 )[/C][C]442.248684210526[/C][C]0.841899833806825[/C][C]525.298457669016[/C][/ROW]
[ROW][C]Trimmed Mean ( 18 / 24 )[/C][C]442.251944444444[/C][C]0.837351343778518[/C][C]528.155770848588[/C][/ROW]
[ROW][C]Trimmed Mean ( 19 / 24 )[/C][C]442.253529411765[/C][C]0.831716100862355[/C][C]531.736164483553[/C][/ROW]
[ROW][C]Trimmed Mean ( 20 / 24 )[/C][C]442.254375[/C][C]0.827828598812639[/C][C]534.234231137133[/C][/ROW]
[ROW][C]Trimmed Mean ( 21 / 24 )[/C][C]442.256333333333[/C][C]0.820592648650448[/C][C]538.947471757968[/C][/ROW]
[ROW][C]Trimmed Mean ( 22 / 24 )[/C][C]442.248928571429[/C][C]0.817028643343574[/C][C]541.289380947022[/C][/ROW]
[ROW][C]Trimmed Mean ( 23 / 24 )[/C][C]442.236923076923[/C][C]0.808220603782593[/C][C]547.173532829018[/C][/ROW]
[ROW][C]Trimmed Mean ( 24 / 24 )[/C][C]442.225833333333[/C][C]0.791058252098137[/C][C]559.030680939628[/C][/ROW]
[ROW][C]Median[/C][C]442.44[/C][C][/C][C][/C][/ROW]
[ROW][C]Midrange[/C][C]443.58[/C][C][/C][C][/C][/ROW]
[ROW][C]Midmean - Weighted Average at Xnp[/C][C]442.047027027027[/C][C][/C][C][/C][/ROW]
[ROW][C]Midmean - Weighted Average at X(n+1)p[/C][C]442.251944444444[/C][C][/C][C][/C][/ROW]
[ROW][C]Midmean - Empirical Distribution Function[/C][C]442.047027027027[/C][C][/C][C][/C][/ROW]
[ROW][C]Midmean - Empirical Distribution Function - Averaging[/C][C]442.251944444444[/C][C][/C][C][/C][/ROW]
[ROW][C]Midmean - Empirical Distribution Function - Interpolation[/C][C]442.251944444444[/C][C][/C][C][/C][/ROW]
[ROW][C]Midmean - Closest Observation[/C][C]442.047027027027[/C][C][/C][C][/C][/ROW]
[ROW][C]Midmean - True Basic - Statistics Graphics Toolkit[/C][C]442.251944444444[/C][C][/C][C][/C][/ROW]
[ROW][C]Midmean - MS Excel (old versions)[/C][C]442.248684210526[/C][C][/C][C][/C][/ROW]
[ROW][C]Number of observations[/C][C]72[/C][C][/C][C][/C][/ROW]
[/TABLE]
Source: https://freestatistics.org/blog/index.php?pk=204938&T=1

Globally Unique Identifier (entire table): ba.freestatistics.org/blog/index.php?pk=204938&T=1

As an alternative you can also use a QR Code:  

The GUIDs for individual cells are displayed in the table below:

Central Tendency - Ungrouped Data
MeasureValueS.E.Value/S.E.
Arithmetic Mean442.750.930234165414232475.95542763455
Geometric Mean442.680730118174
Harmonic Mean442.611583969114
Quadratic Mean442.81937776906
Winsorized Mean ( 1 / 24 )442.7590277777780.928083031126628477.068336483105
Winsorized Mean ( 2 / 24 )442.7559722222220.918973317631194481.794154114832
Winsorized Mean ( 3 / 24 )442.7318055555560.914310294595849484.224894078498
Winsorized Mean ( 4 / 24 )442.7295833333330.907000323460059488.12505561673
Winsorized Mean ( 5 / 24 )442.7323611111110.898629988669319492.674812429423
Winsorized Mean ( 6 / 24 )442.7323611111110.891696008754541496.50593561531
Winsorized Mean ( 7 / 24 )442.7323611111110.891696008754541496.50593561531
Winsorized Mean ( 8 / 24 )442.6634722222220.880095162190899502.972282133969
Winsorized Mean ( 9 / 24 )442.6747222222220.877678595627745504.369964617408
Winsorized Mean ( 10 / 24 )442.6733333333330.874440151771254506.236284366243
Winsorized Mean ( 11 / 24 )442.7115277777780.863360311443417512.777251756716
Winsorized Mean ( 12 / 24 )442.6981944444440.845574165905342523.547445386361
Winsorized Mean ( 13 / 24 )442.6819444444440.840265431433243526.835840062301
Winsorized Mean ( 14 / 24 )442.3766666666670.791093862457248559.196180959593
Winsorized Mean ( 15 / 24 )442.3308333333330.783218844645096564.760202537988
Winsorized Mean ( 16 / 24 )442.23750.767984062813497575.842027736709
Winsorized Mean ( 17 / 24 )442.2209722222220.755695850909255585.183803364993
Winsorized Mean ( 18 / 24 )442.2384722222220.742077842970842595.946202155504
Winsorized Mean ( 19 / 24 )442.2463888888890.714039493652777619.358442803368
Winsorized Mean ( 20 / 24 )442.2380555555560.707587169513722624.994452428351
Winsorized Mean ( 21 / 24 )442.3168055555560.669339092735311660.826194609358
Winsorized Mean ( 22 / 24 )442.3443055555560.665686098888274664.493830191574
Winsorized Mean ( 23 / 24 )442.3219444444440.662669373007462667.485117709618
Winsorized Mean ( 24 / 24 )442.1586111111110.640875321602134689.929220563139
Trimmed Mean ( 1 / 24 )442.7262857142860.921291562831471480.549593175068
Trimmed Mean ( 2 / 24 )442.6916176470590.91277605323909484.994776184275
Trimmed Mean ( 3 / 24 )442.6565151515150.907751300681658487.640739064886
Trimmed Mean ( 4 / 24 )442.628281250.903130922968646490.104225193679
Trimmed Mean ( 5 / 24 )442.5988709677420.899389977904635492.110076653169
Trimmed Mean ( 6 / 24 )442.5668333333330.896506007859435493.65740937982
Trimmed Mean ( 7 / 24 )442.5325862068970.893875022911304495.072101651964
Trimmed Mean ( 8 / 24 )442.4958928571430.889649309894902497.382381951622
Trimmed Mean ( 9 / 24 )442.4679629629630.886110794199439499.337064686942
Trimmed Mean ( 10 / 24 )442.4361538461540.881127634930475502.124932083266
Trimmed Mean ( 11 / 24 )442.4020.874473089164824505.906934680542
Trimmed Mean ( 12 / 24 )442.3597916666670.867234256800742510.081086162979
Trimmed Mean ( 13 / 24 )442.3156521739130.860500901883553514.021137230336
Trimmed Mean ( 14 / 24 )442.2695454545450.851619707541638519.327513839764
Trimmed Mean ( 15 / 24 )442.2564285714290.849135094665664520.831645458679
Trimmed Mean ( 16 / 24 )442.24750.845539332509442523.035987796654
Trimmed Mean ( 17 / 24 )442.2486842105260.841899833806825525.298457669016
Trimmed Mean ( 18 / 24 )442.2519444444440.837351343778518528.155770848588
Trimmed Mean ( 19 / 24 )442.2535294117650.831716100862355531.736164483553
Trimmed Mean ( 20 / 24 )442.2543750.827828598812639534.234231137133
Trimmed Mean ( 21 / 24 )442.2563333333330.820592648650448538.947471757968
Trimmed Mean ( 22 / 24 )442.2489285714290.817028643343574541.289380947022
Trimmed Mean ( 23 / 24 )442.2369230769230.808220603782593547.173532829018
Trimmed Mean ( 24 / 24 )442.2258333333330.791058252098137559.030680939628
Median442.44
Midrange443.58
Midmean - Weighted Average at Xnp442.047027027027
Midmean - Weighted Average at X(n+1)p442.251944444444
Midmean - Empirical Distribution Function442.047027027027
Midmean - Empirical Distribution Function - Averaging442.251944444444
Midmean - Empirical Distribution Function - Interpolation442.251944444444
Midmean - Closest Observation442.047027027027
Midmean - True Basic - Statistics Graphics Toolkit442.251944444444
Midmean - MS Excel (old versions)442.248684210526
Number of observations72


Parameters (Session):
Parameters (R input):
R code (references can be found in the software module):
geomean <- function(x) {
return(exp(mean(log(x))))
}
harmean <- function(x) {
return(1/mean(1/x))
}
quamean <- function(x) {
return(sqrt(mean(x*x)))
}
winmean <- function(x) {
x <-sort(x[!is.na(x)])
n<-length(x)
denom <- 3
nodenom <- n/denom
if (nodenom>40) denom <- n/40
sqrtn = sqrt(n)
roundnodenom = floor(nodenom)
win <- array(NA,dim=c(roundnodenom,2))
for (j in 1:roundnodenom) {
win[j,1] <- (j*x[j+1]+sum(x[(j+1):(n-j)])+j*x[n-j])/n
win[j,2] <- sd(c(rep(x[j+1],j),x[(j+1):(n-j)],rep(x[n-j],j)))/sqrtn
}
return(win)
}
trimean <- function(x) {
x <-sort(x[!is.na(x)])
n<-length(x)
denom <- 3
nodenom <- n/denom
if (nodenom>40) denom <- n/40
sqrtn = sqrt(n)
roundnodenom = floor(nodenom)
tri <- array(NA,dim=c(roundnodenom,2))
for (j in 1:roundnodenom) {
tri[j,1] <- mean(x,trim=j/n)
tri[j,2] <- sd(x[(j+1):(n-j)]) / sqrt(n-j*2)
}
return(tri)
}
midrange <- function(x) {
return((max(x)+min(x))/2)
}
q1 <- function(data,n,p,i,f) {
np <- n*p;
i <<- floor(np)
f <<- np - i
qvalue <- (1-f)*data[i] + f*data[i+1]
}
q2 <- function(data,n,p,i,f) {
np <- (n+1)*p
i <<- floor(np)
f <<- np - i
qvalue <- (1-f)*data[i] + f*data[i+1]
}
q3 <- function(data,n,p,i,f) {
np <- n*p
i <<- floor(np)
f <<- np - i
if (f==0) {
qvalue <- data[i]
} else {
qvalue <- data[i+1]
}
}
q4 <- function(data,n,p,i,f) {
np <- n*p
i <<- floor(np)
f <<- np - i
if (f==0) {
qvalue <- (data[i]+data[i+1])/2
} else {
qvalue <- data[i+1]
}
}
q5 <- function(data,n,p,i,f) {
np <- (n-1)*p
i <<- floor(np)
f <<- np - i
if (f==0) {
qvalue <- data[i+1]
} else {
qvalue <- data[i+1] + f*(data[i+2]-data[i+1])
}
}
q6 <- function(data,n,p,i,f) {
np <- n*p+0.5
i <<- floor(np)
f <<- np - i
qvalue <- data[i]
}
q7 <- function(data,n,p,i,f) {
np <- (n+1)*p
i <<- floor(np)
f <<- np - i
if (f==0) {
qvalue <- data[i]
} else {
qvalue <- f*data[i] + (1-f)*data[i+1]
}
}
q8 <- function(data,n,p,i,f) {
np <- (n+1)*p
i <<- floor(np)
f <<- np - i
if (f==0) {
qvalue <- data[i]
} else {
if (f == 0.5) {
qvalue <- (data[i]+data[i+1])/2
} else {
if (f < 0.5) {
qvalue <- data[i]
} else {
qvalue <- data[i+1]
}
}
}
}
midmean <- function(x,def) {
x <-sort(x[!is.na(x)])
n<-length(x)
if (def==1) {
qvalue1 <- q1(x,n,0.25,i,f)
qvalue3 <- q1(x,n,0.75,i,f)
}
if (def==2) {
qvalue1 <- q2(x,n,0.25,i,f)
qvalue3 <- q2(x,n,0.75,i,f)
}
if (def==3) {
qvalue1 <- q3(x,n,0.25,i,f)
qvalue3 <- q3(x,n,0.75,i,f)
}
if (def==4) {
qvalue1 <- q4(x,n,0.25,i,f)
qvalue3 <- q4(x,n,0.75,i,f)
}
if (def==5) {
qvalue1 <- q5(x,n,0.25,i,f)
qvalue3 <- q5(x,n,0.75,i,f)
}
if (def==6) {
qvalue1 <- q6(x,n,0.25,i,f)
qvalue3 <- q6(x,n,0.75,i,f)
}
if (def==7) {
qvalue1 <- q7(x,n,0.25,i,f)
qvalue3 <- q7(x,n,0.75,i,f)
}
if (def==8) {
qvalue1 <- q8(x,n,0.25,i,f)
qvalue3 <- q8(x,n,0.75,i,f)
}
midm <- 0
myn <- 0
roundno4 <- round(n/4)
round3no4 <- round(3*n/4)
for (i in 1:n) {
if ((x[i]>=qvalue1) & (x[i]<=qvalue3)){
midm = midm + x[i]
myn = myn + 1
}
}
midm = midm / myn
return(midm)
}
(arm <- mean(x))
sqrtn <- sqrt(length(x))
(armse <- sd(x) / sqrtn)
(armose <- arm / armse)
(geo <- geomean(x))
(har <- harmean(x))
(qua <- quamean(x))
(win <- winmean(x))
(tri <- trimean(x))
(midr <- midrange(x))
midm <- array(NA,dim=8)
for (j in 1:8) midm[j] <- midmean(x,j)
midm
bitmap(file='test1.png')
lb <- win[,1] - 2*win[,2]
ub <- win[,1] + 2*win[,2]
if ((ylimmin == '') | (ylimmax == '')) plot(win[,1],type='b',main=main, xlab='j', pch=19, ylab='Winsorized Mean(j/n)', ylim=c(min(lb),max(ub))) else plot(win[,1],type='l',main=main, xlab='j', pch=19, ylab='Winsorized Mean(j/n)', ylim=c(ylimmin,ylimmax))
lines(ub,lty=3)
lines(lb,lty=3)
grid()
dev.off()
bitmap(file='test2.png')
lb <- tri[,1] - 2*tri[,2]
ub <- tri[,1] + 2*tri[,2]
if ((ylimmin == '') | (ylimmax == '')) plot(tri[,1],type='b',main=main, xlab='j', pch=19, ylab='Trimmed Mean(j/n)', ylim=c(min(lb),max(ub))) else plot(tri[,1],type='l',main=main, xlab='j', pch=19, ylab='Trimmed Mean(j/n)', ylim=c(ylimmin,ylimmax))
lines(ub,lty=3)
lines(lb,lty=3)
grid()
dev.off()
load(file='createtable')
a<-table.start()
a<-table.row.start(a)
a<-table.element(a,'Central Tendency - Ungrouped Data',4,TRUE)
a<-table.row.end(a)
a<-table.row.start(a)
a<-table.element(a,'Measure',header=TRUE)
a<-table.element(a,'Value',header=TRUE)
a<-table.element(a,'S.E.',header=TRUE)
a<-table.element(a,'Value/S.E.',header=TRUE)
a<-table.row.end(a)
a<-table.row.start(a)
a<-table.element(a,hyperlink('arithmetic_mean.htm', 'Arithmetic Mean', 'click to view the definition of the Arithmetic Mean'),header=TRUE)
a<-table.element(a,arm)
a<-table.element(a,hyperlink('arithmetic_mean_standard_error.htm', armse, 'click to view the definition of the Standard Error of the Arithmetic Mean'))
a<-table.element(a,armose)
a<-table.row.end(a)
a<-table.row.start(a)
a<-table.element(a,hyperlink('geometric_mean.htm', 'Geometric Mean', 'click to view the definition of the Geometric Mean'),header=TRUE)
a<-table.element(a,geo)
a<-table.element(a,'')
a<-table.row.end(a)
a<-table.row.start(a)
a<-table.element(a,hyperlink('harmonic_mean.htm', 'Harmonic Mean', 'click to view the definition of the Harmonic Mean'),header=TRUE)
a<-table.element(a,har)
a<-table.element(a,'')
a<-table.row.end(a)
a<-table.row.start(a)
a<-table.element(a,hyperlink('quadratic_mean.htm', 'Quadratic Mean', 'click to view the definition of the Quadratic Mean'),header=TRUE)
a<-table.element(a,qua)
a<-table.element(a,'')
a<-table.row.end(a)
for (j in 1:length(win[,1])) {
a<-table.row.start(a)
mylabel <- paste('Winsorized Mean (',j)
mylabel <- paste(mylabel,'/')
mylabel <- paste(mylabel,length(win[,1]))
mylabel <- paste(mylabel,')')
a<-table.element(a,hyperlink('winsorized_mean.htm', mylabel, 'click to view the definition of the Winsorized Mean'),header=TRUE)
a<-table.element(a,win[j,1])
a<-table.element(a,win[j,2])
a<-table.element(a,win[j,1]/win[j,2])
a<-table.row.end(a)
}
for (j in 1:length(tri[,1])) {
a<-table.row.start(a)
mylabel <- paste('Trimmed Mean (',j)
mylabel <- paste(mylabel,'/')
mylabel <- paste(mylabel,length(tri[,1]))
mylabel <- paste(mylabel,')')
a<-table.element(a,hyperlink('arithmetic_mean.htm', mylabel, 'click to view the definition of the Trimmed Mean'),header=TRUE)
a<-table.element(a,tri[j,1])
a<-table.element(a,tri[j,2])
a<-table.element(a,tri[j,1]/tri[j,2])
a<-table.row.end(a)
}
a<-table.row.start(a)
a<-table.element(a,hyperlink('median_1.htm', 'Median', 'click to view the definition of the Median'),header=TRUE)
a<-table.element(a,median(x))
a<-table.element(a,'')
a<-table.row.end(a)
a<-table.row.start(a)
a<-table.element(a,hyperlink('midrange.htm', 'Midrange', 'click to view the definition of the Midrange'),header=TRUE)
a<-table.element(a,midr)
a<-table.element(a,'')
a<-table.row.end(a)
a<-table.row.start(a)
mymid <- hyperlink('midmean.htm', 'Midmean', 'click to view the definition of the Midmean')
mylabel <- paste(mymid,hyperlink('method_1.htm','Weighted Average at Xnp',''),sep=' - ')
a<-table.element(a,mylabel,header=TRUE)
a<-table.element(a,midm[1])
a<-table.element(a,'')
a<-table.row.end(a)
a<-table.row.start(a)
mymid <- hyperlink('midmean.htm', 'Midmean', 'click to view the definition of the Midmean')
mylabel <- paste(mymid,hyperlink('method_2.htm','Weighted Average at X(n+1)p',''),sep=' - ')
a<-table.element(a,mylabel,header=TRUE)
a<-table.element(a,midm[2])
a<-table.element(a,'')
a<-table.row.end(a)
a<-table.row.start(a)
mymid <- hyperlink('midmean.htm', 'Midmean', 'click to view the definition of the Midmean')
mylabel <- paste(mymid,hyperlink('method_3.htm','Empirical Distribution Function',''),sep=' - ')
a<-table.element(a,mylabel,header=TRUE)
a<-table.element(a,midm[3])
a<-table.element(a,'')
a<-table.row.end(a)
a<-table.row.start(a)
mymid <- hyperlink('midmean.htm', 'Midmean', 'click to view the definition of the Midmean')
mylabel <- paste(mymid,hyperlink('method_4.htm','Empirical Distribution Function - Averaging',''),sep=' - ')
a<-table.element(a,mylabel,header=TRUE)
a<-table.element(a,midm[4])
a<-table.element(a,'')
a<-table.row.end(a)
a<-table.row.start(a)
mymid <- hyperlink('midmean.htm', 'Midmean', 'click to view the definition of the Midmean')
mylabel <- paste(mymid,hyperlink('method_5.htm','Empirical Distribution Function - Interpolation',''),sep=' - ')
a<-table.element(a,mylabel,header=TRUE)
a<-table.element(a,midm[5])
a<-table.element(a,'')
a<-table.row.end(a)
a<-table.row.start(a)
mymid <- hyperlink('midmean.htm', 'Midmean', 'click to view the definition of the Midmean')
mylabel <- paste(mymid,hyperlink('method_6.htm','Closest Observation',''),sep=' - ')
a<-table.element(a,mylabel,header=TRUE)
a<-table.element(a,midm[6])
a<-table.element(a,'')
a<-table.row.end(a)
a<-table.row.start(a)
mymid <- hyperlink('midmean.htm', 'Midmean', 'click to view the definition of the Midmean')
mylabel <- paste(mymid,hyperlink('method_7.htm','True Basic - Statistics Graphics Toolkit',''),sep=' - ')
a<-table.element(a,mylabel,header=TRUE)
a<-table.element(a,midm[7])
a<-table.element(a,'')
a<-table.row.end(a)
a<-table.row.start(a)
mymid <- hyperlink('midmean.htm', 'Midmean', 'click to view the definition of the Midmean')
mylabel <- paste(mymid,hyperlink('method_8.htm','MS Excel (old versions)',''),sep=' - ')
a<-table.element(a,mylabel,header=TRUE)
a<-table.element(a,midm[8])
a<-table.element(a,'')
a<-table.row.end(a)
a<-table.row.start(a)
a<-table.element(a,'Number of observations',header=TRUE)
a<-table.element(a,length(x))
a<-table.element(a,'')
a<-table.row.end(a)
a<-table.end(a)
table.save(a,file='mytable.tab')