| Multiple Linear Regression - Estimated Regression Equation |
| IQ[t] = + 104.28175232058 + 2.56339144215531Geslacht[t] + 2.79284582295676Gewest[t] + e[t] |
| Multiple Linear Regression - Ordinary Least Squares | |||||
| Variable | Parameter | S.D. | T-STAT H0: parameter = 0 | 2-tail p-value | 1-tail p-value |
| (Intercept) | 104.28175232058 | 4.636978 | 22.4892 | 0 | 0 |
| Geslacht | 2.56339144215531 | 6.12914 | 0.4182 | 0.678196 | 0.339098 |
| Gewest | 2.79284582295676 | 3.72694 | 0.7494 | 0.458374 | 0.229187 |
| Multiple Linear Regression - Regression Statistics | |
| Multiple R | 0.176609884555284 |
| R-squared | 0.0311910513226308 |
| Adjusted R-squared | -0.0211769999572269 |
| F-TEST (value) | 0.595612220816545 |
| F-TEST (DF numerator) | 2 |
| F-TEST (DF denominator) | 37 |
| p-value | 0.556423700610235 |
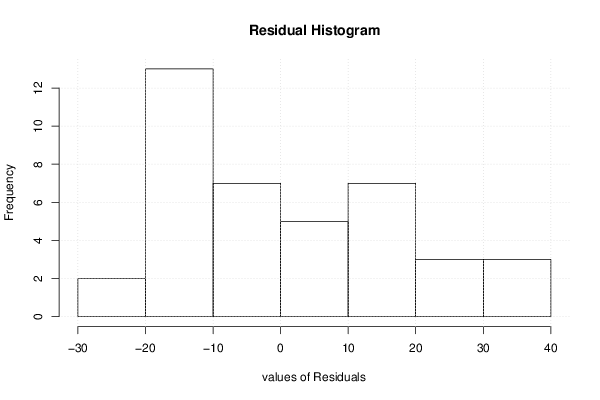
| Multiple Linear Regression - Residual Statistics | |
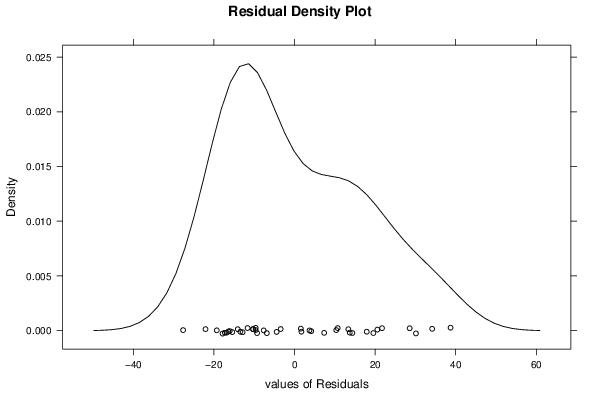
| Residual Standard Deviation | 17.6028720617483 |
| Sum Squared Residuals | 11464.8608784243 |
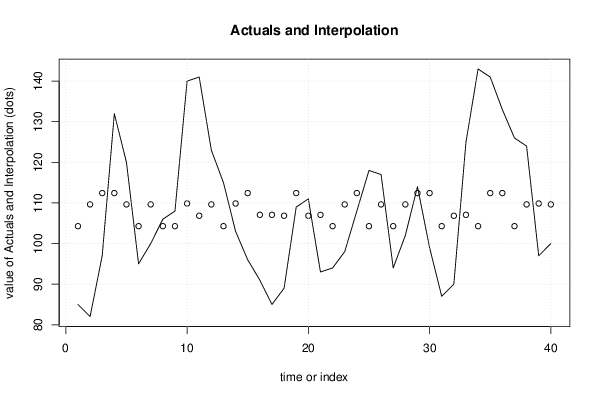
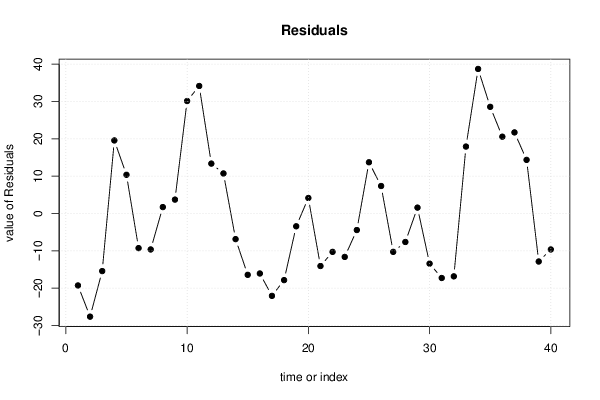
| Multiple Linear Regression - Actuals, Interpolation, and Residuals | |||
| Time or Index | Actuals | Interpolation Forecast | Residuals Prediction Error |
| 1 | 85 | 104.28175232058 | -19.2817523205795 |
| 2 | 82 | 109.637989585692 | -27.6379895856916 |
| 3 | 97 | 112.430835408648 | -15.4308354086484 |
| 4 | 132 | 112.430835408648 | 19.5691645913516 |
| 5 | 120 | 109.637989585692 | 10.3620104143084 |
| 6 | 95 | 104.28175232058 | -9.28175232057958 |
| 7 | 100 | 109.637989585692 | -9.63798958569165 |
| 8 | 106 | 104.28175232058 | 1.71824767942042 |
| 9 | 108 | 104.28175232058 | 3.71824767942042 |
| 10 | 140 | 109.867443966493 | 30.1325560335069 |
| 11 | 141 | 106.845143762735 | 34.1548562372651 |
| 12 | 123 | 109.637989585692 | 13.3620104143084 |
| 13 | 115 | 104.28175232058 | 10.7182476794204 |
| 14 | 103 | 109.867443966493 | -6.8674439664931 |
| 15 | 96 | 112.430835408648 | -16.4308354086484 |
| 16 | 91 | 107.074598143536 | -16.0745981435363 |
| 17 | 85 | 107.074598143536 | -22.0745981435363 |
| 18 | 89 | 106.845143762735 | -17.8451437627349 |
| 19 | 109 | 112.430835408648 | -3.4308354086484 |
| 20 | 111 | 106.845143762735 | 4.15485623726511 |
| 21 | 93 | 107.074598143536 | -14.0745981435363 |
| 22 | 94 | 104.28175232058 | -10.2817523205796 |
| 23 | 98 | 109.637989585692 | -11.6379895856916 |
| 24 | 108 | 112.430835408648 | -4.4308354086484 |
| 25 | 118 | 104.28175232058 | 13.7182476794204 |
| 26 | 117 | 109.637989585692 | 7.36201041430835 |
| 27 | 94 | 104.28175232058 | -10.2817523205796 |
| 28 | 102 | 109.637989585692 | -7.63798958569165 |
| 29 | 114 | 112.430835408648 | 1.5691645913516 |
| 30 | 99 | 112.430835408648 | -13.4308354086484 |
| 31 | 87 | 104.28175232058 | -17.2817523205796 |
| 32 | 90 | 106.845143762735 | -16.8451437627349 |
| 33 | 125 | 107.074598143536 | 17.9254018564637 |
| 34 | 143 | 104.28175232058 | 38.7182476794204 |
| 35 | 141 | 112.430835408648 | 28.5691645913516 |
| 36 | 133 | 112.430835408648 | 20.5691645913516 |
| 37 | 126 | 104.28175232058 | 21.7182476794204 |
| 38 | 124 | 109.637989585692 | 14.3620104143084 |
| 39 | 97 | 109.867443966493 | -12.8674439664931 |
| 40 | 100 | 109.637989585692 | -9.63798958569165 |
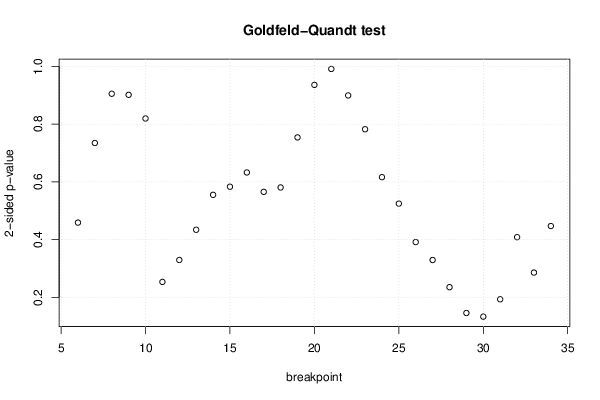
| Goldfeld-Quandt test for Heteroskedasticity | |||
| p-values | Alternative Hypothesis | ||
| breakpoint index | greater | 2-sided | less |
| 6 | 0.770661406167901 | 0.458677187664198 | 0.229338593832099 |
| 7 | 0.632741215887896 | 0.734517568224209 | 0.367258784112104 |
| 8 | 0.547425474164086 | 0.905149051671827 | 0.452574525835914 |
| 9 | 0.450670507645022 | 0.901341015290044 | 0.549329492354978 |
| 10 | 0.409716238770715 | 0.819432477541431 | 0.590283761229285 |
| 11 | 0.873348333189994 | 0.253303333620012 | 0.126651666810006 |
| 12 | 0.835379512044763 | 0.329240975910474 | 0.164620487955237 |
| 13 | 0.783044332057981 | 0.433911335884039 | 0.216955667942019 |
| 14 | 0.722535534039638 | 0.554928931920724 | 0.277464465960362 |
| 15 | 0.708512472017354 | 0.582975055965292 | 0.291487527982646 |
| 16 | 0.683813060954823 | 0.632373878090355 | 0.316186939045177 |
| 17 | 0.717376326108434 | 0.565247347783132 | 0.282623673891566 |
| 18 | 0.709771035637393 | 0.580457928725214 | 0.290228964362607 |
| 19 | 0.62307843388702 | 0.753843132225961 | 0.37692156611298 |
| 20 | 0.53208816870427 | 0.935823662591459 | 0.46791183129573 |
| 21 | 0.504489239601264 | 0.991021520797472 | 0.495510760398736 |
| 22 | 0.449618469383169 | 0.899236938766339 | 0.55038153061683 |
| 23 | 0.391057548076031 | 0.782115096152062 | 0.608942451923969 |
| 24 | 0.308046930736484 | 0.616093861472968 | 0.691953069263516 |
| 25 | 0.262242495827338 | 0.524484991654675 | 0.737757504172662 |
| 26 | 0.195631756205873 | 0.391263512411747 | 0.804368243794127 |
| 27 | 0.164546185525472 | 0.329092371050945 | 0.835453814474528 |
| 28 | 0.117458244819733 | 0.234916489639465 | 0.882541755180267 |
| 29 | 0.0727706597438519 | 0.145541319487704 | 0.927229340256148 |
| 30 | 0.066436852549583 | 0.132873705099166 | 0.933563147450417 |
| 31 | 0.0965662583389727 | 0.193132516677945 | 0.903433741661027 |
| 32 | 0.204073657302805 | 0.40814731460561 | 0.795926342697195 |
| 33 | 0.142799420640753 | 0.285598841281506 | 0.857200579359247 |
| 34 | 0.223407848399155 | 0.446815696798311 | 0.776592151600845 |
| Meta Analysis of Goldfeld-Quandt test for Heteroskedasticity | |||
| Description | # significant tests | % significant tests | OK/NOK |
| 1% type I error level | 0 | 0 | OK |
| 5% type I error level | 0 | 0 | OK |
| 10% type I error level | 0 | 0 | OK |