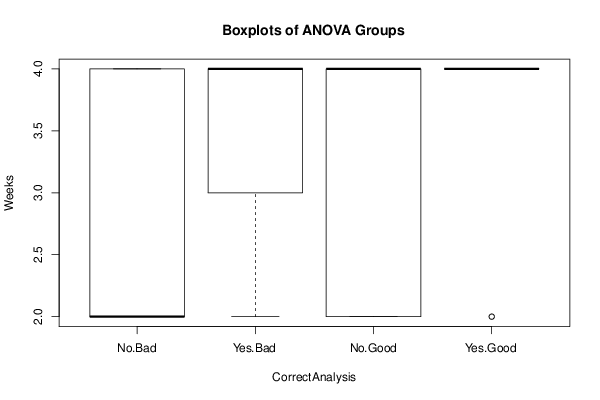
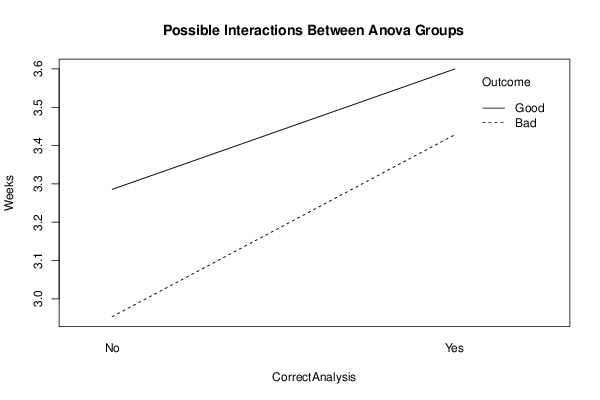
| ANOVA Model | ||||
| Response ~ Treatment_A * Treatment_B | ||||
| means | 2.953 | 0.475 | 0.332 | -0.161 |
| ANOVA Statistics | |||||
| Df | Sum Sq | Mean Sq | F value | Pr(>F) | |
| 1 | |||||
| Treatment_A | 1 | 1.91 | 1.91 | 1.96 | 0.164 |
| Treatment_B | 1 | 3.76 | 3.76 | 3.859 | 0.051 |
| Treatment_A:Treatment_B | 1 | 0.069 | 0.069 | 0.071 | 0.79 |
| Residuals | 150 | 146.157 | 0.974 | ||
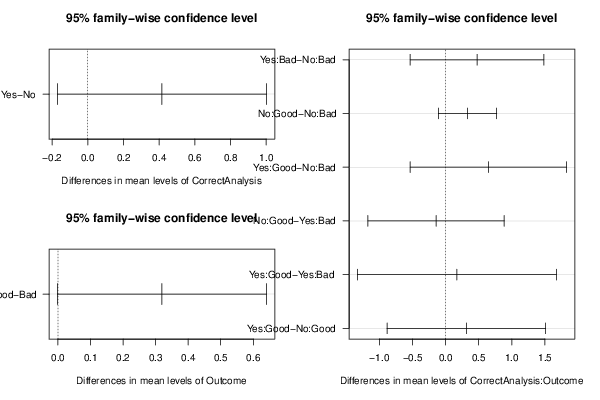
| Tukey Honest Significant Difference Comparisons | ||||
| diff | lwr | upr | p adj | |
| Yes-No | 0.415 | -0.171 | 1.002 | 0.164 |
| Good-Bad | 0.319 | -0.002 | 0.641 | 0.051 |
| Yes:Bad-No:Bad | 0.475 | -0.533 | 1.483 | 0.612 |
| No:Good-No:Bad | 0.332 | -0.108 | 0.773 | 0.208 |
| Yes:Good-No:Bad | 0.647 | -0.533 | 1.826 | 0.487 |
| No:Good-Yes:Bad | -0.143 | -1.171 | 0.885 | 0.984 |
| Yes:Good-Yes:Bad | 0.171 | -1.33 | 1.673 | 0.991 |
| Yes:Good-No:Good | 0.314 | -0.883 | 1.511 | 0.904 |
| Levenes Test for Homogeneity of Variance | |||
| Df | F value | Pr(>F) | |
| Group | 3 | 1.181 | 0.319 |
| 150 | |||