| Tabulation of Results | ||
| Ttwee x CorrectAnalysis | ||
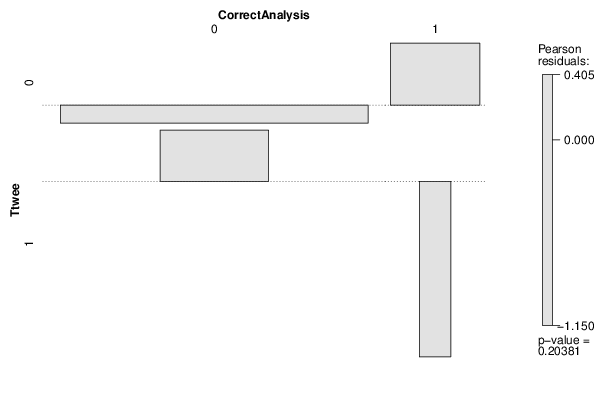
| 0 | 1 | 0 | 125 | 12 | 1 | 17 | 0 |
| Tabulation of Expected Results | ||
| Ttwee x CorrectAnalysis | ||
| 0 | 1 | 0 | 126.32 | 10.68 | 1 | 15.68 | 1.32 |
| Statistical Results | |
| Pearson's Chi-squared test with simulated p-value (based on 2000 replicates) | |
| Exact Pearson Chi Square Statistic | 1.61 |
| P value | 0.36 |