| Multiple Linear Regression - Estimated Regression Equation |
| bouwvergunningen[t] = + 237.971793178587 + 25.7542263149501werkloosheidsgraad[t] + 1.88597061814349uitvoer[t] -0.00227350662039262personenwagens[t] + 8.29566164668731rentetarieven[t] + 9.21572692390918M1[t] + 13.5354922947158M2[t] -1.57427563192264M3[t] -31.1339507305121M4[t] -46.6082513188682M5[t] + 7.67238241414198M6[t] -28.0895505103339M7[t] + 19.2118224859873M8[t] -4.03455206182543M9[t] + 9.3662944115171M10[t] + 49.1919666548201M11[t] + e[t] |
| Multiple Linear Regression - Ordinary Least Squares | |||||
| Variable | Parameter | S.D. | T-STAT H0: parameter = 0 | 2-tail p-value | 1-tail p-value |
| (Intercept) | 237.971793178587 | 92.729354 | 2.5663 | 0.013759 | 0.00688 |
| werkloosheidsgraad | 25.7542263149501 | 13.19549 | 1.9517 | 0.057352 | 0.028676 |
| uitvoer | 1.88597061814349 | 0.706613 | 2.669 | 0.010613 | 0.005307 |
| personenwagens | -0.00227350662039262 | 0.001807 | -1.2579 | 0.215072 | 0.107536 |
| rentetarieven | 8.29566164668731 | 4.844641 | 1.7123 | 0.093875 | 0.046937 |
| M1 | 9.21572692390918 | 21.26026 | 0.4335 | 0.66679 | 0.333395 |
| M2 | 13.5354922947158 | 20.434122 | 0.6624 | 0.511172 | 0.255586 |
| M3 | -1.57427563192264 | 22.040462 | -0.0714 | 0.943382 | 0.471691 |
| M4 | -31.1339507305121 | 23.545389 | -1.3223 | 0.192903 | 0.096451 |
| M5 | -46.6082513188682 | 23.457321 | -1.9869 | 0.053178 | 0.026589 |
| M6 | 7.67238241414198 | 29.360571 | 0.2613 | 0.795068 | 0.397534 |
| M7 | -28.0895505103339 | 26.150712 | -1.0741 | 0.288615 | 0.144307 |
| M8 | 19.2118224859873 | 22.409938 | 0.8573 | 0.39593 | 0.197965 |
| M9 | -4.03455206182543 | 22.907178 | -0.1761 | 0.861003 | 0.430502 |
| M10 | 9.3662944115171 | 20.432556 | 0.4584 | 0.648921 | 0.32446 |
| M11 | 49.1919666548201 | 20.589727 | 2.3892 | 0.02124 | 0.01062 |
| Multiple Linear Regression - Regression Statistics | |
| Multiple R | 0.775310551301425 |
| R-squared | 0.601106450959319 |
| Adjusted R-squared | 0.465120013786359 |
| F-TEST (value) | 4.42034120060649 |
| F-TEST (DF numerator) | 15 |
| F-TEST (DF denominator) | 44 |
| p-value | 5.7397316786556e-05 |
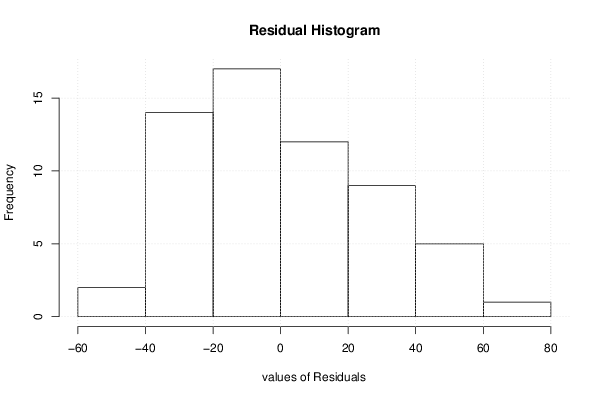
| Multiple Linear Regression - Residual Statistics | |
| Residual Standard Deviation | 32.2267321676143 |
| Sum Squared Residuals | 45696.7397129383 |
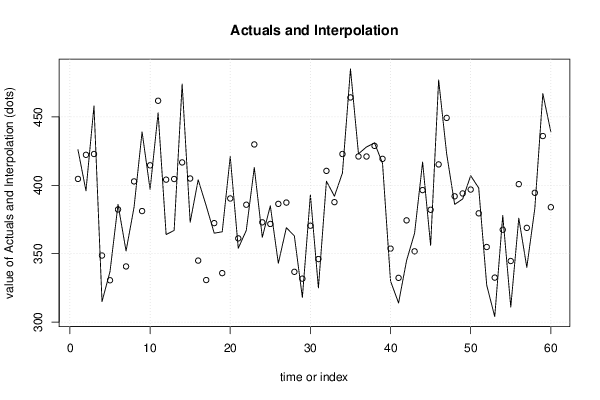
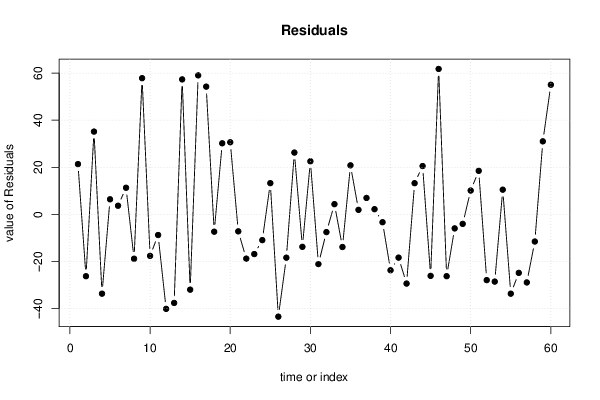
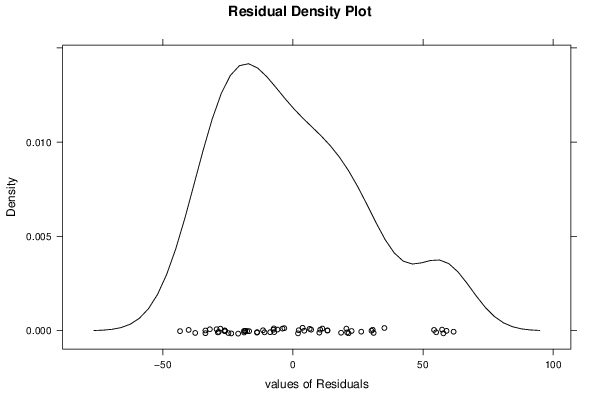
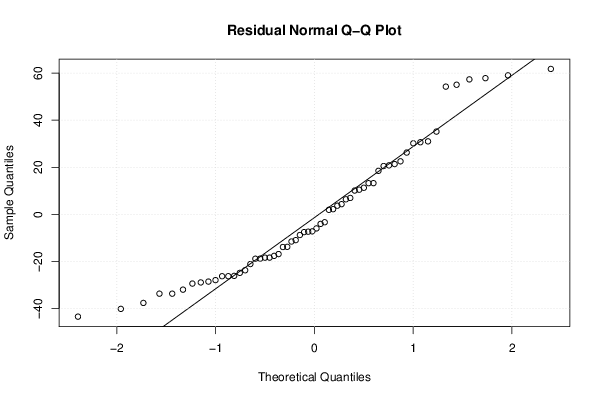
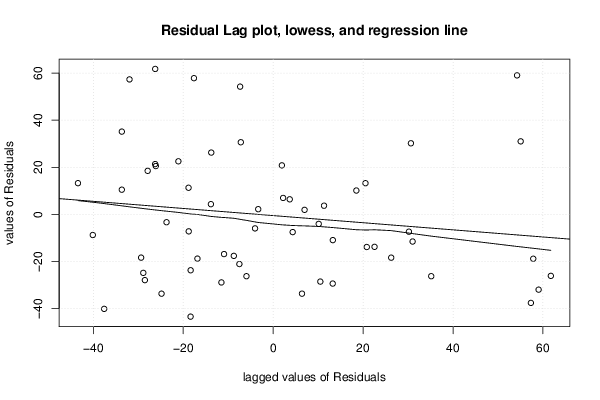
| Multiple Linear Regression - Actuals, Interpolation, and Residuals | |||
| Time or Index | Actuals | Interpolation Forecast | Residuals Prediction Error |
| 1 | 426 | 404.636217829915 | 21.3637821700848 |
| 2 | 396 | 422.246754497163 | -26.2467544971627 |
| 3 | 458 | 422.847125292794 | 35.1528747072063 |
| 4 | 315 | 348.660833161214 | -33.6608331612144 |
| 5 | 337 | 330.589251195282 | 6.41074880471785 |
| 6 | 386 | 382.315027844059 | 3.68497215594094 |
| 7 | 352 | 340.690553247017 | 11.3094467529835 |
| 8 | 384 | 402.821489989768 | -18.8214899897676 |
| 9 | 439 | 381.161191928063 | 57.8388080719369 |
| 10 | 397 | 414.612540625609 | -17.6125406256094 |
| 11 | 453 | 461.752039248019 | -8.75203924801866 |
| 12 | 364 | 404.110645100015 | -40.1106451000147 |
| 13 | 367 | 404.579813363483 | -37.5798133634831 |
| 14 | 474 | 416.68150061267 | 57.3184993873302 |
| 15 | 373 | 404.951995827925 | -31.9519958279247 |
| 16 | 404 | 344.966963695141 | 59.0330363048586 |
| 17 | 385 | 330.758996533859 | 54.2410034661413 |
| 18 | 365 | 372.348152554951 | -7.34815255495088 |
| 19 | 366 | 335.810026900523 | 30.189973099477 |
| 20 | 421 | 390.364732139623 | 30.6352678603766 |
| 21 | 354 | 361.199557761107 | -7.19955776110677 |
| 22 | 367 | 385.781940894538 | -18.7819408945377 |
| 23 | 413 | 429.842085898454 | -16.8420858984537 |
| 24 | 362 | 372.927433204873 | -10.9274332048728 |
| 25 | 385 | 371.736755042173 | 13.2632449578267 |
| 26 | 343 | 386.414572156792 | -43.4145721567918 |
| 27 | 369 | 387.371304912436 | -18.3713049124356 |
| 28 | 363 | 336.749345472121 | 26.2506545278786 |
| 29 | 318 | 331.771246370729 | -13.7712463707291 |
| 30 | 393 | 370.455610465545 | 22.544389534455 |
| 31 | 325 | 346.083203573188 | -21.0832035731876 |
| 32 | 403 | 410.514394855084 | -7.51439485508391 |
| 33 | 392 | 387.658113334574 | 4.34188666542627 |
| 34 | 409 | 422.845587996822 | -13.8455879968218 |
| 35 | 485 | 464.181106807818 | 20.818893192182 |
| 36 | 423 | 421.064395989796 | 1.93560401020407 |
| 37 | 428 | 421.018407077013 | 6.98159292298722 |
| 38 | 431 | 428.790158026416 | 2.20984197358404 |
| 39 | 416 | 419.325030590534 | -3.32503059053442 |
| 40 | 330 | 353.71740592346 | -23.7174059234605 |
| 41 | 314 | 332.35026501244 | -18.3502650124404 |
| 42 | 345 | 374.367175213587 | -29.3671752135871 |
| 43 | 365 | 351.754565183929 | 13.2454348160711 |
| 44 | 417 | 396.471689066611 | 20.5283109333887 |
| 45 | 356 | 382.094796995242 | -26.0947969952421 |
| 46 | 477 | 415.246178779871 | 61.7538212201288 |
| 47 | 423 | 449.238656961316 | -26.2386569613162 |
| 48 | 386 | 391.945056575877 | -5.94505657587736 |
| 49 | 390 | 394.028806687416 | -4.02880668741567 |
| 50 | 407 | 396.86701470696 | 10.1329852930402 |
| 51 | 398 | 379.504543376312 | 18.4954566236884 |
| 52 | 327 | 354.905451748062 | -27.9054517480624 |
| 53 | 304 | 332.53024088769 | -28.5302408876896 |
| 54 | 378 | 367.514033921858 | 10.485966078142 |
| 55 | 311 | 344.661651095344 | -33.661651095344 |
| 56 | 376 | 400.827693948914 | -24.8276939489139 |
| 57 | 340 | 368.886339981014 | -28.8863399810143 |
| 58 | 383 | 394.51375170316 | -11.5137517031599 |
| 59 | 467 | 435.986111084393 | 31.0138889156065 |
| 60 | 439 | 383.952469129439 | 55.0475308705609 |
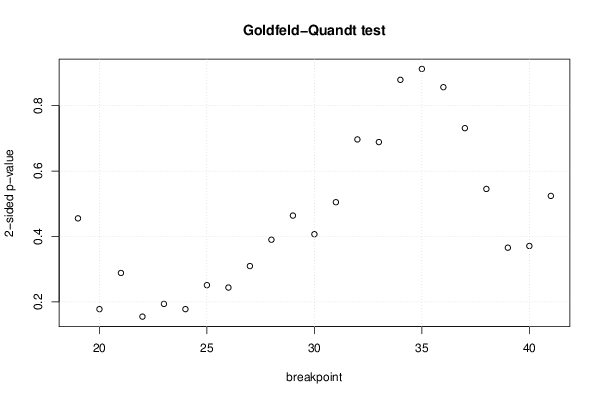
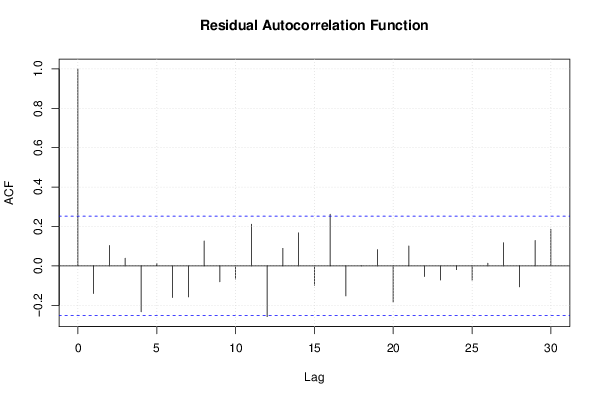
| Goldfeld-Quandt test for Heteroskedasticity | |||
| p-values | Alternative Hypothesis | ||
| breakpoint index | greater | 2-sided | less |
| 19 | 0.77225788859583 | 0.455484222808341 | 0.22774211140417 |
| 20 | 0.910985107568334 | 0.178029784863333 | 0.0890148924316665 |
| 21 | 0.855735814271853 | 0.288528371456294 | 0.144264185728147 |
| 22 | 0.922450848536052 | 0.155098302927896 | 0.0775491514639478 |
| 23 | 0.903014009370309 | 0.193971981259383 | 0.0969859906296913 |
| 24 | 0.910995326443291 | 0.178009347113417 | 0.0890046735567086 |
| 25 | 0.874337438574985 | 0.251325122850031 | 0.125662561425015 |
| 26 | 0.877998520305548 | 0.244002959388903 | 0.122001479694452 |
| 27 | 0.845163631397046 | 0.309672737205907 | 0.154836368602954 |
| 28 | 0.804906379377869 | 0.390187241244262 | 0.195093620622131 |
| 29 | 0.768046832322515 | 0.463906335354971 | 0.231953167677485 |
| 30 | 0.796524205947398 | 0.406951588105205 | 0.203475794052602 |
| 31 | 0.747639902570589 | 0.504720194858822 | 0.252360097429411 |
| 32 | 0.65172076186237 | 0.69655847627526 | 0.34827923813763 |
| 33 | 0.655735299110484 | 0.688529401779032 | 0.344264700889516 |
| 34 | 0.56065297992344 | 0.87869404015312 | 0.43934702007656 |
| 35 | 0.544032772786555 | 0.911934454426889 | 0.455967227213445 |
| 36 | 0.428085735129499 | 0.856171470258999 | 0.571914264870501 |
| 37 | 0.365481145090815 | 0.730962290181631 | 0.634518854909185 |
| 38 | 0.27266166774271 | 0.545323335485421 | 0.727338332257289 |
| 39 | 0.182903817626629 | 0.365807635253257 | 0.817096182373371 |
| 40 | 0.185537351011787 | 0.371074702023574 | 0.814462648988213 |
| 41 | 0.261990010747 | 0.523980021494 | 0.738009989253 |
| Meta Analysis of Goldfeld-Quandt test for Heteroskedasticity | |||
| Description | # significant tests | % significant tests | OK/NOK |
| 1% type I error level | 0 | 0 | OK |
| 5% type I error level | 0 | 0 | OK |
| 10% type I error level | 0 | 0 | OK |