Free Statistics

of Irreproducible Research!

Author's title

Author*The author of this computation has been verified*
R Software Modulerwasp_multipleregression.wasp
Title produced by softwareMultiple Regression
Date of computationSat, 22 Dec 2012 12:05:26 -0500
Cite this page as followsStatistical Computations at FreeStatistics.org, Office for Research Development and Education, URL https://freestatistics.org/blog/index.php?v=date/2012/Dec/22/t1356196558yfwtuurk3j3275w.htm/, Retrieved Thu, 25 Apr 2024 05:45:59 +0000
Statistical Computations at FreeStatistics.org, Office for Research Development and Education, URL https://freestatistics.org/blog/index.php?pk=204566, Retrieved Thu, 25 Apr 2024 05:45:59 +0000
QR Codes:

Original text written by user:
IsPrivate?No (this computation is public)
User-defined keywords
Estimated Impact86
Family? (F = Feedback message, R = changed R code, M = changed R Module, P = changed Parameters, D = changed Data)
-     [Univariate Data Series] [data set] [2008-12-01 19:54:57] [b98453cac15ba1066b407e146608df68]
- RMP   [Standard Deviation-Mean Plot] [Unemployment] [2010-11-29 10:34:47] [b98453cac15ba1066b407e146608df68]
- RMP     [ARIMA Backward Selection] [Unemployment] [2010-11-29 17:10:28] [b98453cac15ba1066b407e146608df68]
- RMPD        [Multiple Regression] [dummies] [2012-12-22 17:05:26] [081b45eff66f9ee50ac0b17603ac2bbc] [Current]
Feedback Forum

Post a new message
Dataseries X:
426	7.1	3.2	24776	3
396	7.2	2.9	19814	3
458	7.2	2.7	12738	3
315	7.1	3.1	31566	3
337	6.9	2.7	30111	3
386	6.8	2.6	30019	3
352	6.8	1.8	31934	3
384	6.8	2.3	25826	3
439	6.9	2.2	26835	3.18
397	7.1	1.8	20205	3.25
453	7.2	1.4	17789	3.25
364	7.2	0.3	20520	3.23
367	7.1	0.8	22518	2.92
474	7.1	-0.5	15572	2.25
373	7.2	-2.2	11509	1.62
404	7.5	-2.9	25447	1
385	7.7	-5.1	24090	0.66
365	7.8	-7.2	27786	0.31
366	7.7	-7.9	26195	0.25
421	7.7	-10.9	20516	0.25
354	7.8	-12.7	22759	0.25
367	8	-14	19028	0.25
413	8.1	-15.6	16971	0.25
362	8.1	-16	20036	0.25
385	8	-17.2	22485	0.25
343	8.1	-17.6	18730	0.25
369	8.2	-15.5	14538	0.25
363	8.4	-13.7	27561	0.25
318	8.5	-11.4	25985	0.25
393	8.5	-9.2	34670	0.25
325	8.5	-6.3	32066	0.25
403	8.5	-3.1	27186	0.25
392	8.5	0	29586	0.25
409	8.4	3	21359	0.25
485	8.3	5.4	21553	0.25
423	8.2	7.6	19573	0.25
428	8.1	9.7	24256	0.25
431	7.9	12	22380	0.25
416	7.6	11.6	16167	0.25
330	7.3	10	27297	0.25
314	7.1	10.8	28287	0.25
345	7	11.3	33474	0.39
365	7.1	10.1	28229	0.5
417	7.1	9.4	28785	0.5
356	7.1	9.6	25597	0.65
477	7.3	7.9	18130	0.75
423	7.3	7.3	20198	0.75
386	7.3	6.2	22849	0.75
390	7.2	4.9	23118	0.57
407	7.2	3.6	21925	0.36
398	7.1	2.9	20801	0.25
327	7.1	3.1	18785	0.25
304	7.1	1.7	20659	0.25
378	7.2	0.6	29367	0.25
311	7.3	-0.4	23992	0.25
376	7.4	-1.1	20645	0.25
340	7.4	-2.9	22356	0.08
383	7.5	-2.8	17902	0
467	7.4	-3	15879	0
439	7.4	-3.2	16963	0


Summary of computational transaction
Raw Inputview raw input (R code)
Raw Outputview raw output of R engine
Computing time8 seconds
R Server'George Udny Yule' @ yule.wessa.net

\begin{tabular}{lllllllll}
\hline
Summary of computational transaction \tabularnewline
Raw Input & view raw input (R code)  \tabularnewline
Raw Output & view raw output of R engine  \tabularnewline
Computing time & 8 seconds \tabularnewline
R Server & 'George Udny Yule' @ yule.wessa.net \tabularnewline
\hline
\end{tabular}
%Source: https://freestatistics.org/blog/index.php?pk=204566&T=0

[TABLE]
[ROW][C]Summary of computational transaction[/C][/ROW]
[ROW][C]Raw Input[/C][C]view raw input (R code) [/C][/ROW]
[ROW][C]Raw Output[/C][C]view raw output of R engine [/C][/ROW]
[ROW][C]Computing time[/C][C]8 seconds[/C][/ROW]
[ROW][C]R Server[/C][C]'George Udny Yule' @ yule.wessa.net[/C][/ROW]
[/TABLE]
Source: https://freestatistics.org/blog/index.php?pk=204566&T=0

Globally Unique Identifier (entire table): ba.freestatistics.org/blog/index.php?pk=204566&T=0

As an alternative you can also use a QR Code:  

The GUIDs for individual cells are displayed in the table below:

Summary of computational transaction
Raw Inputview raw input (R code)
Raw Outputview raw output of R engine
Computing time8 seconds
R Server'George Udny Yule' @ yule.wessa.net


Multiple Linear Regression - Estimated Regression Equation
bouwvergunningen[t] = + 237.971793178587 + 25.7542263149501werkloosheidsgraad[t] + 1.88597061814349uitvoer[t] -0.00227350662039262personenwagens[t] + 8.29566164668731rentetarieven[t] + 9.21572692390918M1[t] + 13.5354922947158M2[t] -1.57427563192264M3[t] -31.1339507305121M4[t] -46.6082513188682M5[t] + 7.67238241414198M6[t] -28.0895505103339M7[t] + 19.2118224859873M8[t] -4.03455206182543M9[t] + 9.3662944115171M10[t] + 49.1919666548201M11[t] + e[t]

\begin{tabular}{lllllllll}
\hline
Multiple Linear Regression - Estimated Regression Equation \tabularnewline
bouwvergunningen[t] =  +  237.971793178587 +  25.7542263149501werkloosheidsgraad[t] +  1.88597061814349uitvoer[t] -0.00227350662039262personenwagens[t] +  8.29566164668731rentetarieven[t] +  9.21572692390918M1[t] +  13.5354922947158M2[t] -1.57427563192264M3[t] -31.1339507305121M4[t] -46.6082513188682M5[t] +  7.67238241414198M6[t] -28.0895505103339M7[t] +  19.2118224859873M8[t] -4.03455206182543M9[t] +  9.3662944115171M10[t] +  49.1919666548201M11[t]  + e[t] \tabularnewline
\hline
\end{tabular}
%Source: https://freestatistics.org/blog/index.php?pk=204566&T=1

[TABLE]
[ROW][C]Multiple Linear Regression - Estimated Regression Equation[/C][/ROW]
[ROW][C]bouwvergunningen[t] =  +  237.971793178587 +  25.7542263149501werkloosheidsgraad[t] +  1.88597061814349uitvoer[t] -0.00227350662039262personenwagens[t] +  8.29566164668731rentetarieven[t] +  9.21572692390918M1[t] +  13.5354922947158M2[t] -1.57427563192264M3[t] -31.1339507305121M4[t] -46.6082513188682M5[t] +  7.67238241414198M6[t] -28.0895505103339M7[t] +  19.2118224859873M8[t] -4.03455206182543M9[t] +  9.3662944115171M10[t] +  49.1919666548201M11[t]  + e[t][/C][/ROW]
[/TABLE]
Source: https://freestatistics.org/blog/index.php?pk=204566&T=1

Globally Unique Identifier (entire table): ba.freestatistics.org/blog/index.php?pk=204566&T=1

As an alternative you can also use a QR Code:  

The GUIDs for individual cells are displayed in the table below:

Multiple Linear Regression - Estimated Regression Equation
bouwvergunningen[t] = + 237.971793178587 + 25.7542263149501werkloosheidsgraad[t] + 1.88597061814349uitvoer[t] -0.00227350662039262personenwagens[t] + 8.29566164668731rentetarieven[t] + 9.21572692390918M1[t] + 13.5354922947158M2[t] -1.57427563192264M3[t] -31.1339507305121M4[t] -46.6082513188682M5[t] + 7.67238241414198M6[t] -28.0895505103339M7[t] + 19.2118224859873M8[t] -4.03455206182543M9[t] + 9.3662944115171M10[t] + 49.1919666548201M11[t] + e[t]


Multiple Linear Regression - Ordinary Least Squares
VariableParameterS.D.T-STATH0: parameter = 02-tail p-value1-tail p-value
(Intercept)237.97179317858792.7293542.56630.0137590.00688
werkloosheidsgraad25.754226314950113.195491.95170.0573520.028676
uitvoer1.885970618143490.7066132.6690.0106130.005307
personenwagens-0.002273506620392620.001807-1.25790.2150720.107536
rentetarieven8.295661646687314.8446411.71230.0938750.046937
M19.2157269239091821.260260.43350.666790.333395
M213.535492294715820.4341220.66240.5111720.255586
M3-1.5742756319226422.040462-0.07140.9433820.471691
M4-31.133950730512123.545389-1.32230.1929030.096451
M5-46.608251318868223.457321-1.98690.0531780.026589
M67.6723824141419829.3605710.26130.7950680.397534
M7-28.089550510333926.150712-1.07410.2886150.144307
M819.211822485987322.4099380.85730.395930.197965
M9-4.0345520618254322.907178-0.17610.8610030.430502
M109.366294411517120.4325560.45840.6489210.32446
M1149.191966654820120.5897272.38920.021240.01062

\begin{tabular}{lllllllll}
\hline
Multiple Linear Regression - Ordinary Least Squares \tabularnewline
Variable & Parameter & S.D. & T-STATH0: parameter = 0 & 2-tail p-value & 1-tail p-value \tabularnewline
(Intercept) & 237.971793178587 & 92.729354 & 2.5663 & 0.013759 & 0.00688 \tabularnewline
werkloosheidsgraad & 25.7542263149501 & 13.19549 & 1.9517 & 0.057352 & 0.028676 \tabularnewline
uitvoer & 1.88597061814349 & 0.706613 & 2.669 & 0.010613 & 0.005307 \tabularnewline
personenwagens & -0.00227350662039262 & 0.001807 & -1.2579 & 0.215072 & 0.107536 \tabularnewline
rentetarieven & 8.29566164668731 & 4.844641 & 1.7123 & 0.093875 & 0.046937 \tabularnewline
M1 & 9.21572692390918 & 21.26026 & 0.4335 & 0.66679 & 0.333395 \tabularnewline
M2 & 13.5354922947158 & 20.434122 & 0.6624 & 0.511172 & 0.255586 \tabularnewline
M3 & -1.57427563192264 & 22.040462 & -0.0714 & 0.943382 & 0.471691 \tabularnewline
M4 & -31.1339507305121 & 23.545389 & -1.3223 & 0.192903 & 0.096451 \tabularnewline
M5 & -46.6082513188682 & 23.457321 & -1.9869 & 0.053178 & 0.026589 \tabularnewline
M6 & 7.67238241414198 & 29.360571 & 0.2613 & 0.795068 & 0.397534 \tabularnewline
M7 & -28.0895505103339 & 26.150712 & -1.0741 & 0.288615 & 0.144307 \tabularnewline
M8 & 19.2118224859873 & 22.409938 & 0.8573 & 0.39593 & 0.197965 \tabularnewline
M9 & -4.03455206182543 & 22.907178 & -0.1761 & 0.861003 & 0.430502 \tabularnewline
M10 & 9.3662944115171 & 20.432556 & 0.4584 & 0.648921 & 0.32446 \tabularnewline
M11 & 49.1919666548201 & 20.589727 & 2.3892 & 0.02124 & 0.01062 \tabularnewline
\hline
\end{tabular}
%Source: https://freestatistics.org/blog/index.php?pk=204566&T=2

[TABLE]
[ROW][C]Multiple Linear Regression - Ordinary Least Squares[/C][/ROW]
[ROW][C]Variable[/C][C]Parameter[/C][C]S.D.[/C][C]T-STATH0: parameter = 0[/C][C]2-tail p-value[/C][C]1-tail p-value[/C][/ROW]
[ROW][C](Intercept)[/C][C]237.971793178587[/C][C]92.729354[/C][C]2.5663[/C][C]0.013759[/C][C]0.00688[/C][/ROW]
[ROW][C]werkloosheidsgraad[/C][C]25.7542263149501[/C][C]13.19549[/C][C]1.9517[/C][C]0.057352[/C][C]0.028676[/C][/ROW]
[ROW][C]uitvoer[/C][C]1.88597061814349[/C][C]0.706613[/C][C]2.669[/C][C]0.010613[/C][C]0.005307[/C][/ROW]
[ROW][C]personenwagens[/C][C]-0.00227350662039262[/C][C]0.001807[/C][C]-1.2579[/C][C]0.215072[/C][C]0.107536[/C][/ROW]
[ROW][C]rentetarieven[/C][C]8.29566164668731[/C][C]4.844641[/C][C]1.7123[/C][C]0.093875[/C][C]0.046937[/C][/ROW]
[ROW][C]M1[/C][C]9.21572692390918[/C][C]21.26026[/C][C]0.4335[/C][C]0.66679[/C][C]0.333395[/C][/ROW]
[ROW][C]M2[/C][C]13.5354922947158[/C][C]20.434122[/C][C]0.6624[/C][C]0.511172[/C][C]0.255586[/C][/ROW]
[ROW][C]M3[/C][C]-1.57427563192264[/C][C]22.040462[/C][C]-0.0714[/C][C]0.943382[/C][C]0.471691[/C][/ROW]
[ROW][C]M4[/C][C]-31.1339507305121[/C][C]23.545389[/C][C]-1.3223[/C][C]0.192903[/C][C]0.096451[/C][/ROW]
[ROW][C]M5[/C][C]-46.6082513188682[/C][C]23.457321[/C][C]-1.9869[/C][C]0.053178[/C][C]0.026589[/C][/ROW]
[ROW][C]M6[/C][C]7.67238241414198[/C][C]29.360571[/C][C]0.2613[/C][C]0.795068[/C][C]0.397534[/C][/ROW]
[ROW][C]M7[/C][C]-28.0895505103339[/C][C]26.150712[/C][C]-1.0741[/C][C]0.288615[/C][C]0.144307[/C][/ROW]
[ROW][C]M8[/C][C]19.2118224859873[/C][C]22.409938[/C][C]0.8573[/C][C]0.39593[/C][C]0.197965[/C][/ROW]
[ROW][C]M9[/C][C]-4.03455206182543[/C][C]22.907178[/C][C]-0.1761[/C][C]0.861003[/C][C]0.430502[/C][/ROW]
[ROW][C]M10[/C][C]9.3662944115171[/C][C]20.432556[/C][C]0.4584[/C][C]0.648921[/C][C]0.32446[/C][/ROW]
[ROW][C]M11[/C][C]49.1919666548201[/C][C]20.589727[/C][C]2.3892[/C][C]0.02124[/C][C]0.01062[/C][/ROW]
[/TABLE]
Source: https://freestatistics.org/blog/index.php?pk=204566&T=2

Globally Unique Identifier (entire table): ba.freestatistics.org/blog/index.php?pk=204566&T=2

As an alternative you can also use a QR Code:  

The GUIDs for individual cells are displayed in the table below:

Multiple Linear Regression - Ordinary Least Squares
VariableParameterS.D.T-STATH0: parameter = 02-tail p-value1-tail p-value
(Intercept)237.97179317858792.7293542.56630.0137590.00688
werkloosheidsgraad25.754226314950113.195491.95170.0573520.028676
uitvoer1.885970618143490.7066132.6690.0106130.005307
personenwagens-0.002273506620392620.001807-1.25790.2150720.107536
rentetarieven8.295661646687314.8446411.71230.0938750.046937
M19.2157269239091821.260260.43350.666790.333395
M213.535492294715820.4341220.66240.5111720.255586
M3-1.5742756319226422.040462-0.07140.9433820.471691
M4-31.133950730512123.545389-1.32230.1929030.096451
M5-46.608251318868223.457321-1.98690.0531780.026589
M67.6723824141419829.3605710.26130.7950680.397534
M7-28.089550510333926.150712-1.07410.2886150.144307
M819.211822485987322.4099380.85730.395930.197965
M9-4.0345520618254322.907178-0.17610.8610030.430502
M109.366294411517120.4325560.45840.6489210.32446
M1149.191966654820120.5897272.38920.021240.01062


Multiple Linear Regression - Regression Statistics
Multiple R0.775310551301425
R-squared0.601106450959319
Adjusted R-squared0.465120013786359
F-TEST (value)4.42034120060649
F-TEST (DF numerator)15
F-TEST (DF denominator)44
p-value5.7397316786556e-05
Multiple Linear Regression - Residual Statistics
Residual Standard Deviation32.2267321676143
Sum Squared Residuals45696.7397129383

\begin{tabular}{lllllllll}
\hline
Multiple Linear Regression - Regression Statistics \tabularnewline
Multiple R & 0.775310551301425 \tabularnewline
R-squared & 0.601106450959319 \tabularnewline
Adjusted R-squared & 0.465120013786359 \tabularnewline
F-TEST (value) & 4.42034120060649 \tabularnewline
F-TEST (DF numerator) & 15 \tabularnewline
F-TEST (DF denominator) & 44 \tabularnewline
p-value & 5.7397316786556e-05 \tabularnewline
Multiple Linear Regression - Residual Statistics \tabularnewline
Residual Standard Deviation & 32.2267321676143 \tabularnewline
Sum Squared Residuals & 45696.7397129383 \tabularnewline
\hline
\end{tabular}
%Source: https://freestatistics.org/blog/index.php?pk=204566&T=3

[TABLE]
[ROW][C]Multiple Linear Regression - Regression Statistics[/C][/ROW]
[ROW][C]Multiple R[/C][C]0.775310551301425[/C][/ROW]
[ROW][C]R-squared[/C][C]0.601106450959319[/C][/ROW]
[ROW][C]Adjusted R-squared[/C][C]0.465120013786359[/C][/ROW]
[ROW][C]F-TEST (value)[/C][C]4.42034120060649[/C][/ROW]
[ROW][C]F-TEST (DF numerator)[/C][C]15[/C][/ROW]
[ROW][C]F-TEST (DF denominator)[/C][C]44[/C][/ROW]
[ROW][C]p-value[/C][C]5.7397316786556e-05[/C][/ROW]
[ROW][C]Multiple Linear Regression - Residual Statistics[/C][/ROW]
[ROW][C]Residual Standard Deviation[/C][C]32.2267321676143[/C][/ROW]
[ROW][C]Sum Squared Residuals[/C][C]45696.7397129383[/C][/ROW]
[/TABLE]
Source: https://freestatistics.org/blog/index.php?pk=204566&T=3

Globally Unique Identifier (entire table): ba.freestatistics.org/blog/index.php?pk=204566&T=3

As an alternative you can also use a QR Code:  

The GUIDs for individual cells are displayed in the table below:

Multiple Linear Regression - Regression Statistics
Multiple R0.775310551301425
R-squared0.601106450959319
Adjusted R-squared0.465120013786359
F-TEST (value)4.42034120060649
F-TEST (DF numerator)15
F-TEST (DF denominator)44
p-value5.7397316786556e-05
Multiple Linear Regression - Residual Statistics
Residual Standard Deviation32.2267321676143
Sum Squared Residuals45696.7397129383


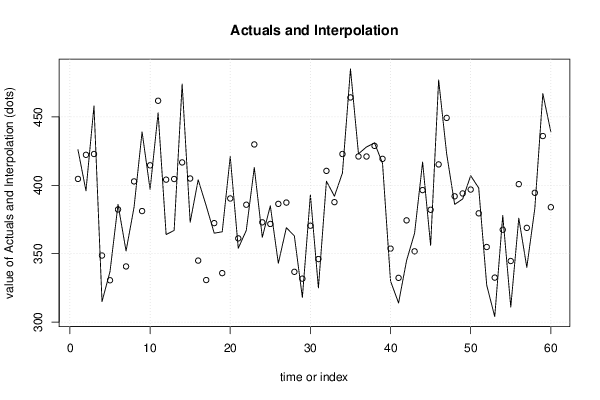
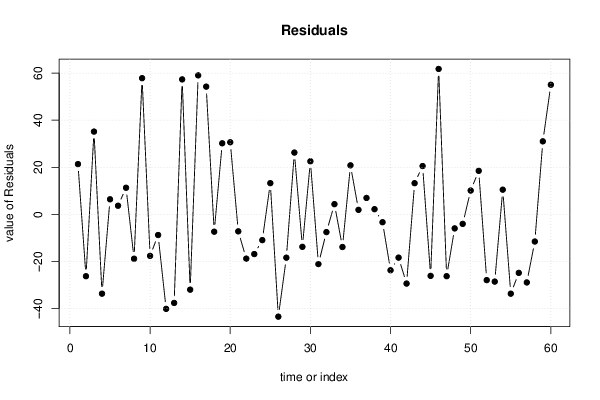
Multiple Linear Regression - Actuals, Interpolation, and Residuals
Time or IndexActualsInterpolationForecastResidualsPrediction Error
1426404.63621782991521.3637821700848
2396422.246754497163-26.2467544971627
3458422.84712529279435.1528747072063
4315348.660833161214-33.6608331612144
5337330.5892511952826.41074880471785
6386382.3150278440593.68497215594094
7352340.69055324701711.3094467529835
8384402.821489989768-18.8214899897676
9439381.16119192806357.8388080719369
10397414.612540625609-17.6125406256094
11453461.752039248019-8.75203924801866
12364404.110645100015-40.1106451000147
13367404.579813363483-37.5798133634831
14474416.6815006126757.3184993873302
15373404.951995827925-31.9519958279247
16404344.96696369514159.0330363048586
17385330.75899653385954.2410034661413
18365372.348152554951-7.34815255495088
19366335.81002690052330.189973099477
20421390.36473213962330.6352678603766
21354361.199557761107-7.19955776110677
22367385.781940894538-18.7819408945377
23413429.842085898454-16.8420858984537
24362372.927433204873-10.9274332048728
25385371.73675504217313.2632449578267
26343386.414572156792-43.4145721567918
27369387.371304912436-18.3713049124356
28363336.74934547212126.2506545278786
29318331.771246370729-13.7712463707291
30393370.45561046554522.544389534455
31325346.083203573188-21.0832035731876
32403410.514394855084-7.51439485508391
33392387.6581133345744.34188666542627
34409422.845587996822-13.8455879968218
35485464.18110680781820.818893192182
36423421.0643959897961.93560401020407
37428421.0184070770136.98159292298722
38431428.7901580264162.20984197358404
39416419.325030590534-3.32503059053442
40330353.71740592346-23.7174059234605
41314332.35026501244-18.3502650124404
42345374.367175213587-29.3671752135871
43365351.75456518392913.2454348160711
44417396.47168906661120.5283109333887
45356382.094796995242-26.0947969952421
46477415.24617877987161.7538212201288
47423449.238656961316-26.2386569613162
48386391.945056575877-5.94505657587736
49390394.028806687416-4.02880668741567
50407396.8670147069610.1329852930402
51398379.50454337631218.4954566236884
52327354.905451748062-27.9054517480624
53304332.53024088769-28.5302408876896
54378367.51403392185810.485966078142
55311344.661651095344-33.661651095344
56376400.827693948914-24.8276939489139
57340368.886339981014-28.8863399810143
58383394.51375170316-11.5137517031599
59467435.98611108439331.0138889156065
60439383.95246912943955.0475308705609

\begin{tabular}{lllllllll}
\hline
Multiple Linear Regression - Actuals, Interpolation, and Residuals \tabularnewline
Time or Index & Actuals & InterpolationForecast & ResidualsPrediction Error \tabularnewline
1 & 426 & 404.636217829915 & 21.3637821700848 \tabularnewline
2 & 396 & 422.246754497163 & -26.2467544971627 \tabularnewline
3 & 458 & 422.847125292794 & 35.1528747072063 \tabularnewline
4 & 315 & 348.660833161214 & -33.6608331612144 \tabularnewline
5 & 337 & 330.589251195282 & 6.41074880471785 \tabularnewline
6 & 386 & 382.315027844059 & 3.68497215594094 \tabularnewline
7 & 352 & 340.690553247017 & 11.3094467529835 \tabularnewline
8 & 384 & 402.821489989768 & -18.8214899897676 \tabularnewline
9 & 439 & 381.161191928063 & 57.8388080719369 \tabularnewline
10 & 397 & 414.612540625609 & -17.6125406256094 \tabularnewline
11 & 453 & 461.752039248019 & -8.75203924801866 \tabularnewline
12 & 364 & 404.110645100015 & -40.1106451000147 \tabularnewline
13 & 367 & 404.579813363483 & -37.5798133634831 \tabularnewline
14 & 474 & 416.68150061267 & 57.3184993873302 \tabularnewline
15 & 373 & 404.951995827925 & -31.9519958279247 \tabularnewline
16 & 404 & 344.966963695141 & 59.0330363048586 \tabularnewline
17 & 385 & 330.758996533859 & 54.2410034661413 \tabularnewline
18 & 365 & 372.348152554951 & -7.34815255495088 \tabularnewline
19 & 366 & 335.810026900523 & 30.189973099477 \tabularnewline
20 & 421 & 390.364732139623 & 30.6352678603766 \tabularnewline
21 & 354 & 361.199557761107 & -7.19955776110677 \tabularnewline
22 & 367 & 385.781940894538 & -18.7819408945377 \tabularnewline
23 & 413 & 429.842085898454 & -16.8420858984537 \tabularnewline
24 & 362 & 372.927433204873 & -10.9274332048728 \tabularnewline
25 & 385 & 371.736755042173 & 13.2632449578267 \tabularnewline
26 & 343 & 386.414572156792 & -43.4145721567918 \tabularnewline
27 & 369 & 387.371304912436 & -18.3713049124356 \tabularnewline
28 & 363 & 336.749345472121 & 26.2506545278786 \tabularnewline
29 & 318 & 331.771246370729 & -13.7712463707291 \tabularnewline
30 & 393 & 370.455610465545 & 22.544389534455 \tabularnewline
31 & 325 & 346.083203573188 & -21.0832035731876 \tabularnewline
32 & 403 & 410.514394855084 & -7.51439485508391 \tabularnewline
33 & 392 & 387.658113334574 & 4.34188666542627 \tabularnewline
34 & 409 & 422.845587996822 & -13.8455879968218 \tabularnewline
35 & 485 & 464.181106807818 & 20.818893192182 \tabularnewline
36 & 423 & 421.064395989796 & 1.93560401020407 \tabularnewline
37 & 428 & 421.018407077013 & 6.98159292298722 \tabularnewline
38 & 431 & 428.790158026416 & 2.20984197358404 \tabularnewline
39 & 416 & 419.325030590534 & -3.32503059053442 \tabularnewline
40 & 330 & 353.71740592346 & -23.7174059234605 \tabularnewline
41 & 314 & 332.35026501244 & -18.3502650124404 \tabularnewline
42 & 345 & 374.367175213587 & -29.3671752135871 \tabularnewline
43 & 365 & 351.754565183929 & 13.2454348160711 \tabularnewline
44 & 417 & 396.471689066611 & 20.5283109333887 \tabularnewline
45 & 356 & 382.094796995242 & -26.0947969952421 \tabularnewline
46 & 477 & 415.246178779871 & 61.7538212201288 \tabularnewline
47 & 423 & 449.238656961316 & -26.2386569613162 \tabularnewline
48 & 386 & 391.945056575877 & -5.94505657587736 \tabularnewline
49 & 390 & 394.028806687416 & -4.02880668741567 \tabularnewline
50 & 407 & 396.86701470696 & 10.1329852930402 \tabularnewline
51 & 398 & 379.504543376312 & 18.4954566236884 \tabularnewline
52 & 327 & 354.905451748062 & -27.9054517480624 \tabularnewline
53 & 304 & 332.53024088769 & -28.5302408876896 \tabularnewline
54 & 378 & 367.514033921858 & 10.485966078142 \tabularnewline
55 & 311 & 344.661651095344 & -33.661651095344 \tabularnewline
56 & 376 & 400.827693948914 & -24.8276939489139 \tabularnewline
57 & 340 & 368.886339981014 & -28.8863399810143 \tabularnewline
58 & 383 & 394.51375170316 & -11.5137517031599 \tabularnewline
59 & 467 & 435.986111084393 & 31.0138889156065 \tabularnewline
60 & 439 & 383.952469129439 & 55.0475308705609 \tabularnewline
\hline
\end{tabular}
%Source: https://freestatistics.org/blog/index.php?pk=204566&T=4

[TABLE]
[ROW][C]Multiple Linear Regression - Actuals, Interpolation, and Residuals[/C][/ROW]
[ROW][C]Time or Index[/C][C]Actuals[/C][C]InterpolationForecast[/C][C]ResidualsPrediction Error[/C][/ROW]
[ROW][C]1[/C][C]426[/C][C]404.636217829915[/C][C]21.3637821700848[/C][/ROW]
[ROW][C]2[/C][C]396[/C][C]422.246754497163[/C][C]-26.2467544971627[/C][/ROW]
[ROW][C]3[/C][C]458[/C][C]422.847125292794[/C][C]35.1528747072063[/C][/ROW]
[ROW][C]4[/C][C]315[/C][C]348.660833161214[/C][C]-33.6608331612144[/C][/ROW]
[ROW][C]5[/C][C]337[/C][C]330.589251195282[/C][C]6.41074880471785[/C][/ROW]
[ROW][C]6[/C][C]386[/C][C]382.315027844059[/C][C]3.68497215594094[/C][/ROW]
[ROW][C]7[/C][C]352[/C][C]340.690553247017[/C][C]11.3094467529835[/C][/ROW]
[ROW][C]8[/C][C]384[/C][C]402.821489989768[/C][C]-18.8214899897676[/C][/ROW]
[ROW][C]9[/C][C]439[/C][C]381.161191928063[/C][C]57.8388080719369[/C][/ROW]
[ROW][C]10[/C][C]397[/C][C]414.612540625609[/C][C]-17.6125406256094[/C][/ROW]
[ROW][C]11[/C][C]453[/C][C]461.752039248019[/C][C]-8.75203924801866[/C][/ROW]
[ROW][C]12[/C][C]364[/C][C]404.110645100015[/C][C]-40.1106451000147[/C][/ROW]
[ROW][C]13[/C][C]367[/C][C]404.579813363483[/C][C]-37.5798133634831[/C][/ROW]
[ROW][C]14[/C][C]474[/C][C]416.68150061267[/C][C]57.3184993873302[/C][/ROW]
[ROW][C]15[/C][C]373[/C][C]404.951995827925[/C][C]-31.9519958279247[/C][/ROW]
[ROW][C]16[/C][C]404[/C][C]344.966963695141[/C][C]59.0330363048586[/C][/ROW]
[ROW][C]17[/C][C]385[/C][C]330.758996533859[/C][C]54.2410034661413[/C][/ROW]
[ROW][C]18[/C][C]365[/C][C]372.348152554951[/C][C]-7.34815255495088[/C][/ROW]
[ROW][C]19[/C][C]366[/C][C]335.810026900523[/C][C]30.189973099477[/C][/ROW]
[ROW][C]20[/C][C]421[/C][C]390.364732139623[/C][C]30.6352678603766[/C][/ROW]
[ROW][C]21[/C][C]354[/C][C]361.199557761107[/C][C]-7.19955776110677[/C][/ROW]
[ROW][C]22[/C][C]367[/C][C]385.781940894538[/C][C]-18.7819408945377[/C][/ROW]
[ROW][C]23[/C][C]413[/C][C]429.842085898454[/C][C]-16.8420858984537[/C][/ROW]
[ROW][C]24[/C][C]362[/C][C]372.927433204873[/C][C]-10.9274332048728[/C][/ROW]
[ROW][C]25[/C][C]385[/C][C]371.736755042173[/C][C]13.2632449578267[/C][/ROW]
[ROW][C]26[/C][C]343[/C][C]386.414572156792[/C][C]-43.4145721567918[/C][/ROW]
[ROW][C]27[/C][C]369[/C][C]387.371304912436[/C][C]-18.3713049124356[/C][/ROW]
[ROW][C]28[/C][C]363[/C][C]336.749345472121[/C][C]26.2506545278786[/C][/ROW]
[ROW][C]29[/C][C]318[/C][C]331.771246370729[/C][C]-13.7712463707291[/C][/ROW]
[ROW][C]30[/C][C]393[/C][C]370.455610465545[/C][C]22.544389534455[/C][/ROW]
[ROW][C]31[/C][C]325[/C][C]346.083203573188[/C][C]-21.0832035731876[/C][/ROW]
[ROW][C]32[/C][C]403[/C][C]410.514394855084[/C][C]-7.51439485508391[/C][/ROW]
[ROW][C]33[/C][C]392[/C][C]387.658113334574[/C][C]4.34188666542627[/C][/ROW]
[ROW][C]34[/C][C]409[/C][C]422.845587996822[/C][C]-13.8455879968218[/C][/ROW]
[ROW][C]35[/C][C]485[/C][C]464.181106807818[/C][C]20.818893192182[/C][/ROW]
[ROW][C]36[/C][C]423[/C][C]421.064395989796[/C][C]1.93560401020407[/C][/ROW]
[ROW][C]37[/C][C]428[/C][C]421.018407077013[/C][C]6.98159292298722[/C][/ROW]
[ROW][C]38[/C][C]431[/C][C]428.790158026416[/C][C]2.20984197358404[/C][/ROW]
[ROW][C]39[/C][C]416[/C][C]419.325030590534[/C][C]-3.32503059053442[/C][/ROW]
[ROW][C]40[/C][C]330[/C][C]353.71740592346[/C][C]-23.7174059234605[/C][/ROW]
[ROW][C]41[/C][C]314[/C][C]332.35026501244[/C][C]-18.3502650124404[/C][/ROW]
[ROW][C]42[/C][C]345[/C][C]374.367175213587[/C][C]-29.3671752135871[/C][/ROW]
[ROW][C]43[/C][C]365[/C][C]351.754565183929[/C][C]13.2454348160711[/C][/ROW]
[ROW][C]44[/C][C]417[/C][C]396.471689066611[/C][C]20.5283109333887[/C][/ROW]
[ROW][C]45[/C][C]356[/C][C]382.094796995242[/C][C]-26.0947969952421[/C][/ROW]
[ROW][C]46[/C][C]477[/C][C]415.246178779871[/C][C]61.7538212201288[/C][/ROW]
[ROW][C]47[/C][C]423[/C][C]449.238656961316[/C][C]-26.2386569613162[/C][/ROW]
[ROW][C]48[/C][C]386[/C][C]391.945056575877[/C][C]-5.94505657587736[/C][/ROW]
[ROW][C]49[/C][C]390[/C][C]394.028806687416[/C][C]-4.02880668741567[/C][/ROW]
[ROW][C]50[/C][C]407[/C][C]396.86701470696[/C][C]10.1329852930402[/C][/ROW]
[ROW][C]51[/C][C]398[/C][C]379.504543376312[/C][C]18.4954566236884[/C][/ROW]
[ROW][C]52[/C][C]327[/C][C]354.905451748062[/C][C]-27.9054517480624[/C][/ROW]
[ROW][C]53[/C][C]304[/C][C]332.53024088769[/C][C]-28.5302408876896[/C][/ROW]
[ROW][C]54[/C][C]378[/C][C]367.514033921858[/C][C]10.485966078142[/C][/ROW]
[ROW][C]55[/C][C]311[/C][C]344.661651095344[/C][C]-33.661651095344[/C][/ROW]
[ROW][C]56[/C][C]376[/C][C]400.827693948914[/C][C]-24.8276939489139[/C][/ROW]
[ROW][C]57[/C][C]340[/C][C]368.886339981014[/C][C]-28.8863399810143[/C][/ROW]
[ROW][C]58[/C][C]383[/C][C]394.51375170316[/C][C]-11.5137517031599[/C][/ROW]
[ROW][C]59[/C][C]467[/C][C]435.986111084393[/C][C]31.0138889156065[/C][/ROW]
[ROW][C]60[/C][C]439[/C][C]383.952469129439[/C][C]55.0475308705609[/C][/ROW]
[/TABLE]
Source: https://freestatistics.org/blog/index.php?pk=204566&T=4

Globally Unique Identifier (entire table): ba.freestatistics.org/blog/index.php?pk=204566&T=4

As an alternative you can also use a QR Code:  

The GUIDs for individual cells are displayed in the table below:

Multiple Linear Regression - Actuals, Interpolation, and Residuals
Time or IndexActualsInterpolationForecastResidualsPrediction Error
1426404.63621782991521.3637821700848
2396422.246754497163-26.2467544971627
3458422.84712529279435.1528747072063
4315348.660833161214-33.6608331612144
5337330.5892511952826.41074880471785
6386382.3150278440593.68497215594094
7352340.69055324701711.3094467529835
8384402.821489989768-18.8214899897676
9439381.16119192806357.8388080719369
10397414.612540625609-17.6125406256094
11453461.752039248019-8.75203924801866
12364404.110645100015-40.1106451000147
13367404.579813363483-37.5798133634831
14474416.6815006126757.3184993873302
15373404.951995827925-31.9519958279247
16404344.96696369514159.0330363048586
17385330.75899653385954.2410034661413
18365372.348152554951-7.34815255495088
19366335.81002690052330.189973099477
20421390.36473213962330.6352678603766
21354361.199557761107-7.19955776110677
22367385.781940894538-18.7819408945377
23413429.842085898454-16.8420858984537
24362372.927433204873-10.9274332048728
25385371.73675504217313.2632449578267
26343386.414572156792-43.4145721567918
27369387.371304912436-18.3713049124356
28363336.74934547212126.2506545278786
29318331.771246370729-13.7712463707291
30393370.45561046554522.544389534455
31325346.083203573188-21.0832035731876
32403410.514394855084-7.51439485508391
33392387.6581133345744.34188666542627
34409422.845587996822-13.8455879968218
35485464.18110680781820.818893192182
36423421.0643959897961.93560401020407
37428421.0184070770136.98159292298722
38431428.7901580264162.20984197358404
39416419.325030590534-3.32503059053442
40330353.71740592346-23.7174059234605
41314332.35026501244-18.3502650124404
42345374.367175213587-29.3671752135871
43365351.75456518392913.2454348160711
44417396.47168906661120.5283109333887
45356382.094796995242-26.0947969952421
46477415.24617877987161.7538212201288
47423449.238656961316-26.2386569613162
48386391.945056575877-5.94505657587736
49390394.028806687416-4.02880668741567
50407396.8670147069610.1329852930402
51398379.50454337631218.4954566236884
52327354.905451748062-27.9054517480624
53304332.53024088769-28.5302408876896
54378367.51403392185810.485966078142
55311344.661651095344-33.661651095344
56376400.827693948914-24.8276939489139
57340368.886339981014-28.8863399810143
58383394.51375170316-11.5137517031599
59467435.98611108439331.0138889156065
60439383.95246912943955.0475308705609


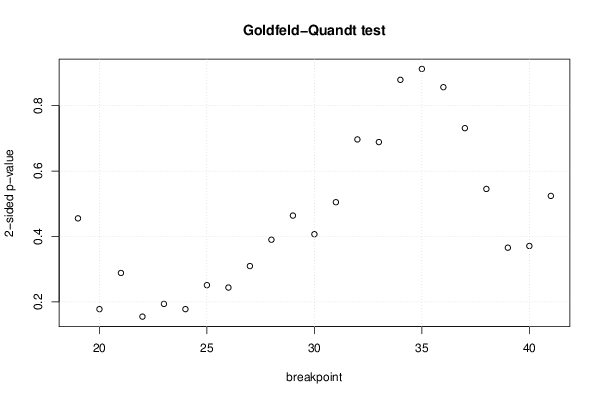
Goldfeld-Quandt test for Heteroskedasticity
p-valuesAlternative Hypothesis
breakpoint indexgreater2-sidedless
190.772257888595830.4554842228083410.22774211140417
200.9109851075683340.1780297848633330.0890148924316665
210.8557358142718530.2885283714562940.144264185728147
220.9224508485360520.1550983029278960.0775491514639478
230.9030140093703090.1939719812593830.0969859906296913
240.9109953264432910.1780093471134170.0890046735567086
250.8743374385749850.2513251228500310.125662561425015
260.8779985203055480.2440029593889030.122001479694452
270.8451636313970460.3096727372059070.154836368602954
280.8049063793778690.3901872412442620.195093620622131
290.7680468323225150.4639063353549710.231953167677485
300.7965242059473980.4069515881052050.203475794052602
310.7476399025705890.5047201948588220.252360097429411
320.651720761862370.696558476275260.34827923813763
330.6557352991104840.6885294017790320.344264700889516
340.560652979923440.878694040153120.43934702007656
350.5440327727865550.9119344544268890.455967227213445
360.4280857351294990.8561714702589990.571914264870501
370.3654811450908150.7309622901816310.634518854909185
380.272661667742710.5453233354854210.727338332257289
390.1829038176266290.3658076352532570.817096182373371
400.1855373510117870.3710747020235740.814462648988213
410.2619900107470.5239800214940.738009989253

\begin{tabular}{lllllllll}
\hline
Goldfeld-Quandt test for Heteroskedasticity \tabularnewline
p-values & Alternative Hypothesis \tabularnewline
breakpoint index & greater & 2-sided & less \tabularnewline
19 & 0.77225788859583 & 0.455484222808341 & 0.22774211140417 \tabularnewline
20 & 0.910985107568334 & 0.178029784863333 & 0.0890148924316665 \tabularnewline
21 & 0.855735814271853 & 0.288528371456294 & 0.144264185728147 \tabularnewline
22 & 0.922450848536052 & 0.155098302927896 & 0.0775491514639478 \tabularnewline
23 & 0.903014009370309 & 0.193971981259383 & 0.0969859906296913 \tabularnewline
24 & 0.910995326443291 & 0.178009347113417 & 0.0890046735567086 \tabularnewline
25 & 0.874337438574985 & 0.251325122850031 & 0.125662561425015 \tabularnewline
26 & 0.877998520305548 & 0.244002959388903 & 0.122001479694452 \tabularnewline
27 & 0.845163631397046 & 0.309672737205907 & 0.154836368602954 \tabularnewline
28 & 0.804906379377869 & 0.390187241244262 & 0.195093620622131 \tabularnewline
29 & 0.768046832322515 & 0.463906335354971 & 0.231953167677485 \tabularnewline
30 & 0.796524205947398 & 0.406951588105205 & 0.203475794052602 \tabularnewline
31 & 0.747639902570589 & 0.504720194858822 & 0.252360097429411 \tabularnewline
32 & 0.65172076186237 & 0.69655847627526 & 0.34827923813763 \tabularnewline
33 & 0.655735299110484 & 0.688529401779032 & 0.344264700889516 \tabularnewline
34 & 0.56065297992344 & 0.87869404015312 & 0.43934702007656 \tabularnewline
35 & 0.544032772786555 & 0.911934454426889 & 0.455967227213445 \tabularnewline
36 & 0.428085735129499 & 0.856171470258999 & 0.571914264870501 \tabularnewline
37 & 0.365481145090815 & 0.730962290181631 & 0.634518854909185 \tabularnewline
38 & 0.27266166774271 & 0.545323335485421 & 0.727338332257289 \tabularnewline
39 & 0.182903817626629 & 0.365807635253257 & 0.817096182373371 \tabularnewline
40 & 0.185537351011787 & 0.371074702023574 & 0.814462648988213 \tabularnewline
41 & 0.261990010747 & 0.523980021494 & 0.738009989253 \tabularnewline
\hline
\end{tabular}
%Source: https://freestatistics.org/blog/index.php?pk=204566&T=5

[TABLE]
[ROW][C]Goldfeld-Quandt test for Heteroskedasticity[/C][/ROW]
[ROW][C]p-values[/C][C]Alternative Hypothesis[/C][/ROW]
[ROW][C]breakpoint index[/C][C]greater[/C][C]2-sided[/C][C]less[/C][/ROW]
[ROW][C]19[/C][C]0.77225788859583[/C][C]0.455484222808341[/C][C]0.22774211140417[/C][/ROW]
[ROW][C]20[/C][C]0.910985107568334[/C][C]0.178029784863333[/C][C]0.0890148924316665[/C][/ROW]
[ROW][C]21[/C][C]0.855735814271853[/C][C]0.288528371456294[/C][C]0.144264185728147[/C][/ROW]
[ROW][C]22[/C][C]0.922450848536052[/C][C]0.155098302927896[/C][C]0.0775491514639478[/C][/ROW]
[ROW][C]23[/C][C]0.903014009370309[/C][C]0.193971981259383[/C][C]0.0969859906296913[/C][/ROW]
[ROW][C]24[/C][C]0.910995326443291[/C][C]0.178009347113417[/C][C]0.0890046735567086[/C][/ROW]
[ROW][C]25[/C][C]0.874337438574985[/C][C]0.251325122850031[/C][C]0.125662561425015[/C][/ROW]
[ROW][C]26[/C][C]0.877998520305548[/C][C]0.244002959388903[/C][C]0.122001479694452[/C][/ROW]
[ROW][C]27[/C][C]0.845163631397046[/C][C]0.309672737205907[/C][C]0.154836368602954[/C][/ROW]
[ROW][C]28[/C][C]0.804906379377869[/C][C]0.390187241244262[/C][C]0.195093620622131[/C][/ROW]
[ROW][C]29[/C][C]0.768046832322515[/C][C]0.463906335354971[/C][C]0.231953167677485[/C][/ROW]
[ROW][C]30[/C][C]0.796524205947398[/C][C]0.406951588105205[/C][C]0.203475794052602[/C][/ROW]
[ROW][C]31[/C][C]0.747639902570589[/C][C]0.504720194858822[/C][C]0.252360097429411[/C][/ROW]
[ROW][C]32[/C][C]0.65172076186237[/C][C]0.69655847627526[/C][C]0.34827923813763[/C][/ROW]
[ROW][C]33[/C][C]0.655735299110484[/C][C]0.688529401779032[/C][C]0.344264700889516[/C][/ROW]
[ROW][C]34[/C][C]0.56065297992344[/C][C]0.87869404015312[/C][C]0.43934702007656[/C][/ROW]
[ROW][C]35[/C][C]0.544032772786555[/C][C]0.911934454426889[/C][C]0.455967227213445[/C][/ROW]
[ROW][C]36[/C][C]0.428085735129499[/C][C]0.856171470258999[/C][C]0.571914264870501[/C][/ROW]
[ROW][C]37[/C][C]0.365481145090815[/C][C]0.730962290181631[/C][C]0.634518854909185[/C][/ROW]
[ROW][C]38[/C][C]0.27266166774271[/C][C]0.545323335485421[/C][C]0.727338332257289[/C][/ROW]
[ROW][C]39[/C][C]0.182903817626629[/C][C]0.365807635253257[/C][C]0.817096182373371[/C][/ROW]
[ROW][C]40[/C][C]0.185537351011787[/C][C]0.371074702023574[/C][C]0.814462648988213[/C][/ROW]
[ROW][C]41[/C][C]0.261990010747[/C][C]0.523980021494[/C][C]0.738009989253[/C][/ROW]
[/TABLE]
Source: https://freestatistics.org/blog/index.php?pk=204566&T=5

Globally Unique Identifier (entire table): ba.freestatistics.org/blog/index.php?pk=204566&T=5

As an alternative you can also use a QR Code:  

The GUIDs for individual cells are displayed in the table below:

Goldfeld-Quandt test for Heteroskedasticity
p-valuesAlternative Hypothesis
breakpoint indexgreater2-sidedless
190.772257888595830.4554842228083410.22774211140417
200.9109851075683340.1780297848633330.0890148924316665
210.8557358142718530.2885283714562940.144264185728147
220.9224508485360520.1550983029278960.0775491514639478
230.9030140093703090.1939719812593830.0969859906296913
240.9109953264432910.1780093471134170.0890046735567086
250.8743374385749850.2513251228500310.125662561425015
260.8779985203055480.2440029593889030.122001479694452
270.8451636313970460.3096727372059070.154836368602954
280.8049063793778690.3901872412442620.195093620622131
290.7680468323225150.4639063353549710.231953167677485
300.7965242059473980.4069515881052050.203475794052602
310.7476399025705890.5047201948588220.252360097429411
320.651720761862370.696558476275260.34827923813763
330.6557352991104840.6885294017790320.344264700889516
340.560652979923440.878694040153120.43934702007656
350.5440327727865550.9119344544268890.455967227213445
360.4280857351294990.8561714702589990.571914264870501
370.3654811450908150.7309622901816310.634518854909185
380.272661667742710.5453233354854210.727338332257289
390.1829038176266290.3658076352532570.817096182373371
400.1855373510117870.3710747020235740.814462648988213
410.2619900107470.5239800214940.738009989253


Meta Analysis of Goldfeld-Quandt test for Heteroskedasticity
Description# significant tests% significant testsOK/NOK
1% type I error level00OK
5% type I error level00OK
10% type I error level00OK

\begin{tabular}{lllllllll}
\hline
Meta Analysis of Goldfeld-Quandt test for Heteroskedasticity \tabularnewline
Description & # significant tests & % significant tests & OK/NOK \tabularnewline
1% type I error level & 0 & 0 & OK \tabularnewline
5% type I error level & 0 & 0 & OK \tabularnewline
10% type I error level & 0 & 0 & OK \tabularnewline
\hline
\end{tabular}
%Source: https://freestatistics.org/blog/index.php?pk=204566&T=6

[TABLE]
[ROW][C]Meta Analysis of Goldfeld-Quandt test for Heteroskedasticity[/C][/ROW]
[ROW][C]Description[/C][C]# significant tests[/C][C]% significant tests[/C][C]OK/NOK[/C][/ROW]
[ROW][C]1% type I error level[/C][C]0[/C][C]0[/C][C]OK[/C][/ROW]
[ROW][C]5% type I error level[/C][C]0[/C][C]0[/C][C]OK[/C][/ROW]
[ROW][C]10% type I error level[/C][C]0[/C][C]0[/C][C]OK[/C][/ROW]
[/TABLE]
Source: https://freestatistics.org/blog/index.php?pk=204566&T=6

Globally Unique Identifier (entire table): ba.freestatistics.org/blog/index.php?pk=204566&T=6

As an alternative you can also use a QR Code:  

The GUIDs for individual cells are displayed in the table below:

Meta Analysis of Goldfeld-Quandt test for Heteroskedasticity
Description# significant tests% significant testsOK/NOK
1% type I error level00OK
5% type I error level00OK
10% type I error level00OK


Parameters (Session):
par1 = 1 ; par2 = Include Monthly Dummies ; par3 = No Linear Trend ;
Parameters (R input):
par1 = 1 ; par2 = Include Monthly Dummies ; par3 = No Linear Trend ;
R code (references can be found in the software module):
library(lattice)
library(lmtest)
n25 <- 25 #minimum number of obs. for Goldfeld-Quandt test
par1 <- as.numeric(par1)
x <- t(y)
k <- length(x[1,])
n <- length(x[,1])
x1 <- cbind(x[,par1], x[,1:k!=par1])
mycolnames <- c(colnames(x)[par1], colnames(x)[1:k!=par1])
colnames(x1) <- mycolnames #colnames(x)[par1]
x <- x1
if (par3 == 'First Differences'){
x2 <- array(0, dim=c(n-1,k), dimnames=list(1:(n-1), paste('(1-B)',colnames(x),sep='')))
for (i in 1:n-1) {
for (j in 1:k) {
x2[i,j] <- x[i+1,j] - x[i,j]
}
}
x <- x2
}
if (par2 == 'Include Monthly Dummies'){
x2 <- array(0, dim=c(n,11), dimnames=list(1:n, paste('M', seq(1:11), sep ='')))
for (i in 1:11){
x2[seq(i,n,12),i] <- 1
}
x <- cbind(x, x2)
}
if (par2 == 'Include Quarterly Dummies'){
x2 <- array(0, dim=c(n,3), dimnames=list(1:n, paste('Q', seq(1:3), sep ='')))
for (i in 1:3){
x2[seq(i,n,4),i] <- 1
}
x <- cbind(x, x2)
}
k <- length(x[1,])
if (par3 == 'Linear Trend'){
x <- cbind(x, c(1:n))
colnames(x)[k+1] <- 't'
}
x
k <- length(x[1,])
df <- as.data.frame(x)
(mylm <- lm(df))
(mysum <- summary(mylm))
if (n > n25) {
kp3 <- k + 3
nmkm3 <- n - k - 3
gqarr <- array(NA, dim=c(nmkm3-kp3+1,3))
numgqtests <- 0
numsignificant1 <- 0
numsignificant5 <- 0
numsignificant10 <- 0
for (mypoint in kp3:nmkm3) {
j <- 0
numgqtests <- numgqtests + 1
for (myalt in c('greater', 'two.sided', 'less')) {
j <- j + 1
gqarr[mypoint-kp3+1,j] <- gqtest(mylm, point=mypoint, alternative=myalt)$p.value
}
if (gqarr[mypoint-kp3+1,2] < 0.01) numsignificant1 <- numsignificant1 + 1
if (gqarr[mypoint-kp3+1,2] < 0.05) numsignificant5 <- numsignificant5 + 1
if (gqarr[mypoint-kp3+1,2] < 0.10) numsignificant10 <- numsignificant10 + 1
}
gqarr
}
bitmap(file='test0.png')
plot(x[,1], type='l', main='Actuals and Interpolation', ylab='value of Actuals and Interpolation (dots)', xlab='time or index')
points(x[,1]-mysum$resid)
grid()
dev.off()
bitmap(file='test1.png')
plot(mysum$resid, type='b', pch=19, main='Residuals', ylab='value of Residuals', xlab='time or index')
grid()
dev.off()
bitmap(file='test2.png')
hist(mysum$resid, main='Residual Histogram', xlab='values of Residuals')
grid()
dev.off()
bitmap(file='test3.png')
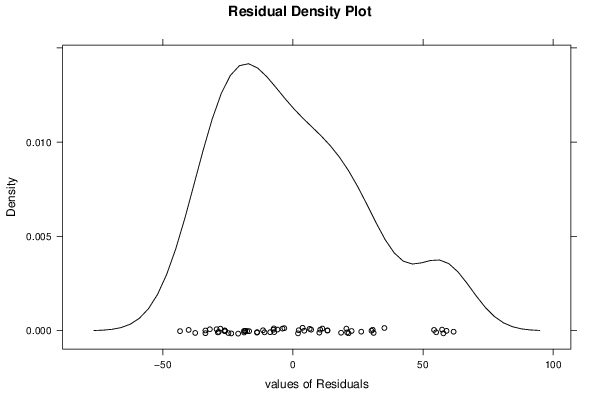
densityplot(~mysum$resid,col='black',main='Residual Density Plot', xlab='values of Residuals')
dev.off()
bitmap(file='test4.png')
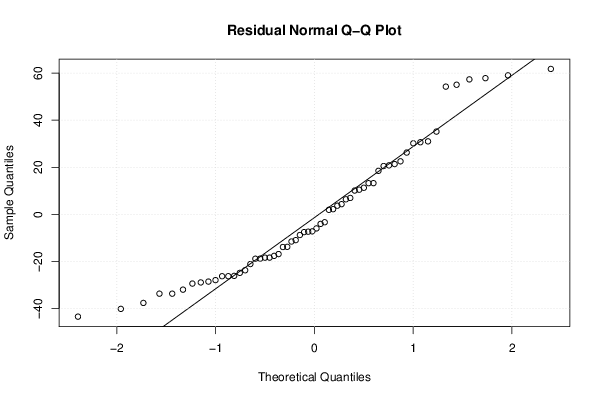
qqnorm(mysum$resid, main='Residual Normal Q-Q Plot')
qqline(mysum$resid)
grid()
dev.off()
(myerror <- as.ts(mysum$resid))
bitmap(file='test5.png')
dum <- cbind(lag(myerror,k=1),myerror)
dum
dum1 <- dum[2:length(myerror),]
dum1
z <- as.data.frame(dum1)
z
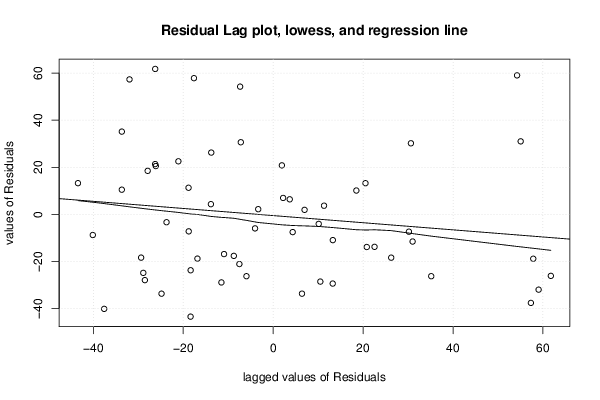
plot(z,main=paste('Residual Lag plot, lowess, and regression line'), ylab='values of Residuals', xlab='lagged values of Residuals')
lines(lowess(z))
abline(lm(z))
grid()
dev.off()
bitmap(file='test6.png')
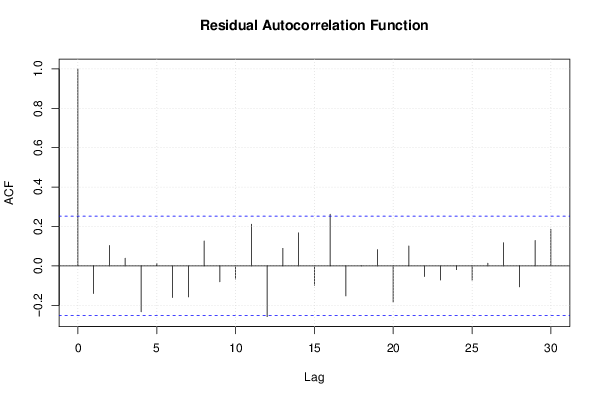
acf(mysum$resid, lag.max=length(mysum$resid)/2, main='Residual Autocorrelation Function')
grid()
dev.off()
bitmap(file='test7.png')
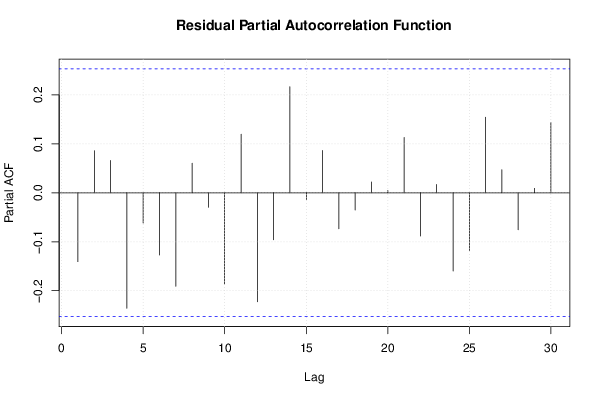
pacf(mysum$resid, lag.max=length(mysum$resid)/2, main='Residual Partial Autocorrelation Function')
grid()
dev.off()
bitmap(file='test8.png')
opar <- par(mfrow = c(2,2), oma = c(0, 0, 1.1, 0))
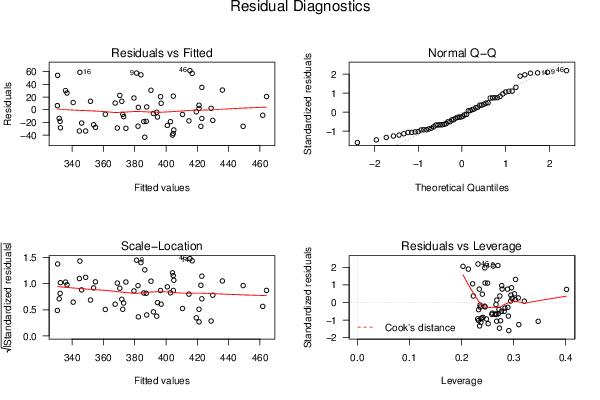
plot(mylm, las = 1, sub='Residual Diagnostics')
par(opar)
dev.off()
if (n > n25) {
bitmap(file='test9.png')
plot(kp3:nmkm3,gqarr[,2], main='Goldfeld-Quandt test',ylab='2-sided p-value',xlab='breakpoint')
grid()
dev.off()
}
load(file='createtable')
a<-table.start()
a<-table.row.start(a)
a<-table.element(a, 'Multiple Linear Regression - Estimated Regression Equation', 1, TRUE)
a<-table.row.end(a)
myeq <- colnames(x)[1]
myeq <- paste(myeq, '[t] = ', sep='')
for (i in 1:k){
if (mysum$coefficients[i,1] > 0) myeq <- paste(myeq, '+', '')
myeq <- paste(myeq, mysum$coefficients[i,1], sep=' ')
if (rownames(mysum$coefficients)[i] != '(Intercept)') {
myeq <- paste(myeq, rownames(mysum$coefficients)[i], sep='')
if (rownames(mysum$coefficients)[i] != 't') myeq <- paste(myeq, '[t]', sep='')
}
}
myeq <- paste(myeq, ' + e[t]')
a<-table.row.start(a)
a<-table.element(a, myeq)
a<-table.row.end(a)
a<-table.end(a)
table.save(a,file='mytable1.tab')
a<-table.start()
a<-table.row.start(a)
a<-table.element(a,hyperlink('ols1.htm','Multiple Linear Regression - Ordinary Least Squares',''), 6, TRUE)
a<-table.row.end(a)
a<-table.row.start(a)
a<-table.element(a,'Variable',header=TRUE)
a<-table.element(a,'Parameter',header=TRUE)
a<-table.element(a,'S.D.',header=TRUE)
a<-table.element(a,'T-STAT
H0: parameter = 0',header=TRUE)
a<-table.element(a,'2-tail p-value',header=TRUE)
a<-table.element(a,'1-tail p-value',header=TRUE)
a<-table.row.end(a)
for (i in 1:k){
a<-table.row.start(a)
a<-table.element(a,rownames(mysum$coefficients)[i],header=TRUE)
a<-table.element(a,mysum$coefficients[i,1])
a<-table.element(a, round(mysum$coefficients[i,2],6))
a<-table.element(a, round(mysum$coefficients[i,3],4))
a<-table.element(a, round(mysum$coefficients[i,4],6))
a<-table.element(a, round(mysum$coefficients[i,4]/2,6))
a<-table.row.end(a)
}
a<-table.end(a)
table.save(a,file='mytable2.tab')
a<-table.start()
a<-table.row.start(a)
a<-table.element(a, 'Multiple Linear Regression - Regression Statistics', 2, TRUE)
a<-table.row.end(a)
a<-table.row.start(a)
a<-table.element(a, 'Multiple R',1,TRUE)
a<-table.element(a, sqrt(mysum$r.squared))
a<-table.row.end(a)
a<-table.row.start(a)
a<-table.element(a, 'R-squared',1,TRUE)
a<-table.element(a, mysum$r.squared)
a<-table.row.end(a)
a<-table.row.start(a)
a<-table.element(a, 'Adjusted R-squared',1,TRUE)
a<-table.element(a, mysum$adj.r.squared)
a<-table.row.end(a)
a<-table.row.start(a)
a<-table.element(a, 'F-TEST (value)',1,TRUE)
a<-table.element(a, mysum$fstatistic[1])
a<-table.row.end(a)
a<-table.row.start(a)
a<-table.element(a, 'F-TEST (DF numerator)',1,TRUE)
a<-table.element(a, mysum$fstatistic[2])
a<-table.row.end(a)
a<-table.row.start(a)
a<-table.element(a, 'F-TEST (DF denominator)',1,TRUE)
a<-table.element(a, mysum$fstatistic[3])
a<-table.row.end(a)
a<-table.row.start(a)
a<-table.element(a, 'p-value',1,TRUE)
a<-table.element(a, 1-pf(mysum$fstatistic[1],mysum$fstatistic[2],mysum$fstatistic[3]))
a<-table.row.end(a)
a<-table.row.start(a)
a<-table.element(a, 'Multiple Linear Regression - Residual Statistics', 2, TRUE)
a<-table.row.end(a)
a<-table.row.start(a)
a<-table.element(a, 'Residual Standard Deviation',1,TRUE)
a<-table.element(a, mysum$sigma)
a<-table.row.end(a)
a<-table.row.start(a)
a<-table.element(a, 'Sum Squared Residuals',1,TRUE)
a<-table.element(a, sum(myerror*myerror))
a<-table.row.end(a)
a<-table.end(a)
table.save(a,file='mytable3.tab')
a<-table.start()
a<-table.row.start(a)
a<-table.element(a, 'Multiple Linear Regression - Actuals, Interpolation, and Residuals', 4, TRUE)
a<-table.row.end(a)
a<-table.row.start(a)
a<-table.element(a, 'Time or Index', 1, TRUE)
a<-table.element(a, 'Actuals', 1, TRUE)
a<-table.element(a, 'Interpolation
Forecast', 1, TRUE)
a<-table.element(a, 'Residuals
Prediction Error', 1, TRUE)
a<-table.row.end(a)
for (i in 1:n) {
a<-table.row.start(a)
a<-table.element(a,i, 1, TRUE)
a<-table.element(a,x[i])
a<-table.element(a,x[i]-mysum$resid[i])
a<-table.element(a,mysum$resid[i])
a<-table.row.end(a)
}
a<-table.end(a)
table.save(a,file='mytable4.tab')
if (n > n25) {
a<-table.start()
a<-table.row.start(a)
a<-table.element(a,'Goldfeld-Quandt test for Heteroskedasticity',4,TRUE)
a<-table.row.end(a)
a<-table.row.start(a)
a<-table.element(a,'p-values',header=TRUE)
a<-table.element(a,'Alternative Hypothesis',3,header=TRUE)
a<-table.row.end(a)
a<-table.row.start(a)
a<-table.element(a,'breakpoint index',header=TRUE)
a<-table.element(a,'greater',header=TRUE)
a<-table.element(a,'2-sided',header=TRUE)
a<-table.element(a,'less',header=TRUE)
a<-table.row.end(a)
for (mypoint in kp3:nmkm3) {
a<-table.row.start(a)
a<-table.element(a,mypoint,header=TRUE)
a<-table.element(a,gqarr[mypoint-kp3+1,1])
a<-table.element(a,gqarr[mypoint-kp3+1,2])
a<-table.element(a,gqarr[mypoint-kp3+1,3])
a<-table.row.end(a)
}
a<-table.end(a)
table.save(a,file='mytable5.tab')
a<-table.start()
a<-table.row.start(a)
a<-table.element(a,'Meta Analysis of Goldfeld-Quandt test for Heteroskedasticity',4,TRUE)
a<-table.row.end(a)
a<-table.row.start(a)
a<-table.element(a,'Description',header=TRUE)
a<-table.element(a,'# significant tests',header=TRUE)
a<-table.element(a,'% significant tests',header=TRUE)
a<-table.element(a,'OK/NOK',header=TRUE)
a<-table.row.end(a)
a<-table.row.start(a)
a<-table.element(a,'1% type I error level',header=TRUE)
a<-table.element(a,numsignificant1)
a<-table.element(a,numsignificant1/numgqtests)
if (numsignificant1/numgqtests < 0.01) dum <- 'OK' else dum <- 'NOK'
a<-table.element(a,dum)
a<-table.row.end(a)
a<-table.row.start(a)
a<-table.element(a,'5% type I error level',header=TRUE)
a<-table.element(a,numsignificant5)
a<-table.element(a,numsignificant5/numgqtests)
if (numsignificant5/numgqtests < 0.05) dum <- 'OK' else dum <- 'NOK'
a<-table.element(a,dum)
a<-table.row.end(a)
a<-table.row.start(a)
a<-table.element(a,'10% type I error level',header=TRUE)
a<-table.element(a,numsignificant10)
a<-table.element(a,numsignificant10/numgqtests)
if (numsignificant10/numgqtests < 0.1) dum <- 'OK' else dum <- 'NOK'
a<-table.element(a,dum)
a<-table.row.end(a)
a<-table.end(a)
table.save(a,file='mytable6.tab')
}