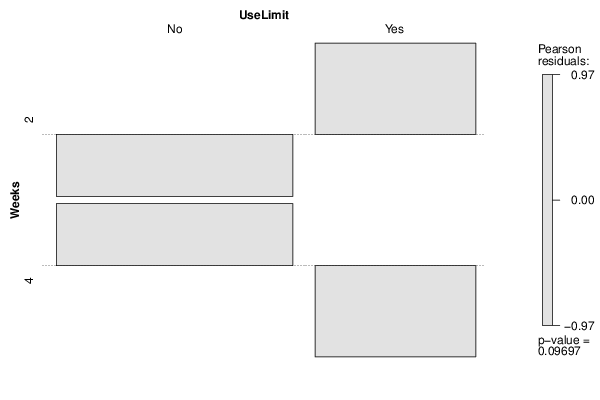
| Tabulation of Results | ||
| Weeks x UseLimit | ||
| No | Yes | 2 | 42 | 26 | 4 | 51 | 17 |
| Tabulation of Expected Results | ||
| Weeks x UseLimit | ||
| No | Yes | 2 | 46.5 | 21.5 | 4 | 46.5 | 21.5 |
| Statistical Results | |
| Pearson's Chi-squared test with Yates' continuity correction | |
| Pearson Chi Square Statistic | 2.18 |
| Degrees of Freedom | 1 |
| P value | 0.14 |