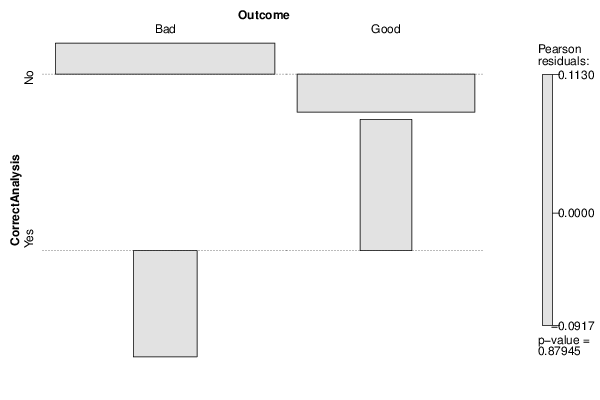
| Tabulation of Results | ||
| CorrectAnalysis x Outcome | ||
| Bad | Good | No | 86 | 56 | Yes | 7 | 5 |
| Tabulation of Expected Results | ||
| CorrectAnalysis x Outcome | ||
| Bad | Good | No | 85.75 | 56.25 | Yes | 7.25 | 4.75 |
| Statistical Results | |
| Pearson's Chi-squared test with simulated p-value (based on 2000 replicates) | |
| Exact Pearson Chi Square Statistic | 0.02 |
| P value | 1 |