| Tabulation of Results | ||
| T40 x CorrectAnalysis | ||
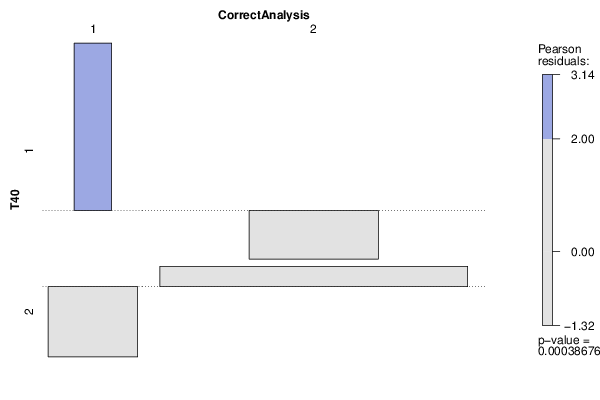
| 1 | 2 | 1 | 6 | 17 | 2 | 6 | 125 |
| Tabulation of Expected Results | ||
| T40 x CorrectAnalysis | ||
| 1 | 2 | 1 | 1.79 | 21.21 | 2 | 10.21 | 120.79 |
| Statistical Results | |
| Pearson's Chi-squared test with Yates' continuity correction | |
| Pearson Chi Square Statistic | 9.78 |
| Degrees of Freedom | 1 |
| P value | 0 |