| Tabulation of Results | ||
| T40 x CorrectAnalysis | ||
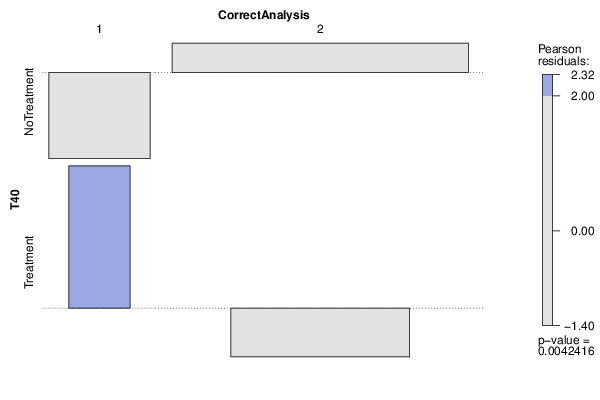
| 1 | 2 | NoTreatment | 3 | 60 | Treatment | 6 | 17 |
| Tabulation of Expected Results | ||
| T40 x CorrectAnalysis | ||
| 1 | 2 | NoTreatment | 6.59 | 56.41 | Treatment | 2.41 | 20.59 |
| Statistical Results | |
| Pearson's Chi-squared test with Yates' continuity correction | |
| Pearson Chi Square Statistic | 6.06 |
| Degrees of Freedom | 1 |
| P value | 0.01 |