| Tabulation of Results | ||
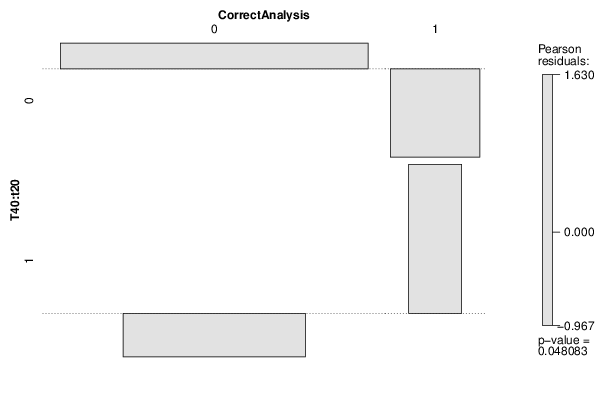
| T40:t20 x CorrectAnalysis | ||
| 0 | 1 | 0 | 108 | 6 | 1 | 34 | 6 |
| Tabulation of Expected Results | ||
| T40:t20 x CorrectAnalysis | ||
| 0 | 1 | 0 | 105.12 | 8.88 | 1 | 36.88 | 3.12 |
| Statistical Results | |
| Pearson's Chi-squared test with Yates' continuity correction | |
| Pearson Chi Square Statistic | 2.67 |
| Degrees of Freedom | 1 |
| P value | 0.1 |