| Tabulation of Results | |||
| Geslacht x Kleur | |||
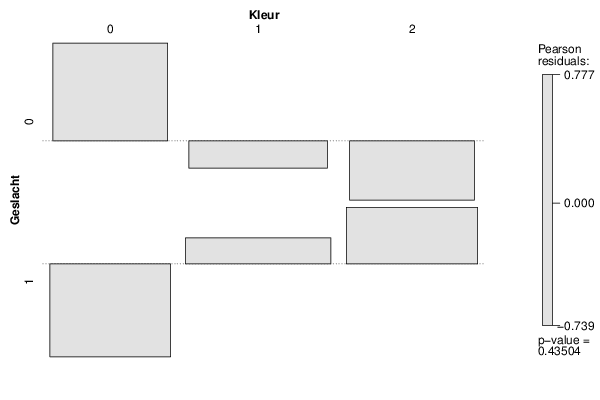
| 0 | 1 | 2 | 0 | 7 | 7 | 5 | 1 | 4 | 9 | 8 |
| Tabulation of Expected Results | |||
| Geslacht x Kleur | |||
| 0 | 1 | 2 | 0 | 5.22 | 7.6 | 6.17 | 1 | 5.78 | 8.4 | 6.83 |
| Statistical Results | |
| Pearson's Chi-squared test | |
| Pearson Chi Square Statistic | 1.66 |
| Degrees of Freedom | 2 |
| P value | 0.44 |