| Tabulation of Results | |||||
| pre x post2 | |||||
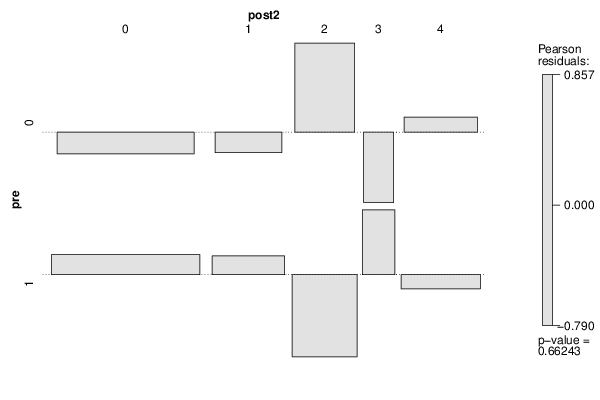
| 0 | 1 | 2 | 3 | 4 | 0 | 9 | 2 | 3 | 0 | 3 | 1 | 12 | 3 | 1 | 1 | 3 |
| Tabulation of Expected Results | |||||
| pre x post2 | |||||
| 0 | 1 | 2 | 3 | 4 | 0 | 9.65 | 2.3 | 1.84 | 0.46 | 2.76 | 1 | 11.35 | 2.7 | 2.16 | 0.54 | 3.24 |
| Statistical Results | |
| Pearson's Chi-squared test | |
| Pearson Chi Square Statistic | 2.4 |
| Degrees of Freedom | 4 |
| P value | 0.66 |