| Multiple Linear Regression - Estimated Regression Equation |
| IQ[t] = + 100.668495405294 + 2.66163763544096Geslacht[t] + 9.45933342477026Gewest1[t] + 4.61665066520368Gewest2[t] + e[t] |
| Multiple Linear Regression - Ordinary Least Squares | |||||
| Variable | Parameter | S.D. | T-STAT H0: parameter = 0 | 2-tail p-value | 1-tail p-value |
| (Intercept) | 100.668495405294 | 3.512906 | 28.6568 | 0 | 0 |
| Geslacht | 2.66163763544096 | 3.510605 | 0.7582 | 0.453284 | 0.226642 |
| Gewest1 | 9.45933342477026 | 4.308356 | 2.1956 | 0.034651 | 0.017326 |
| Gewest2 | 4.61665066520368 | 4.533756 | 1.0183 | 0.315338 | 0.157669 |
| Multiple Linear Regression - Regression Statistics | |
| Multiple R | 0.381306098353126 |
| R-squared | 0.145394340641284 |
| Adjusted R-squared | 0.0741772023613911 |
| F-TEST (value) | 2.04156392903439 |
| F-TEST (DF numerator) | 3 |
| F-TEST (DF denominator) | 36 |
| p-value | 0.125360174487121 |
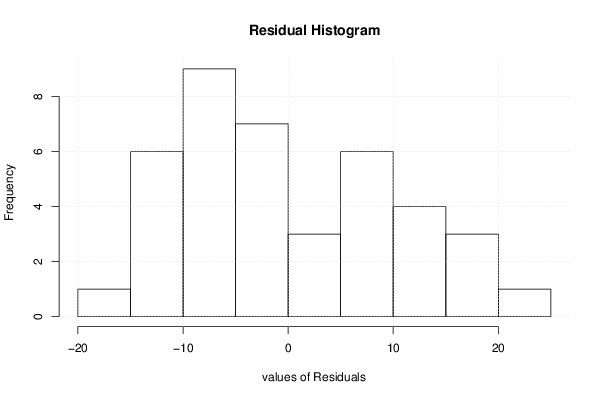
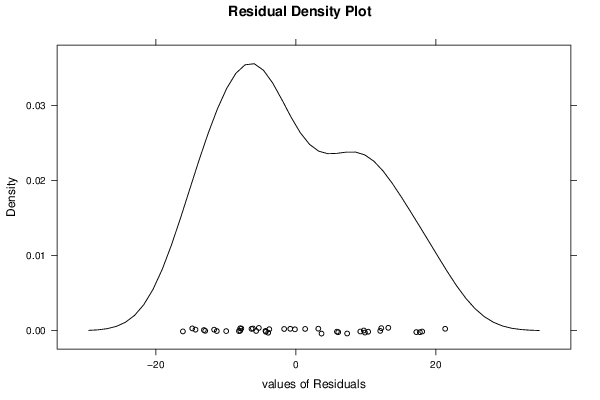
| Multiple Linear Regression - Residual Statistics | |
| Residual Standard Deviation | 10.8544580549029 |
| Sum Squared Residuals | 4241.49334796324 |
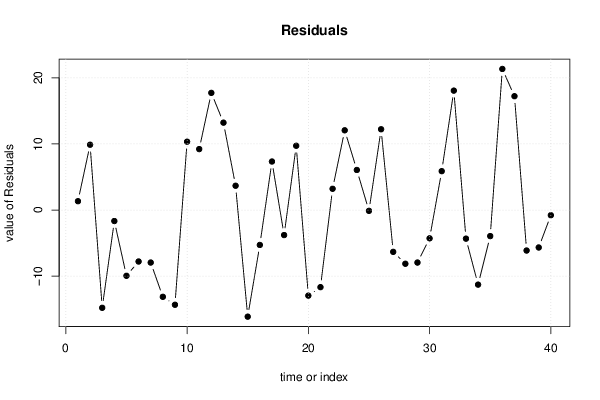
| Multiple Linear Regression - Actuals, Interpolation, and Residuals | |||
| Time or Index | Actuals | Interpolation Forecast | Residuals Prediction Error |
| 1 | 102 | 100.668495405294 | 1.33150459470577 |
| 2 | 120 | 110.127828830064 | 9.87217116993554 |
| 3 | 98 | 112.789466465505 | -14.7894664655054 |
| 4 | 99 | 100.668495405294 | -1.6684954052942 |
| 5 | 98 | 107.946783705939 | -9.94678370593883 |
| 6 | 105 | 112.789466465505 | -7.78946646550542 |
| 7 | 100 | 107.946783705939 | -7.94678370593883 |
| 8 | 97 | 110.127828830064 | -13.1278288300645 |
| 9 | 89 | 103.330133040735 | -14.3301330407352 |
| 10 | 111 | 100.668495405294 | 10.3315045947058 |
| 11 | 122 | 112.789466465505 | 9.21053353449458 |
| 12 | 123 | 105.285146070498 | 17.7148539295021 |
| 13 | 126 | 112.789466465505 | 13.2105335344946 |
| 14 | 107 | 103.330133040735 | 3.66986695926485 |
| 15 | 94 | 110.127828830064 | -16.1278288300645 |
| 16 | 100 | 105.285146070498 | -5.28514607049787 |
| 17 | 108 | 100.668495405294 | 7.3315045947058 |
| 18 | 109 | 112.789466465505 | -3.78946646550542 |
| 19 | 115 | 105.285146070498 | 9.71485392950213 |
| 20 | 95 | 107.946783705939 | -12.9467837059388 |
| 21 | 89 | 100.668495405294 | -11.6684954052942 |
| 22 | 116 | 112.789466465505 | 3.21053353449458 |
| 23 | 120 | 107.946783705939 | 12.0532162940612 |
| 24 | 114 | 107.946783705939 | 6.05321629406117 |
| 25 | 110 | 110.127828830064 | -0.127828830064462 |
| 26 | 125 | 112.789466465505 | 12.2105335344946 |
| 27 | 97 | 103.330133040735 | -6.33013304073515 |
| 28 | 102 | 110.127828830064 | -8.12782883006446 |
| 29 | 100 | 107.946783705939 | -7.94678370593883 |
| 30 | 101 | 105.285146070498 | -4.28514607049787 |
| 31 | 116 | 110.127828830064 | 5.87217116993554 |
| 32 | 126 | 107.946783705939 | 18.0532162940612 |
| 33 | 99 | 103.330133040735 | -4.33013304073515 |
| 34 | 94 | 105.285146070498 | -11.2851460704979 |
| 35 | 104 | 107.946783705939 | -3.94678370593883 |
| 36 | 122 | 100.668495405294 | 21.3315045947058 |
| 37 | 130 | 112.789466465505 | 17.2105335344946 |
| 38 | 104 | 110.127828830064 | -6.12782883006446 |
| 39 | 95 | 100.668495405294 | -5.6684954052942 |
| 40 | 112 | 112.789466465505 | -0.789466465505416 |
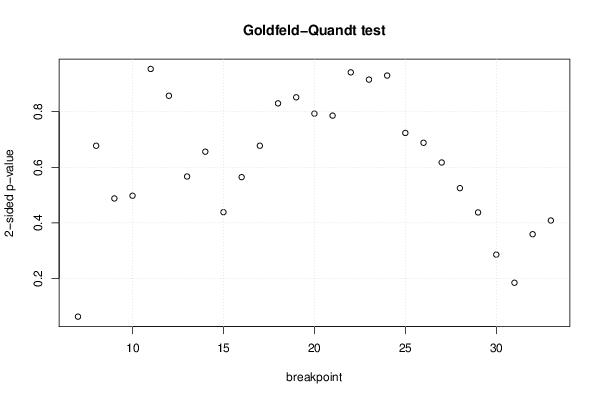
| Goldfeld-Quandt test for Heteroskedasticity | |||
| p-values | Alternative Hypothesis | ||
| breakpoint index | greater | 2-sided | less |
| 7 | 0.031520278804382 | 0.0630405576087639 | 0.968479721195618 |
| 8 | 0.338781407067116 | 0.677562814134231 | 0.661218592932884 |
| 9 | 0.244004161036837 | 0.488008322073675 | 0.755995838963163 |
| 10 | 0.248919167255205 | 0.49783833451041 | 0.751080832744795 |
| 11 | 0.476850782447726 | 0.953701564895452 | 0.523149217552274 |
| 12 | 0.571345970731389 | 0.857308058537221 | 0.428654029268611 |
| 13 | 0.71649929183885 | 0.5670014163223 | 0.28350070816115 |
| 14 | 0.671912810317451 | 0.656174379365098 | 0.328087189682549 |
| 15 | 0.780666891136139 | 0.438666217727721 | 0.219333108863861 |
| 16 | 0.717667789766054 | 0.564664420467891 | 0.282332210233946 |
| 17 | 0.661189048795208 | 0.677621902409583 | 0.338810951204792 |
| 18 | 0.585040157537257 | 0.829919684925486 | 0.414959842462743 |
| 19 | 0.574138549581347 | 0.851722900837306 | 0.425861450418653 |
| 20 | 0.603478122014617 | 0.793043755970766 | 0.396521877985383 |
| 21 | 0.607069657920771 | 0.785860684158457 | 0.392930342079229 |
| 22 | 0.529265630721444 | 0.941468738557111 | 0.470734369278556 |
| 23 | 0.542263401010293 | 0.915473197979413 | 0.457736598989707 |
| 24 | 0.464958686289969 | 0.929917372579938 | 0.535041313710031 |
| 25 | 0.361799062050474 | 0.723598124100947 | 0.638200937949526 |
| 26 | 0.344117883893886 | 0.688235767787772 | 0.655882116106114 |
| 27 | 0.308667836440661 | 0.617335672881322 | 0.691332163559339 |
| 28 | 0.262560552104404 | 0.525121104208809 | 0.737439447895596 |
| 29 | 0.218858625709271 | 0.437717251418542 | 0.781141374290729 |
| 30 | 0.143036795319135 | 0.286073590638269 | 0.856963204680865 |
| 31 | 0.0924739387275173 | 0.184947877455035 | 0.907526061272483 |
| 32 | 0.179722041332311 | 0.359444082664622 | 0.820277958667689 |
| 33 | 0.204387807649911 | 0.408775615299821 | 0.79561219235009 |
| Meta Analysis of Goldfeld-Quandt test for Heteroskedasticity | |||
| Description | # significant tests | % significant tests | OK/NOK |
| 1% type I error level | 0 | 0 | OK |
| 5% type I error level | 0 | 0 | OK |
| 10% type I error level | 1 | 0.037037037037037 | OK |