| Tabulation of Results | ||
| stats x correctanalysis | ||
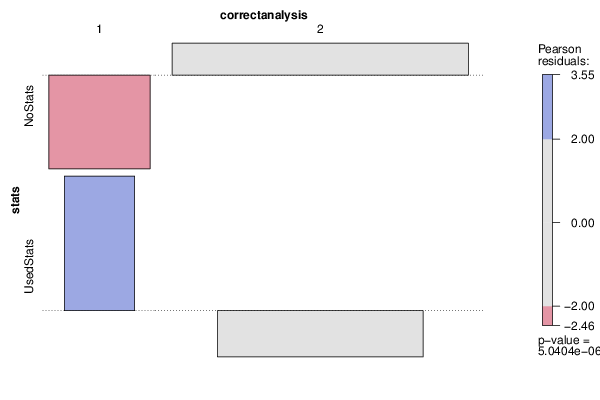
| 1 | 2 | NoStats | 0 | 58 | UsedStats | 9 | 19 |
| Tabulation of Expected Results | ||
| stats x correctanalysis | ||
| 1 | 2 | NoStats | 6.07 | 51.93 | UsedStats | 2.93 | 25.07 |
| Statistical Results | |
| Pearson's Chi-squared test with simulated p-value (based on 2000 replicates) | |
| Chi Square Statistic | 20.82 |
| P value | 0 |