Free Statistics
of Irreproducible Research!
Description of Statistical Computation | |||||||||||||||||||||||||||||||||||||||||||||||||||||||||||||||||||||||||||||||||||||||||||||||||
|---|---|---|---|---|---|---|---|---|---|---|---|---|---|---|---|---|---|---|---|---|---|---|---|---|---|---|---|---|---|---|---|---|---|---|---|---|---|---|---|---|---|---|---|---|---|---|---|---|---|---|---|---|---|---|---|---|---|---|---|---|---|---|---|---|---|---|---|---|---|---|---|---|---|---|---|---|---|---|---|---|---|---|---|---|---|---|---|---|---|---|---|---|---|---|---|---|---|
| Author's title | |||||||||||||||||||||||||||||||||||||||||||||||||||||||||||||||||||||||||||||||||||||||||||||||||
| Author | *The author of this computation has been verified* | ||||||||||||||||||||||||||||||||||||||||||||||||||||||||||||||||||||||||||||||||||||||||||||||||
| R Software Module | rwasp_chi_squared_tests.wasp | ||||||||||||||||||||||||||||||||||||||||||||||||||||||||||||||||||||||||||||||||||||||||||||||||
| Title produced by software | Chi-Squared Test, McNemar Test, and Fisher Exact Test | ||||||||||||||||||||||||||||||||||||||||||||||||||||||||||||||||||||||||||||||||||||||||||||||||
| Date of computation | Fri, 21 Dec 2012 17:01:05 -0500 | ||||||||||||||||||||||||||||||||||||||||||||||||||||||||||||||||||||||||||||||||||||||||||||||||
| Cite this page as follows | Statistical Computations at FreeStatistics.org, Office for Research Development and Education, URL https://freestatistics.org/blog/index.php?v=date/2012/Dec/21/t13561273251lugxackuortelp.htm/, Retrieved Tue, 16 Apr 2024 13:11:05 +0000 | ||||||||||||||||||||||||||||||||||||||||||||||||||||||||||||||||||||||||||||||||||||||||||||||||
| Statistical Computations at FreeStatistics.org, Office for Research Development and Education, URL https://freestatistics.org/blog/index.php?pk=204334, Retrieved Tue, 16 Apr 2024 13:11:05 +0000 | |||||||||||||||||||||||||||||||||||||||||||||||||||||||||||||||||||||||||||||||||||||||||||||||||
| QR Codes: | |||||||||||||||||||||||||||||||||||||||||||||||||||||||||||||||||||||||||||||||||||||||||||||||||
|
| |||||||||||||||||||||||||||||||||||||||||||||||||||||||||||||||||||||||||||||||||||||||||||||||||
| Original text written by user: | |||||||||||||||||||||||||||||||||||||||||||||||||||||||||||||||||||||||||||||||||||||||||||||||||
| IsPrivate? | No (this computation is public) | ||||||||||||||||||||||||||||||||||||||||||||||||||||||||||||||||||||||||||||||||||||||||||||||||
| User-defined keywords | |||||||||||||||||||||||||||||||||||||||||||||||||||||||||||||||||||||||||||||||||||||||||||||||||
| Estimated Impact | 86 | ||||||||||||||||||||||||||||||||||||||||||||||||||||||||||||||||||||||||||||||||||||||||||||||||
Tree of Dependent Computations | |||||||||||||||||||||||||||||||||||||||||||||||||||||||||||||||||||||||||||||||||||||||||||||||||
| Family? (F = Feedback message, R = changed R code, M = changed R Module, P = changed Parameters, D = changed Data) | |||||||||||||||||||||||||||||||||||||||||||||||||||||||||||||||||||||||||||||||||||||||||||||||||
| - [Chi-Squared and McNemar Tests] [] [2010-11-16 14:37:52] [b98453cac15ba1066b407e146608df68] - R P [Chi-Squared Test, McNemar Test, and Fisher Exact Test] [paper deel 2 chi ...] [2012-12-14 14:04:25] [97c624f8202925579dccb4f50bae925c] - P [Chi-Squared Test, McNemar Test, and Fisher Exact Test] [paper deel 2 exac...] [2012-12-14 14:22:53] [97c624f8202925579dccb4f50bae925c] - PD [Chi-Squared Test, McNemar Test, and Fisher Exact Test] [paper deel 5 chi ...] [2012-12-20 15:34:48] [74be16979710d4c4e7c6647856088456] - [Chi-Squared Test, McNemar Test, and Fisher Exact Test] [Paper deel 5 Chi ...] [2012-12-20 16:43:38] [783d8509970888a6ec44a5a7a0d2a339] - P [Chi-Squared Test, McNemar Test, and Fisher Exact Test] [Paper: deel 5] [2012-12-21 22:01:05] [bc573787f42e47ef4ac463240ca6f4b1] [Current] | |||||||||||||||||||||||||||||||||||||||||||||||||||||||||||||||||||||||||||||||||||||||||||||||||
| Feedback Forum | |||||||||||||||||||||||||||||||||||||||||||||||||||||||||||||||||||||||||||||||||||||||||||||||||
Post a new message | |||||||||||||||||||||||||||||||||||||||||||||||||||||||||||||||||||||||||||||||||||||||||||||||||
Dataset | |||||||||||||||||||||||||||||||||||||||||||||||||||||||||||||||||||||||||||||||||||||||||||||||||
| Dataseries X: | |||||||||||||||||||||||||||||||||||||||||||||||||||||||||||||||||||||||||||||||||||||||||||||||||
4 'Yes' 1 NA 'NoStats' 2 'No' 'Good' 4 'No' 2 NA 'NoStats' 2 'No' 'Bad' 4 'No' 2 NA 'NoStats' 2 'No' 'Bad' 4 'No' 2 NA 'NoStats' 2 'No' 'Bad' 4 'No' 2 NA 'NoStats' 2 'No' 'Bad' 4 'Yes' 2 NA 'NoStats' 2 'Yes' 'Good' 4 'No' 2 NA 'NoStats' 2 'No' 'Bad' 4 'No' 1 NA 'NoStats' 2 'No' 'Bad' 4 'No' 2 NA 'NoStats' 2 'No' 'Good' 4 'Yes' 2 NA 'NoStats' 2 'No' 'Bad' 4 'Yes' 1 NA 'NoStats' 2 'No' 'Bad' 4 'No' 2 NA 'NoStats' 2 'No' 'Bad' 4 'No' 2 NA 'UsedStats' 2 'Yes' 'Bad' 4 'Yes' 1 NA 'NoStats' 2 'No' 'Bad' 4 'No' 2 NA 'UsedStats' 2 'Yes' 'Good' 4 'No' 1 NA 'UsedStats' 2 'Yes' 'Good' 4 'Yes' 1 NA 'UsedStats' 1 'Yes' 'Bad' 4 'Yes' 1 NA 'NoStats' 2 'No' 'Bad' 4 'No' 2 NA 'NoStats' 2 'No' 'Good' 4 'No' 1 NA 'UsedStats' 1 'Yes' 'Good' 4 'Yes' 2 NA 'NoStats' 2 'Yes' 'Bad' 4 'Yes' 2 NA 'UsedStats' 2 'Yes' 'Good' 4 'No' 2 NA 'NoStats' 2 'Yes' 'Good' 4 'Yes' 2 NA 'NoStats' 2 'Yes' 'Good' 4 'No' 1 NA 'UsedStats' 2 'No' 'Good' 4 'No' 2 NA 'UsedStats' 2 'Yes' 'Bad' 4 'Yes' 2 NA 'NoStats' 2 'No' 'Good' 4 'No' 2 NA 'UsedStats' 2 'No' 'Bad' 4 'No' 2 NA 'NoStats' 2 'No' 'Good' 4 'No' 2 NA 'NoStats' 2 'Yes' 'Bad' 4 'No' 2 NA 'NoStats' 2 'No' 'Bad' 4 'Yes' 2 NA 'NoStats' 2 'No' 'Bad' 4 'Yes' 2 NA 'NoStats' 2 'Yes' 'Bad' 4 'No' 1 NA 'NoStats' 2 'No' 'Good' 4 'No' 2 NA 'NoStats' 2 'No' 'Bad' 4 'No' 2 NA 'NoStats' 2 'No' 'Bad' 4 'Yes' 1 NA 'UsedStats' 2 'Yes' 'Bad' 4 'No' 2 NA 'UsedStats' 2 'No' 'Good' 4 'No' 2 NA 'NoStats' 2 'Yes' 'Good' 4 'No' 1 NA 'NoStats' 2 'Yes' 'Bad' 4 'No' 2 NA 'UsedStats' 1 'Yes' 'Good' 4 'No' 2 NA 'UsedStats' 2 'No' 'Good' 4 'Yes' 2 NA 'NoStats' 2 'Yes' 'Good' 4 'Yes' 1 NA 'NoStats' 2 'No' 'Bad' 4 'No' 2 NA 'NoStats' 2 'Yes' 'Bad' 4 'No' 2 NA 'NoStats' 2 'Yes' 'Good' 4 'No' 2 NA 'NoStats' 2 'No' 'Bad' 4 'No' 2 NA 'NoStats' 2 'No' 'Good' 4 'No' 2 NA 'NoStats' 2 'Yes' 'Good' 4 'No' 2 NA 'NoStats' 2 'No' 'Bad' 4 'No' 1 NA 'UsedStats' 2 'No' 'Bad' 4 'Yes' 1 NA 'UsedStats' 1 'Yes' 'Bad' 4 'No' 2 NA 'NoStats' 2 'No' 'Good' 4 'No' 2 NA 'UsedStats' 1 'No' 'Bad' 4 'No' 2 NA 'NoStats' 2 'No' 'Bad' 4 'No' 1 NA 'UsedStats' 2 'No' 'Good' 4 'No' 2 NA 'UsedStats' 2 'Yes' 'Good' 4 'No' 2 NA 'NoStats' 2 'No' 'Good' 4 'No' 2 NA 'NoStats' 2 'No' 'Good' 4 'Yes' 1 NA 'UsedStats' 1 'Yes' 'Good' 4 'Yes' 1 NA 'NoStats' 2 'No' 'Good' 4 'No' 2 NA 'UsedStats' 2 'Yes' 'Bad' 4 'No' 2 NA 'NoStats' 2 'No' 'Bad' 4 'Yes' 1 NA 'NoStats' 2 'No' 'Good' 4 'No' 2 NA 'NoStats' 2 'No' 'Bad' 4 'No' 2 NA 'NoStats' 2 'No' 'Bad' 4 'No' 1 NA 'UsedStats' 1 'Yes' 'Bad' 4 'Yes' 2 NA 'NoStats' 2 'No' 'Bad' 4 'No' 2 NA 'NoStats' 2 'No' 'Good' 4 'No' 2 NA 'UsedStats' 2 'No' 'Bad' 4 'No' 2 NA 'NoStats' 2 'No' 'Bad' 4 'No' 2 NA 'NoStats' 2 'No' 'Good' 4 'No' 2 NA 'UsedStats' 2 'No' 'Good' 4 'Yes' 2 NA 'UsedStats' 2 'No' 'Bad' 4 'No' 2 NA 'NoStats' 2 'No' 'Good' 4 'No' 1 NA 'NoStats' 2 'Yes' 'Good' 4 'No' 2 NA 'NoStats' 2 'No' 'Good' 4 'No' 2 NA 'UsedStats' 2 'Yes' 'Good' 4 'No' 1 NA 'UsedStats' 1 'No' 'Good' 4 'No' 1 NA 'NoStats' 2 'Yes' 'Bad' 4 'No' 2 NA 'NoStats' 2 'No' 'Bad' 4 'Yes' 2 NA 'UsedStats' 2 'No' 'Good' 4 'No' 2 NA 'NoStats' 2 'No' 'Bad' 4 'No' 2 NA 'UsedStats' 1 'No' 'Bad' 4 'No' 2 NA 'NoStats' 2 'Yes' 'Good' 4 'Yes' 2 NA 'NoStats' 2 'No' 'Bad' | |||||||||||||||||||||||||||||||||||||||||||||||||||||||||||||||||||||||||||||||||||||||||||||||||
Tables (Output of Computation) | |||||||||||||||||||||||||||||||||||||||||||||||||||||||||||||||||||||||||||||||||||||||||||||||||
| |||||||||||||||||||||||||||||||||||||||||||||||||||||||||||||||||||||||||||||||||||||||||||||||||
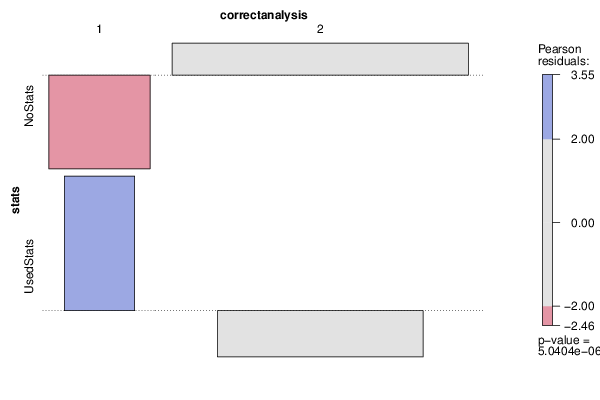
Figures (Output of Computation) | |||||||||||||||||||||||||||||||||||||||||||||||||||||||||||||||||||||||||||||||||||||||||||||||||
Input Parameters & R Code | |||||||||||||||||||||||||||||||||||||||||||||||||||||||||||||||||||||||||||||||||||||||||||||||||
| Parameters (Session): | |||||||||||||||||||||||||||||||||||||||||||||||||||||||||||||||||||||||||||||||||||||||||||||||||
| par1 = 5 ; par2 = 6 ; par3 = Exact Pearson Chi-Squared by Simulation ; | |||||||||||||||||||||||||||||||||||||||||||||||||||||||||||||||||||||||||||||||||||||||||||||||||
| Parameters (R input): | |||||||||||||||||||||||||||||||||||||||||||||||||||||||||||||||||||||||||||||||||||||||||||||||||
| par1 = 5 ; par2 = 6 ; par3 = Exact Pearson Chi-Squared by Simulation ; | |||||||||||||||||||||||||||||||||||||||||||||||||||||||||||||||||||||||||||||||||||||||||||||||||
| R code (references can be found in the software module): | |||||||||||||||||||||||||||||||||||||||||||||||||||||||||||||||||||||||||||||||||||||||||||||||||
library(vcd) | |||||||||||||||||||||||||||||||||||||||||||||||||||||||||||||||||||||||||||||||||||||||||||||||||