Free Statistics

of Irreproducible Research!

Author's title

Author*The author of this computation has been verified*
R Software Modulerwasp_arimaforecasting.wasp
Title produced by softwareARIMA Forecasting
Date of computationFri, 21 Dec 2012 15:44:11 -0500
Cite this page as followsStatistical Computations at FreeStatistics.org, Office for Research Development and Education, URL https://freestatistics.org/blog/index.php?v=date/2012/Dec/21/t1356122673lp3f4p01rfflsly.htm/, Retrieved Thu, 18 Apr 2024 08:58:29 +0000
Statistical Computations at FreeStatistics.org, Office for Research Development and Education, URL https://freestatistics.org/blog/index.php?pk=204261, Retrieved Thu, 18 Apr 2024 08:58:29 +0000
QR Codes:

Original text written by user:
IsPrivate?No (this computation is public)
User-defined keywords
Estimated Impact84
Family? (F = Feedback message, R = changed R code, M = changed R Module, P = changed Parameters, D = changed Data)
-     [ARIMA Forecasting] [gold Arima] [2011-12-22 10:55:25] [26f9350dcf28f408b6e37deed68b781e]
- R  D    [ARIMA Forecasting] [arima forecast] [2012-12-21 20:44:11] [3d604e7f846c7f85ca2541c807d08ff8] [Current]
Feedback Forum

Post a new message
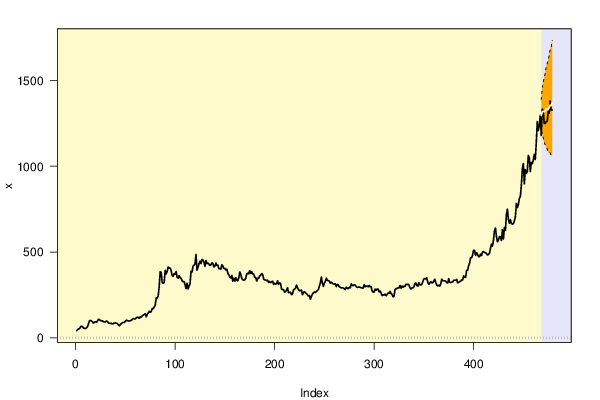
Dataseries X:
41
48
52
53
65
68
64
57
55
54
59
66
83
100
101
98
92
85
92
94
90
99
108
106
99
100
99
93
92
93
98
95
86
85
83
85
80
84
86
87
85
83
76
70
78
83
88
90
90
97
102
101
98
98
100
102
108
112
110
110
117
120
119
113
123
120
129
132
136
141
122
137
145
155
148
153
172
169
180
190
233
231
245
299
385
381
322
317
323
393
372
387
413
405
407
392
363
358
375
370
386
353
347
363
350
347
333
327
328
309
286
319
285
301
315
388
383
417
423
430
486
394
411
431
447
432
457
453
441
416
451
432
436
429
421
425
437
432
413
419
436
421
424
402
403
400
426
418
403
405
394
400
376
367
354
348
364
329
348
330
351
336
332
349
384
370
346
338
335
338
347
372
376
373
392
374
385
372
372
352
353
330
348
346
361
364
375
369
342
338
337
333
336
322
329
322
325
331
311
318
312
315
333
311
321
316
284
281
280
266
268
278
292
263
265
266
251
256
280
283
289
308
293
281
274
277
278
250
265
269
262
258
251
243
247
224
241
255
261
267
264
270
275
281
301
321
355
319
299
319
328
348
335
333
331
318
325
318
313
313
315
298
311
309
297
294
291
292
290
287
281
295
289
286
295
291
315
306
304
309
307
299
294
295
296
294
292
290
289
310
297
301
302
297
305
298
299
273
267
266
284
276
284
285
267
273
262
246
251
248
255
245
251
261
259
271
258
253
239
241
281
285
289
290
290
305
289
302
294
301
299
312
310
312
309
292
284
290
292
297
316
320
304
301
322
309
308
311
328
343
345
342
350
322
311
319
328
320
321
331
342
322
307
302
307
301
315
342
333
332
332
330
322
319
345
324
322
325
325
335
335
335
341
320
324
328
329
338
336
361
353
352
393
393
420
435
468
466
481
511
508
480
496
487
473
473
488
479
501
503
497
496
490
482
486
493
522
546
534
570
624
640
589
559
570
590
588
566
630
576
642
626
718
750
690
667
689
666
662
666
681
705
783
758
776
812
824
887
984
1016
897
980
957
969
1063
1048
968
1022
1014
1035
1069
1038
1133
1260
1207
1235
1297
1179
1332
1323
1248
1248
1260
1260
1317
1308
1380
1327
1327


Summary of computational transaction
Raw Inputview raw input (R code)
Raw Outputview raw output of R engine
Computing time2 seconds
R Server'Gwilym Jenkins' @ jenkins.wessa.net

\begin{tabular}{lllllllll}
\hline
Summary of computational transaction \tabularnewline
Raw Input & view raw input (R code)  \tabularnewline
Raw Output & view raw output of R engine  \tabularnewline
Computing time & 2 seconds \tabularnewline
R Server & 'Gwilym Jenkins' @ jenkins.wessa.net \tabularnewline
\hline
\end{tabular}
%Source: https://freestatistics.org/blog/index.php?pk=204261&T=0

[TABLE]
[ROW][C]Summary of computational transaction[/C][/ROW]
[ROW][C]Raw Input[/C][C]view raw input (R code) [/C][/ROW]
[ROW][C]Raw Output[/C][C]view raw output of R engine [/C][/ROW]
[ROW][C]Computing time[/C][C]2 seconds[/C][/ROW]
[ROW][C]R Server[/C][C]'Gwilym Jenkins' @ jenkins.wessa.net[/C][/ROW]
[/TABLE]
Source: https://freestatistics.org/blog/index.php?pk=204261&T=0

Globally Unique Identifier (entire table): ba.freestatistics.org/blog/index.php?pk=204261&T=0

As an alternative you can also use a QR Code:  

The GUIDs for individual cells are displayed in the table below:

Summary of computational transaction
Raw Inputview raw input (R code)
Raw Outputview raw output of R engine
Computing time2 seconds
R Server'Gwilym Jenkins' @ jenkins.wessa.net


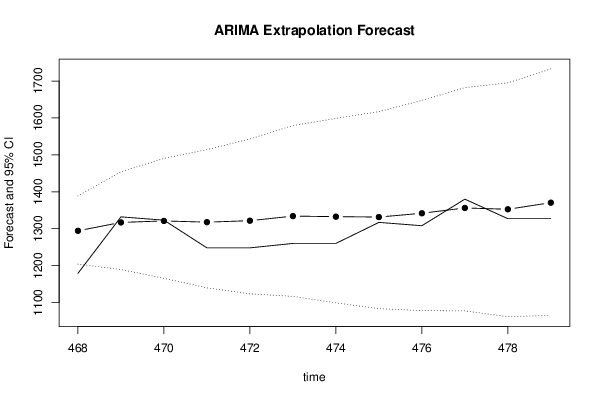
Univariate ARIMA Extrapolation Forecast
timeY[t]F[t]95% LB95% UBp-value(H0: Y[t] = F[t])P(F[t]>Y[t-1])P(F[t]>Y[t-s])P(F[t]>Y[467])
4551063-------
4561048-------
457968-------
4581022-------
4591014-------
4601035-------
4611069-------
4621038-------
4631133-------
4641260-------
4651207-------
4661235-------
4671297-------
46811791294.21241204.0991388.94370.00860.47710.477
46913321316.91231189.22621453.89880.41450.975810.6121
47013231320.9411165.47821490.36890.49050.44910.99970.6091
47112481317.66061139.6771514.2440.24370.47880.99880.5816
47212481321.59311123.36261543.09970.25750.74250.99440.5861
47312601334.03081116.58931579.50780.27720.75390.98280.6163
47412601332.54181099.02451598.7520.29660.70340.98490.6032
47513171331.49841083.14561617.20270.46040.68810.91340.5935
47613081341.70381077.97281647.58370.41450.56290.69970.6127
47713801356.16521077.14571682.21810.4430.61390.81510.639
47813271352.51261061.57661695.12990.4420.43750.74930.6246
47913271370.47651064.8151732.81620.4070.5930.65450.6545

\begin{tabular}{lllllllll}
\hline
Univariate ARIMA Extrapolation Forecast \tabularnewline
time & Y[t] & F[t] & 95% LB & 95% UB & p-value(H0: Y[t] = F[t]) & P(F[t]>Y[t-1]) & P(F[t]>Y[t-s]) & P(F[t]>Y[467]) \tabularnewline
455 & 1063 & - & - & - & - & - & - & - \tabularnewline
456 & 1048 & - & - & - & - & - & - & - \tabularnewline
457 & 968 & - & - & - & - & - & - & - \tabularnewline
458 & 1022 & - & - & - & - & - & - & - \tabularnewline
459 & 1014 & - & - & - & - & - & - & - \tabularnewline
460 & 1035 & - & - & - & - & - & - & - \tabularnewline
461 & 1069 & - & - & - & - & - & - & - \tabularnewline
462 & 1038 & - & - & - & - & - & - & - \tabularnewline
463 & 1133 & - & - & - & - & - & - & - \tabularnewline
464 & 1260 & - & - & - & - & - & - & - \tabularnewline
465 & 1207 & - & - & - & - & - & - & - \tabularnewline
466 & 1235 & - & - & - & - & - & - & - \tabularnewline
467 & 1297 & - & - & - & - & - & - & - \tabularnewline
468 & 1179 & 1294.2124 & 1204.099 & 1388.9437 & 0.0086 & 0.477 & 1 & 0.477 \tabularnewline
469 & 1332 & 1316.9123 & 1189.2262 & 1453.8988 & 0.4145 & 0.9758 & 1 & 0.6121 \tabularnewline
470 & 1323 & 1320.941 & 1165.4782 & 1490.3689 & 0.4905 & 0.4491 & 0.9997 & 0.6091 \tabularnewline
471 & 1248 & 1317.6606 & 1139.677 & 1514.244 & 0.2437 & 0.4788 & 0.9988 & 0.5816 \tabularnewline
472 & 1248 & 1321.5931 & 1123.3626 & 1543.0997 & 0.2575 & 0.7425 & 0.9944 & 0.5861 \tabularnewline
473 & 1260 & 1334.0308 & 1116.5893 & 1579.5078 & 0.2772 & 0.7539 & 0.9828 & 0.6163 \tabularnewline
474 & 1260 & 1332.5418 & 1099.0245 & 1598.752 & 0.2966 & 0.7034 & 0.9849 & 0.6032 \tabularnewline
475 & 1317 & 1331.4984 & 1083.1456 & 1617.2027 & 0.4604 & 0.6881 & 0.9134 & 0.5935 \tabularnewline
476 & 1308 & 1341.7038 & 1077.9728 & 1647.5837 & 0.4145 & 0.5629 & 0.6997 & 0.6127 \tabularnewline
477 & 1380 & 1356.1652 & 1077.1457 & 1682.2181 & 0.443 & 0.6139 & 0.8151 & 0.639 \tabularnewline
478 & 1327 & 1352.5126 & 1061.5766 & 1695.1299 & 0.442 & 0.4375 & 0.7493 & 0.6246 \tabularnewline
479 & 1327 & 1370.4765 & 1064.815 & 1732.8162 & 0.407 & 0.593 & 0.6545 & 0.6545 \tabularnewline
\hline
\end{tabular}
%Source: https://freestatistics.org/blog/index.php?pk=204261&T=1

[TABLE]
[ROW][C]Univariate ARIMA Extrapolation Forecast[/C][/ROW]
[ROW][C]time[/C][C]Y[t][/C][C]F[t][/C][C]95% LB[/C][C]95% UB[/C][C]p-value(H0: Y[t] = F[t])[/C][C]P(F[t]>Y[t-1])[/C][C]P(F[t]>Y[t-s])[/C][C]P(F[t]>Y[467])[/C][/ROW]
[ROW][C]455[/C][C]1063[/C][C]-[/C][C]-[/C][C]-[/C][C]-[/C][C]-[/C][C]-[/C][C]-[/C][/ROW]
[ROW][C]456[/C][C]1048[/C][C]-[/C][C]-[/C][C]-[/C][C]-[/C][C]-[/C][C]-[/C][C]-[/C][/ROW]
[ROW][C]457[/C][C]968[/C][C]-[/C][C]-[/C][C]-[/C][C]-[/C][C]-[/C][C]-[/C][C]-[/C][/ROW]
[ROW][C]458[/C][C]1022[/C][C]-[/C][C]-[/C][C]-[/C][C]-[/C][C]-[/C][C]-[/C][C]-[/C][/ROW]
[ROW][C]459[/C][C]1014[/C][C]-[/C][C]-[/C][C]-[/C][C]-[/C][C]-[/C][C]-[/C][C]-[/C][/ROW]
[ROW][C]460[/C][C]1035[/C][C]-[/C][C]-[/C][C]-[/C][C]-[/C][C]-[/C][C]-[/C][C]-[/C][/ROW]
[ROW][C]461[/C][C]1069[/C][C]-[/C][C]-[/C][C]-[/C][C]-[/C][C]-[/C][C]-[/C][C]-[/C][/ROW]
[ROW][C]462[/C][C]1038[/C][C]-[/C][C]-[/C][C]-[/C][C]-[/C][C]-[/C][C]-[/C][C]-[/C][/ROW]
[ROW][C]463[/C][C]1133[/C][C]-[/C][C]-[/C][C]-[/C][C]-[/C][C]-[/C][C]-[/C][C]-[/C][/ROW]
[ROW][C]464[/C][C]1260[/C][C]-[/C][C]-[/C][C]-[/C][C]-[/C][C]-[/C][C]-[/C][C]-[/C][/ROW]
[ROW][C]465[/C][C]1207[/C][C]-[/C][C]-[/C][C]-[/C][C]-[/C][C]-[/C][C]-[/C][C]-[/C][/ROW]
[ROW][C]466[/C][C]1235[/C][C]-[/C][C]-[/C][C]-[/C][C]-[/C][C]-[/C][C]-[/C][C]-[/C][/ROW]
[ROW][C]467[/C][C]1297[/C][C]-[/C][C]-[/C][C]-[/C][C]-[/C][C]-[/C][C]-[/C][C]-[/C][/ROW]
[ROW][C]468[/C][C]1179[/C][C]1294.2124[/C][C]1204.099[/C][C]1388.9437[/C][C]0.0086[/C][C]0.477[/C][C]1[/C][C]0.477[/C][/ROW]
[ROW][C]469[/C][C]1332[/C][C]1316.9123[/C][C]1189.2262[/C][C]1453.8988[/C][C]0.4145[/C][C]0.9758[/C][C]1[/C][C]0.6121[/C][/ROW]
[ROW][C]470[/C][C]1323[/C][C]1320.941[/C][C]1165.4782[/C][C]1490.3689[/C][C]0.4905[/C][C]0.4491[/C][C]0.9997[/C][C]0.6091[/C][/ROW]
[ROW][C]471[/C][C]1248[/C][C]1317.6606[/C][C]1139.677[/C][C]1514.244[/C][C]0.2437[/C][C]0.4788[/C][C]0.9988[/C][C]0.5816[/C][/ROW]
[ROW][C]472[/C][C]1248[/C][C]1321.5931[/C][C]1123.3626[/C][C]1543.0997[/C][C]0.2575[/C][C]0.7425[/C][C]0.9944[/C][C]0.5861[/C][/ROW]
[ROW][C]473[/C][C]1260[/C][C]1334.0308[/C][C]1116.5893[/C][C]1579.5078[/C][C]0.2772[/C][C]0.7539[/C][C]0.9828[/C][C]0.6163[/C][/ROW]
[ROW][C]474[/C][C]1260[/C][C]1332.5418[/C][C]1099.0245[/C][C]1598.752[/C][C]0.2966[/C][C]0.7034[/C][C]0.9849[/C][C]0.6032[/C][/ROW]
[ROW][C]475[/C][C]1317[/C][C]1331.4984[/C][C]1083.1456[/C][C]1617.2027[/C][C]0.4604[/C][C]0.6881[/C][C]0.9134[/C][C]0.5935[/C][/ROW]
[ROW][C]476[/C][C]1308[/C][C]1341.7038[/C][C]1077.9728[/C][C]1647.5837[/C][C]0.4145[/C][C]0.5629[/C][C]0.6997[/C][C]0.6127[/C][/ROW]
[ROW][C]477[/C][C]1380[/C][C]1356.1652[/C][C]1077.1457[/C][C]1682.2181[/C][C]0.443[/C][C]0.6139[/C][C]0.8151[/C][C]0.639[/C][/ROW]
[ROW][C]478[/C][C]1327[/C][C]1352.5126[/C][C]1061.5766[/C][C]1695.1299[/C][C]0.442[/C][C]0.4375[/C][C]0.7493[/C][C]0.6246[/C][/ROW]
[ROW][C]479[/C][C]1327[/C][C]1370.4765[/C][C]1064.815[/C][C]1732.8162[/C][C]0.407[/C][C]0.593[/C][C]0.6545[/C][C]0.6545[/C][/ROW]
[/TABLE]
Source: https://freestatistics.org/blog/index.php?pk=204261&T=1

Globally Unique Identifier (entire table): ba.freestatistics.org/blog/index.php?pk=204261&T=1

As an alternative you can also use a QR Code:  

The GUIDs for individual cells are displayed in the table below:

Univariate ARIMA Extrapolation Forecast
timeY[t]F[t]95% LB95% UBp-value(H0: Y[t] = F[t])P(F[t]>Y[t-1])P(F[t]>Y[t-s])P(F[t]>Y[467])
4551063-------
4561048-------
457968-------
4581022-------
4591014-------
4601035-------
4611069-------
4621038-------
4631133-------
4641260-------
4651207-------
4661235-------
4671297-------
46811791294.21241204.0991388.94370.00860.47710.477
46913321316.91231189.22621453.89880.41450.975810.6121
47013231320.9411165.47821490.36890.49050.44910.99970.6091
47112481317.66061139.6771514.2440.24370.47880.99880.5816
47212481321.59311123.36261543.09970.25750.74250.99440.5861
47312601334.03081116.58931579.50780.27720.75390.98280.6163
47412601332.54181099.02451598.7520.29660.70340.98490.6032
47513171331.49841083.14561617.20270.46040.68810.91340.5935
47613081341.70381077.97281647.58370.41450.56290.69970.6127
47713801356.16521077.14571682.21810.4430.61390.81510.639
47813271352.51261061.57661695.12990.4420.43750.74930.6246
47913271370.47651064.8151732.81620.4070.5930.65450.6545


Univariate ARIMA Extrapolation Forecast Performance
time% S.E.PEMAPESq.EMSERMSE
4680.0373-0.089013273.898100
4690.05310.01150.0502227.64026750.769282.1631
4700.06540.00160.0344.23934501.925967.0964
4710.0761-0.05290.03874852.60194589.594967.7465
4720.0855-0.05570.04215415.93924754.863768.9555
4730.0939-0.05550.04435480.55474875.812269.827
4740.1019-0.05440.04585262.30644931.025770.2213
4750.1095-0.01090.0414210.2034340.922865.8857
4760.1163-0.02510.03961135.94393984.814163.1254
4770.12270.01760.0374568.09683643.142360.3584
4780.1292-0.01890.0357650.89383371.119758.0613
4790.1349-0.03170.03541890.213247.710656.9887

\begin{tabular}{lllllllll}
\hline
Univariate ARIMA Extrapolation Forecast Performance \tabularnewline
time & % S.E. & PE & MAPE & Sq.E & MSE & RMSE \tabularnewline
468 & 0.0373 & -0.089 & 0 & 13273.8981 & 0 & 0 \tabularnewline
469 & 0.0531 & 0.0115 & 0.0502 & 227.6402 & 6750.7692 & 82.1631 \tabularnewline
470 & 0.0654 & 0.0016 & 0.034 & 4.2393 & 4501.9259 & 67.0964 \tabularnewline
471 & 0.0761 & -0.0529 & 0.0387 & 4852.6019 & 4589.5949 & 67.7465 \tabularnewline
472 & 0.0855 & -0.0557 & 0.0421 & 5415.9392 & 4754.8637 & 68.9555 \tabularnewline
473 & 0.0939 & -0.0555 & 0.0443 & 5480.5547 & 4875.8122 & 69.827 \tabularnewline
474 & 0.1019 & -0.0544 & 0.0458 & 5262.3064 & 4931.0257 & 70.2213 \tabularnewline
475 & 0.1095 & -0.0109 & 0.0414 & 210.203 & 4340.9228 & 65.8857 \tabularnewline
476 & 0.1163 & -0.0251 & 0.0396 & 1135.9439 & 3984.8141 & 63.1254 \tabularnewline
477 & 0.1227 & 0.0176 & 0.0374 & 568.0968 & 3643.1423 & 60.3584 \tabularnewline
478 & 0.1292 & -0.0189 & 0.0357 & 650.8938 & 3371.1197 & 58.0613 \tabularnewline
479 & 0.1349 & -0.0317 & 0.0354 & 1890.21 & 3247.7106 & 56.9887 \tabularnewline
\hline
\end{tabular}
%Source: https://freestatistics.org/blog/index.php?pk=204261&T=2

[TABLE]
[ROW][C]Univariate ARIMA Extrapolation Forecast Performance[/C][/ROW]
[ROW][C]time[/C][C]% S.E.[/C][C]PE[/C][C]MAPE[/C][C]Sq.E[/C][C]MSE[/C][C]RMSE[/C][/ROW]
[ROW][C]468[/C][C]0.0373[/C][C]-0.089[/C][C]0[/C][C]13273.8981[/C][C]0[/C][C]0[/C][/ROW]
[ROW][C]469[/C][C]0.0531[/C][C]0.0115[/C][C]0.0502[/C][C]227.6402[/C][C]6750.7692[/C][C]82.1631[/C][/ROW]
[ROW][C]470[/C][C]0.0654[/C][C]0.0016[/C][C]0.034[/C][C]4.2393[/C][C]4501.9259[/C][C]67.0964[/C][/ROW]
[ROW][C]471[/C][C]0.0761[/C][C]-0.0529[/C][C]0.0387[/C][C]4852.6019[/C][C]4589.5949[/C][C]67.7465[/C][/ROW]
[ROW][C]472[/C][C]0.0855[/C][C]-0.0557[/C][C]0.0421[/C][C]5415.9392[/C][C]4754.8637[/C][C]68.9555[/C][/ROW]
[ROW][C]473[/C][C]0.0939[/C][C]-0.0555[/C][C]0.0443[/C][C]5480.5547[/C][C]4875.8122[/C][C]69.827[/C][/ROW]
[ROW][C]474[/C][C]0.1019[/C][C]-0.0544[/C][C]0.0458[/C][C]5262.3064[/C][C]4931.0257[/C][C]70.2213[/C][/ROW]
[ROW][C]475[/C][C]0.1095[/C][C]-0.0109[/C][C]0.0414[/C][C]210.203[/C][C]4340.9228[/C][C]65.8857[/C][/ROW]
[ROW][C]476[/C][C]0.1163[/C][C]-0.0251[/C][C]0.0396[/C][C]1135.9439[/C][C]3984.8141[/C][C]63.1254[/C][/ROW]
[ROW][C]477[/C][C]0.1227[/C][C]0.0176[/C][C]0.0374[/C][C]568.0968[/C][C]3643.1423[/C][C]60.3584[/C][/ROW]
[ROW][C]478[/C][C]0.1292[/C][C]-0.0189[/C][C]0.0357[/C][C]650.8938[/C][C]3371.1197[/C][C]58.0613[/C][/ROW]
[ROW][C]479[/C][C]0.1349[/C][C]-0.0317[/C][C]0.0354[/C][C]1890.21[/C][C]3247.7106[/C][C]56.9887[/C][/ROW]
[/TABLE]
Source: https://freestatistics.org/blog/index.php?pk=204261&T=2

Globally Unique Identifier (entire table): ba.freestatistics.org/blog/index.php?pk=204261&T=2

As an alternative you can also use a QR Code:  

The GUIDs for individual cells are displayed in the table below:

Univariate ARIMA Extrapolation Forecast Performance
time% S.E.PEMAPESq.EMSERMSE
4680.0373-0.089013273.898100
4690.05310.01150.0502227.64026750.769282.1631
4700.06540.00160.0344.23934501.925967.0964
4710.0761-0.05290.03874852.60194589.594967.7465
4720.0855-0.05570.04215415.93924754.863768.9555
4730.0939-0.05550.04435480.55474875.812269.827
4740.1019-0.05440.04585262.30644931.025770.2213
4750.1095-0.01090.0414210.2034340.922865.8857
4760.1163-0.02510.03961135.94393984.814163.1254
4770.12270.01760.0374568.09683643.142360.3584
4780.1292-0.01890.0357650.89383371.119758.0613
4790.1349-0.03170.03541890.213247.710656.9887


Parameters (Session):
par1 = 12 ; par2 = 0.3 ; par3 = 1 ; par4 = 1 ; par5 = 12 ; par6 = 0 ; par7 = 0 ; par8 = 0 ; par9 = 1 ; par10 = FALSE ;
Parameters (R input):
par1 = 12 ; par2 = 0.3 ; par3 = 1 ; par4 = 1 ; par5 = 12 ; par6 = 0 ; par7 = 0 ; par8 = 0 ; par9 = 1 ; par10 = FALSE ;
R code (references can be found in the software module):
par1 <- as.numeric(par1) #cut off periods
par2 <- as.numeric(par2) #lambda
par3 <- as.numeric(par3) #degree of non-seasonal differencing
par4 <- as.numeric(par4) #degree of seasonal differencing
par5 <- as.numeric(par5) #seasonal period
par6 <- as.numeric(par6) #p
par7 <- as.numeric(par7) #q
par8 <- as.numeric(par8) #P
par9 <- as.numeric(par9) #Q
if (par10 == 'TRUE') par10 <- TRUE
if (par10 == 'FALSE') par10 <- FALSE
if (par2 == 0) x <- log(x)
if (par2 != 0) x <- x^par2
lx <- length(x)
first <- lx - 2*par1
nx <- lx - par1
nx1 <- nx + 1
fx <- lx - nx
if (fx < 1) {
fx <- par5
nx1 <- lx + fx - 1
first <- lx - 2*fx
}
first <- 1
if (fx < 3) fx <- round(lx/10,0)
(arima.out <- arima(x[1:nx], order=c(par6,par3,par7), seasonal=list(order=c(par8,par4,par9), period=par5), include.mean=par10, method='ML'))
(forecast <- predict(arima.out,par1))
(lb <- forecast$pred - 1.96 * forecast$se)
(ub <- forecast$pred + 1.96 * forecast$se)
if (par2 == 0) {
x <- exp(x)
forecast$pred <- exp(forecast$pred)
lb <- exp(lb)
ub <- exp(ub)
}
if (par2 != 0) {
x <- x^(1/par2)
forecast$pred <- forecast$pred^(1/par2)
lb <- lb^(1/par2)
ub <- ub^(1/par2)
}
if (par2 < 0) {
olb <- lb
lb <- ub
ub <- olb
}
(actandfor <- c(x[1:nx], forecast$pred))
(perc.se <- (ub-forecast$pred)/1.96/forecast$pred)
bitmap(file='test1.png')
opar <- par(mar=c(4,4,2,2),las=1)
ylim <- c( min(x[first:nx],lb), max(x[first:nx],ub))
plot(x,ylim=ylim,type='n',xlim=c(first,lx))
usr <- par('usr')
rect(usr[1],usr[3],nx+1,usr[4],border=NA,col='lemonchiffon')
rect(nx1,usr[3],usr[2],usr[4],border=NA,col='lavender')
abline(h= (-3:3)*2 , col ='gray', lty =3)
polygon( c(nx1:lx,lx:nx1), c(lb,rev(ub)), col = 'orange', lty=2,border=NA)
lines(nx1:lx, lb , lty=2)
lines(nx1:lx, ub , lty=2)
lines(x, lwd=2)
lines(nx1:lx, forecast$pred , lwd=2 , col ='white')
box()
par(opar)
dev.off()
prob.dec <- array(NA, dim=fx)
prob.sdec <- array(NA, dim=fx)
prob.ldec <- array(NA, dim=fx)
prob.pval <- array(NA, dim=fx)
perf.pe <- array(0, dim=fx)
perf.mape <- array(0, dim=fx)
perf.mape1 <- array(0, dim=fx)
perf.se <- array(0, dim=fx)
perf.mse <- array(0, dim=fx)
perf.mse1 <- array(0, dim=fx)
perf.rmse <- array(0, dim=fx)
for (i in 1:fx) {
locSD <- (ub[i] - forecast$pred[i]) / 1.96
perf.pe[i] = (x[nx+i] - forecast$pred[i]) / forecast$pred[i]
perf.se[i] = (x[nx+i] - forecast$pred[i])^2
prob.dec[i] = pnorm((x[nx+i-1] - forecast$pred[i]) / locSD)
prob.sdec[i] = pnorm((x[nx+i-par5] - forecast$pred[i]) / locSD)
prob.ldec[i] = pnorm((x[nx] - forecast$pred[i]) / locSD)
prob.pval[i] = pnorm(abs(x[nx+i] - forecast$pred[i]) / locSD)
}
perf.mape[1] = abs(perf.pe[1])
perf.mse[1] = abs(perf.se[1])
for (i in 2:fx) {
perf.mape[i] = perf.mape[i-1] + abs(perf.pe[i])
perf.mape1[i] = perf.mape[i] / i
perf.mse[i] = perf.mse[i-1] + perf.se[i]
perf.mse1[i] = perf.mse[i] / i
}
perf.rmse = sqrt(perf.mse1)
bitmap(file='test2.png')
plot(forecast$pred, pch=19, type='b',main='ARIMA Extrapolation Forecast', ylab='Forecast and 95% CI', xlab='time',ylim=c(min(lb),max(ub)))
dum <- forecast$pred
dum[1:par1] <- x[(nx+1):lx]
lines(dum, lty=1)
lines(ub,lty=3)
lines(lb,lty=3)
dev.off()
load(file='createtable')
a<-table.start()
a<-table.row.start(a)
a<-table.element(a,'Univariate ARIMA Extrapolation Forecast',9,TRUE)
a<-table.row.end(a)
a<-table.row.start(a)
a<-table.element(a,'time',1,header=TRUE)
a<-table.element(a,'Y[t]',1,header=TRUE)
a<-table.element(a,'F[t]',1,header=TRUE)
a<-table.element(a,'95% LB',1,header=TRUE)
a<-table.element(a,'95% UB',1,header=TRUE)
a<-table.element(a,'p-value
(H0: Y[t] = F[t])',1,header=TRUE)
a<-table.element(a,'P(F[t]>Y[t-1])',1,header=TRUE)
a<-table.element(a,'P(F[t]>Y[t-s])',1,header=TRUE)
mylab <- paste('P(F[t]>Y[',nx,sep='')
mylab <- paste(mylab,'])',sep='')
a<-table.element(a,mylab,1,header=TRUE)
a<-table.row.end(a)
for (i in (nx-par5):nx) {
a<-table.row.start(a)
a<-table.element(a,i,header=TRUE)
a<-table.element(a,x[i])
a<-table.element(a,'-')
a<-table.row.end(a)
}
for (i in 1:fx) {
a<-table.row.start(a)
a<-table.element(a,nx+i,header=TRUE)
a<-table.element(a,round(x[nx+i],4))
a<-table.element(a,round(forecast$pred[i],4))
a<-table.element(a,round(lb[i],4))
a<-table.element(a,round(ub[i],4))
a<-table.element(a,round((1-prob.pval[i]),4))
a<-table.element(a,round((1-prob.dec[i]),4))
a<-table.element(a,round((1-prob.sdec[i]),4))
a<-table.element(a,round((1-prob.ldec[i]),4))
a<-table.row.end(a)
}
a<-table.end(a)
table.save(a,file='mytable.tab')
a<-table.start()
a<-table.row.start(a)
a<-table.element(a,'Univariate ARIMA Extrapolation Forecast Performance',7,TRUE)
a<-table.row.end(a)
a<-table.row.start(a)
a<-table.element(a,'time',1,header=TRUE)
a<-table.element(a,'% S.E.',1,header=TRUE)
a<-table.element(a,'PE',1,header=TRUE)
a<-table.element(a,'MAPE',1,header=TRUE)
a<-table.element(a,'Sq.E',1,header=TRUE)
a<-table.element(a,'MSE',1,header=TRUE)
a<-table.element(a,'RMSE',1,header=TRUE)
a<-table.row.end(a)
for (i in 1:fx) {
a<-table.row.start(a)
a<-table.element(a,nx+i,header=TRUE)
a<-table.element(a,round(perc.se[i],4))
a<-table.element(a,round(perf.pe[i],4))
a<-table.element(a,round(perf.mape1[i],4))
a<-table.element(a,round(perf.se[i],4))
a<-table.element(a,round(perf.mse1[i],4))
a<-table.element(a,round(perf.rmse[i],4))
a<-table.row.end(a)
}
a<-table.end(a)
table.save(a,file='mytable1.tab')