| Tabulation of Results | ||
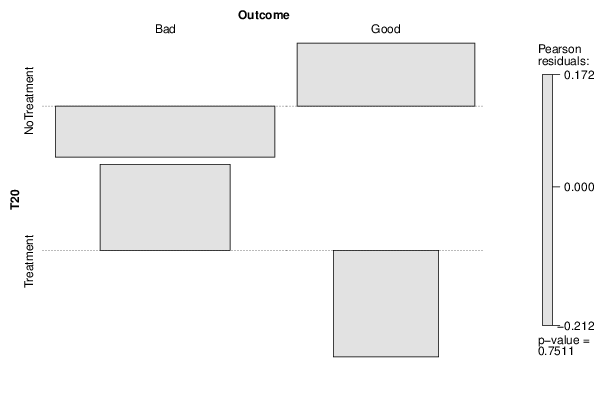
| T20 x Outcome | ||
| Bad | Good | NoTreatment | 68 | 46 | Treatment | 25 | 15 |
| Tabulation of Expected Results | ||
| T20 x Outcome | ||
| Bad | Good | NoTreatment | 68.84 | 45.16 | Treatment | 24.16 | 15.84 |
| Statistical Results | |
| Pearson's Chi-squared test with Yates' continuity correction | |
| Pearson Chi Square Statistic | 0.02 |
| Degrees of Freedom | 1 |
| P value | 0.9 |