| Tabulation of Results | ||
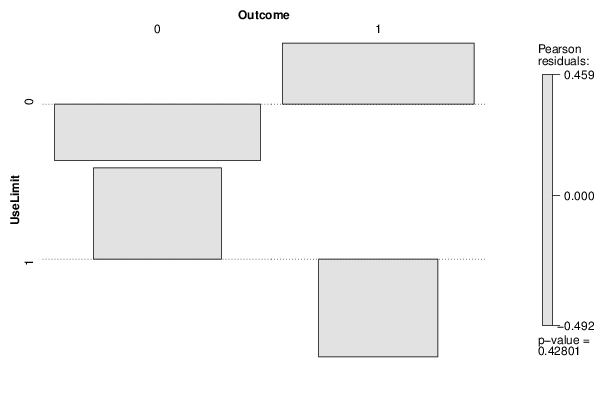
| UseLimit x Outcome | ||
| 0 | 1 | 0 | 64 | 60 | 1 | 28 | 20 |
| Tabulation of Expected Results | ||
| UseLimit x Outcome | ||
| 0 | 1 | 0 | 66.33 | 57.67 | 1 | 25.67 | 22.33 |
| Statistical Results | |
| Pearson's Chi-squared test with Yates' continuity correction | |
| Pearson Chi Square Statistic | 0.39 |
| Degrees of Freedom | 1 |
| P value | 0.53 |