| Tabulation of Results | ||
| Treatment_week x CorrectAnalysis | ||
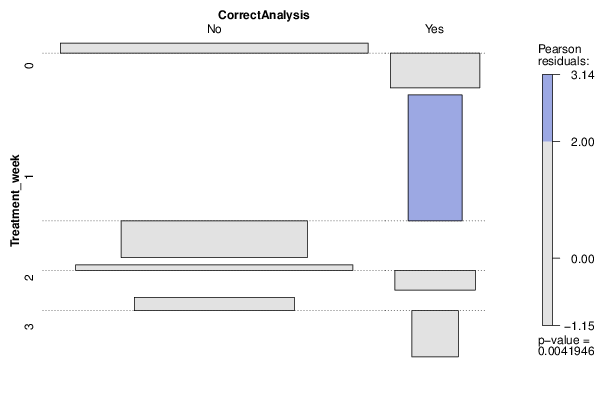
| No | Yes | 0 | 60 | 3 | 1 | 17 | 6 | 2 | 48 | 3 | 3 | 17 | 0 |
| Tabulation of Expected Results | ||
| Treatment_week x CorrectAnalysis | ||
| No | Yes | 0 | 58.09 | 4.91 | 1 | 21.21 | 1.79 | 2 | 47.03 | 3.97 | 3 | 15.68 | 1.32 |
| Statistical Results | |
| Pearson's Chi-squared test with simulated p-value (based on 2000 replicates) | |
| Exact Pearson Chi Square Statistic | 13.21 |
| P value | 0.01 |