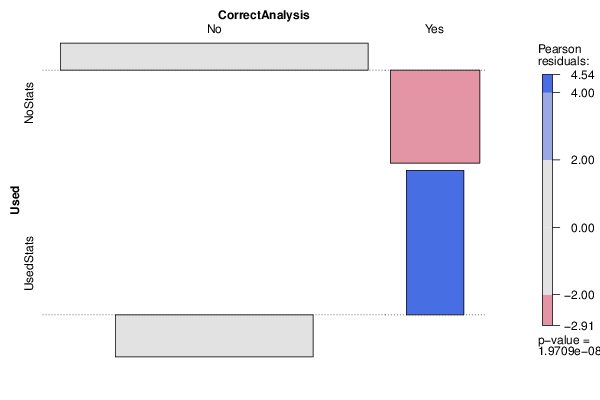
| Tabulation of Results | ||
| Used x CorrectAnalysis | ||
| No | Yes | NoStats | 109 | 0 | UsedStats | 33 | 12 |
| Tabulation of Expected Results | ||
| Used x CorrectAnalysis | ||
| No | Yes | NoStats | 100.51 | 8.49 | UsedStats | 41.49 | 3.51 |
| Statistical Results | |
| Pearson's Chi-squared test with simulated p-value (based on 2000 replicates) | |
| Exact Pearson Chi Square Statistic | 31.52 |
| P value | 0 |