Free Statistics

of Irreproducible Research!

Author's title

Author*The author of this computation has been verified*
R Software Modulerwasp_multipleregression.wasp
Title produced by softwareMultiple Regression
Date of computationFri, 21 Dec 2012 12:07:57 -0500
Cite this page as followsStatistical Computations at FreeStatistics.org, Office for Research Development and Education, URL https://freestatistics.org/blog/index.php?v=date/2012/Dec/21/t1356109747wyyqklq2p4pmuh5.htm/, Retrieved Sat, 27 Apr 2024 00:04:25 +0000
Statistical Computations at FreeStatistics.org, Office for Research Development and Education, URL https://freestatistics.org/blog/index.php?pk=203968, Retrieved Sat, 27 Apr 2024 00:04:25 +0000
QR Codes:

Original text written by user:
IsPrivate?No (this computation is public)
User-defined keywords
Estimated Impact57
Family? (F = Feedback message, R = changed R code, M = changed R Module, P = changed Parameters, D = changed Data)
-       [Multiple Regression] [simple regression] [2012-12-21 17:07:57] [8dd0e7aaa1b5a23d1fcf42093aaacdee] [Current]
Feedback Forum

Post a new message
Dataseries X:
166,4	91,7
159,6	90,2
159,1	86
155,5	83,9
164,3	80,4
169,8	76,5
155,7	76
165,2	75,8
175,4	75,6
178,1	75
167,1	74,7
177	63,2
174,2	52,9
175,6	48,5
170,8	39,1
175,1	38,4
182,8	4,3
180,3	30,3
178,8	30,3
181,4	29,6
182,8	26,5
186,1	13,8


Summary of computational transaction
Raw Inputview raw input (R code)
Raw Outputview raw output of R engine
Computing time8 seconds
R Server'Sir Maurice George Kendall' @ kendall.wessa.net
R Framework error message
The field 'Names of X columns' contains a hard return which cannot be interpreted.
Please, resubmit your request without hard returns in the 'Names of X columns'.

\begin{tabular}{lllllllll}
\hline
Summary of computational transaction \tabularnewline
Raw Input & view raw input (R code)  \tabularnewline
Raw Output & view raw output of R engine  \tabularnewline
Computing time & 8 seconds \tabularnewline
R Server & 'Sir Maurice George Kendall' @ kendall.wessa.net \tabularnewline
R Framework error message & 
The field 'Names of X columns' contains a hard return which cannot be interpreted.
Please, resubmit your request without hard returns in the 'Names of X columns'.
\tabularnewline \hline \end{tabular} %Source: https://freestatistics.org/blog/index.php?pk=203968&T=0

[TABLE]
[ROW][C]Summary of computational transaction[/C][/ROW]
[ROW][C]Raw Input[/C][C]view raw input (R code) [/C][/ROW]
[ROW][C]Raw Output[/C][C]view raw output of R engine [/C][/ROW]
[ROW][C]Computing time[/C][C]8 seconds[/C][/ROW]
[ROW][C]R Server[/C][C]'Sir Maurice George Kendall' @ kendall.wessa.net[/C][/ROW]
[ROW][C]R Framework error message[/C][C]
The field 'Names of X columns' contains a hard return which cannot be interpreted.
Please, resubmit your request without hard returns in the 'Names of X columns'.
[/C][/ROW] [/TABLE] Source: https://freestatistics.org/blog/index.php?pk=203968&T=0

Globally Unique Identifier (entire table): ba.freestatistics.org/blog/index.php?pk=203968&T=0

As an alternative you can also use a QR Code:  

The GUIDs for individual cells are displayed in the table below:

Summary of computational transaction
Raw Inputview raw input (R code)
Raw Outputview raw output of R engine
Computing time8 seconds
R Server'Sir Maurice George Kendall' @ kendall.wessa.net
R Framework error message
The field 'Names of X columns' contains a hard return which cannot be interpreted.
Please, resubmit your request without hard returns in the 'Names of X columns'.


Multiple Linear Regression - Estimated Regression Equation
armoede [t] = + 468.154293413601 -2.3899644164659Wiskunde[t] + e[t]

\begin{tabular}{lllllllll}
\hline
Multiple Linear Regression - Estimated Regression Equation \tabularnewline
armoede
[t] =  +  468.154293413601 -2.3899644164659Wiskunde[t]  + e[t] \tabularnewline
\hline
\end{tabular}
%Source: https://freestatistics.org/blog/index.php?pk=203968&T=1

[TABLE]
[ROW][C]Multiple Linear Regression - Estimated Regression Equation[/C][/ROW]
[ROW][C]armoede
[t] =  +  468.154293413601 -2.3899644164659Wiskunde[t]  + e[t][/C][/ROW]
[/TABLE]
Source: https://freestatistics.org/blog/index.php?pk=203968&T=1

Globally Unique Identifier (entire table): ba.freestatistics.org/blog/index.php?pk=203968&T=1

As an alternative you can also use a QR Code:  

The GUIDs for individual cells are displayed in the table below:

Multiple Linear Regression - Estimated Regression Equation
armoede [t] = + 468.154293413601 -2.3899644164659Wiskunde[t] + e[t]


Multiple Linear Regression - Ordinary Least Squares
VariableParameterS.D.T-STATH0: parameter = 02-tail p-value1-tail p-value
(Intercept)468.15429341360164.667847.23941e-060
Wiskunde-2.38996441646590.375755-6.36043e-062e-06

\begin{tabular}{lllllllll}
\hline
Multiple Linear Regression - Ordinary Least Squares \tabularnewline
Variable & Parameter & S.D. & T-STATH0: parameter = 0 & 2-tail p-value & 1-tail p-value \tabularnewline
(Intercept) & 468.154293413601 & 64.66784 & 7.2394 & 1e-06 & 0 \tabularnewline
Wiskunde & -2.3899644164659 & 0.375755 & -6.3604 & 3e-06 & 2e-06 \tabularnewline
\hline
\end{tabular}
%Source: https://freestatistics.org/blog/index.php?pk=203968&T=2

[TABLE]
[ROW][C]Multiple Linear Regression - Ordinary Least Squares[/C][/ROW]
[ROW][C]Variable[/C][C]Parameter[/C][C]S.D.[/C][C]T-STATH0: parameter = 0[/C][C]2-tail p-value[/C][C]1-tail p-value[/C][/ROW]
[ROW][C](Intercept)[/C][C]468.154293413601[/C][C]64.66784[/C][C]7.2394[/C][C]1e-06[/C][C]0[/C][/ROW]
[ROW][C]Wiskunde[/C][C]-2.3899644164659[/C][C]0.375755[/C][C]-6.3604[/C][C]3e-06[/C][C]2e-06[/C][/ROW]
[/TABLE]
Source: https://freestatistics.org/blog/index.php?pk=203968&T=2

Globally Unique Identifier (entire table): ba.freestatistics.org/blog/index.php?pk=203968&T=2

As an alternative you can also use a QR Code:  

The GUIDs for individual cells are displayed in the table below:

Multiple Linear Regression - Ordinary Least Squares
VariableParameterS.D.T-STATH0: parameter = 02-tail p-value1-tail p-value
(Intercept)468.15429341360164.667847.23941e-060
Wiskunde-2.38996441646590.375755-6.36043e-062e-06


Multiple Linear Regression - Regression Statistics
Multiple R0.81803163118994
R-squared0.669175749627274
Adjusted R-squared0.652634537108638
F-TEST (value)40.4550602849303
F-TEST (DF numerator)1
F-TEST (DF denominator)20
p-value3.31051492308276e-06
Multiple Linear Regression - Residual Statistics
Residual Standard Deviation15.7712823814165
Sum Squared Residuals4974.66695908759

\begin{tabular}{lllllllll}
\hline
Multiple Linear Regression - Regression Statistics \tabularnewline
Multiple R & 0.81803163118994 \tabularnewline
R-squared & 0.669175749627274 \tabularnewline
Adjusted R-squared & 0.652634537108638 \tabularnewline
F-TEST (value) & 40.4550602849303 \tabularnewline
F-TEST (DF numerator) & 1 \tabularnewline
F-TEST (DF denominator) & 20 \tabularnewline
p-value & 3.31051492308276e-06 \tabularnewline
Multiple Linear Regression - Residual Statistics \tabularnewline
Residual Standard Deviation & 15.7712823814165 \tabularnewline
Sum Squared Residuals & 4974.66695908759 \tabularnewline
\hline
\end{tabular}
%Source: https://freestatistics.org/blog/index.php?pk=203968&T=3

[TABLE]
[ROW][C]Multiple Linear Regression - Regression Statistics[/C][/ROW]
[ROW][C]Multiple R[/C][C]0.81803163118994[/C][/ROW]
[ROW][C]R-squared[/C][C]0.669175749627274[/C][/ROW]
[ROW][C]Adjusted R-squared[/C][C]0.652634537108638[/C][/ROW]
[ROW][C]F-TEST (value)[/C][C]40.4550602849303[/C][/ROW]
[ROW][C]F-TEST (DF numerator)[/C][C]1[/C][/ROW]
[ROW][C]F-TEST (DF denominator)[/C][C]20[/C][/ROW]
[ROW][C]p-value[/C][C]3.31051492308276e-06[/C][/ROW]
[ROW][C]Multiple Linear Regression - Residual Statistics[/C][/ROW]
[ROW][C]Residual Standard Deviation[/C][C]15.7712823814165[/C][/ROW]
[ROW][C]Sum Squared Residuals[/C][C]4974.66695908759[/C][/ROW]
[/TABLE]
Source: https://freestatistics.org/blog/index.php?pk=203968&T=3

Globally Unique Identifier (entire table): ba.freestatistics.org/blog/index.php?pk=203968&T=3

As an alternative you can also use a QR Code:  

The GUIDs for individual cells are displayed in the table below:

Multiple Linear Regression - Regression Statistics
Multiple R0.81803163118994
R-squared0.669175749627274
Adjusted R-squared0.652634537108638
F-TEST (value)40.4550602849303
F-TEST (DF numerator)1
F-TEST (DF denominator)20
p-value3.31051492308276e-06
Multiple Linear Regression - Residual Statistics
Residual Standard Deviation15.7712823814165
Sum Squared Residuals4974.66695908759


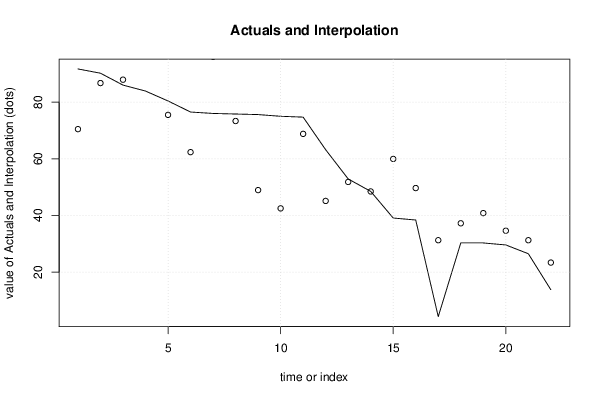
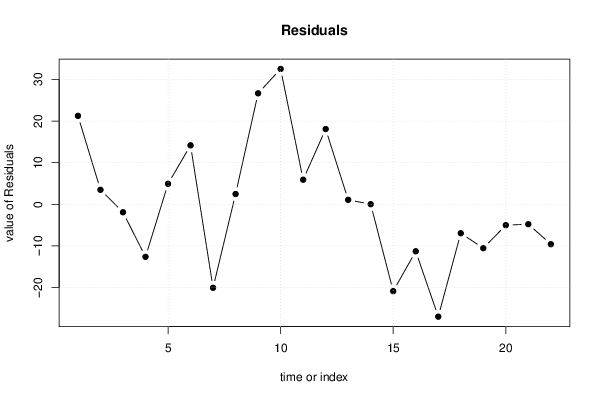
Multiple Linear Regression - Actuals, Interpolation, and Residuals
Time or IndexActualsInterpolationForecastResidualsPrediction Error
191.770.464214513674721.2357854863253
290.286.71597254564313.4840274543569
38687.9109547538761-1.91095475387605
483.996.5148266531533-12.6148266531533
580.475.48313978825334.9168602117467
676.562.338335497690814.1616645023092
77696.0368337698602-20.0368337698601
875.873.3321718134342.46782818656595
975.648.954534765481826.6454652345182
107542.501630841023932.4983691589761
1174.768.79123942214885.90876057785119
1263.245.130591699136318.0694083008637
1352.951.82249206524091.07750793475909
1448.548.47654188218860.0234581178113746
1539.159.9483710812249-20.8483710812249
1638.449.6715240904216-11.2715240904216
174.331.2687980836341-26.9687980836341
1830.337.2437091247988-6.94370912479883
1930.340.8286557494977-10.5286557494977
2029.634.6147482666863-5.01474826668635
2126.531.2687980836341-4.76879808363407
2213.823.3819155092966-9.58191550929662

\begin{tabular}{lllllllll}
\hline
Multiple Linear Regression - Actuals, Interpolation, and Residuals \tabularnewline
Time or Index & Actuals & InterpolationForecast & ResidualsPrediction Error \tabularnewline
1 & 91.7 & 70.4642145136747 & 21.2357854863253 \tabularnewline
2 & 90.2 & 86.7159725456431 & 3.4840274543569 \tabularnewline
3 & 86 & 87.9109547538761 & -1.91095475387605 \tabularnewline
4 & 83.9 & 96.5148266531533 & -12.6148266531533 \tabularnewline
5 & 80.4 & 75.4831397882533 & 4.9168602117467 \tabularnewline
6 & 76.5 & 62.3383354976908 & 14.1616645023092 \tabularnewline
7 & 76 & 96.0368337698602 & -20.0368337698601 \tabularnewline
8 & 75.8 & 73.332171813434 & 2.46782818656595 \tabularnewline
9 & 75.6 & 48.9545347654818 & 26.6454652345182 \tabularnewline
10 & 75 & 42.5016308410239 & 32.4983691589761 \tabularnewline
11 & 74.7 & 68.7912394221488 & 5.90876057785119 \tabularnewline
12 & 63.2 & 45.1305916991363 & 18.0694083008637 \tabularnewline
13 & 52.9 & 51.8224920652409 & 1.07750793475909 \tabularnewline
14 & 48.5 & 48.4765418821886 & 0.0234581178113746 \tabularnewline
15 & 39.1 & 59.9483710812249 & -20.8483710812249 \tabularnewline
16 & 38.4 & 49.6715240904216 & -11.2715240904216 \tabularnewline
17 & 4.3 & 31.2687980836341 & -26.9687980836341 \tabularnewline
18 & 30.3 & 37.2437091247988 & -6.94370912479883 \tabularnewline
19 & 30.3 & 40.8286557494977 & -10.5286557494977 \tabularnewline
20 & 29.6 & 34.6147482666863 & -5.01474826668635 \tabularnewline
21 & 26.5 & 31.2687980836341 & -4.76879808363407 \tabularnewline
22 & 13.8 & 23.3819155092966 & -9.58191550929662 \tabularnewline
\hline
\end{tabular}
%Source: https://freestatistics.org/blog/index.php?pk=203968&T=4

[TABLE]
[ROW][C]Multiple Linear Regression - Actuals, Interpolation, and Residuals[/C][/ROW]
[ROW][C]Time or Index[/C][C]Actuals[/C][C]InterpolationForecast[/C][C]ResidualsPrediction Error[/C][/ROW]
[ROW][C]1[/C][C]91.7[/C][C]70.4642145136747[/C][C]21.2357854863253[/C][/ROW]
[ROW][C]2[/C][C]90.2[/C][C]86.7159725456431[/C][C]3.4840274543569[/C][/ROW]
[ROW][C]3[/C][C]86[/C][C]87.9109547538761[/C][C]-1.91095475387605[/C][/ROW]
[ROW][C]4[/C][C]83.9[/C][C]96.5148266531533[/C][C]-12.6148266531533[/C][/ROW]
[ROW][C]5[/C][C]80.4[/C][C]75.4831397882533[/C][C]4.9168602117467[/C][/ROW]
[ROW][C]6[/C][C]76.5[/C][C]62.3383354976908[/C][C]14.1616645023092[/C][/ROW]
[ROW][C]7[/C][C]76[/C][C]96.0368337698602[/C][C]-20.0368337698601[/C][/ROW]
[ROW][C]8[/C][C]75.8[/C][C]73.332171813434[/C][C]2.46782818656595[/C][/ROW]
[ROW][C]9[/C][C]75.6[/C][C]48.9545347654818[/C][C]26.6454652345182[/C][/ROW]
[ROW][C]10[/C][C]75[/C][C]42.5016308410239[/C][C]32.4983691589761[/C][/ROW]
[ROW][C]11[/C][C]74.7[/C][C]68.7912394221488[/C][C]5.90876057785119[/C][/ROW]
[ROW][C]12[/C][C]63.2[/C][C]45.1305916991363[/C][C]18.0694083008637[/C][/ROW]
[ROW][C]13[/C][C]52.9[/C][C]51.8224920652409[/C][C]1.07750793475909[/C][/ROW]
[ROW][C]14[/C][C]48.5[/C][C]48.4765418821886[/C][C]0.0234581178113746[/C][/ROW]
[ROW][C]15[/C][C]39.1[/C][C]59.9483710812249[/C][C]-20.8483710812249[/C][/ROW]
[ROW][C]16[/C][C]38.4[/C][C]49.6715240904216[/C][C]-11.2715240904216[/C][/ROW]
[ROW][C]17[/C][C]4.3[/C][C]31.2687980836341[/C][C]-26.9687980836341[/C][/ROW]
[ROW][C]18[/C][C]30.3[/C][C]37.2437091247988[/C][C]-6.94370912479883[/C][/ROW]
[ROW][C]19[/C][C]30.3[/C][C]40.8286557494977[/C][C]-10.5286557494977[/C][/ROW]
[ROW][C]20[/C][C]29.6[/C][C]34.6147482666863[/C][C]-5.01474826668635[/C][/ROW]
[ROW][C]21[/C][C]26.5[/C][C]31.2687980836341[/C][C]-4.76879808363407[/C][/ROW]
[ROW][C]22[/C][C]13.8[/C][C]23.3819155092966[/C][C]-9.58191550929662[/C][/ROW]
[/TABLE]
Source: https://freestatistics.org/blog/index.php?pk=203968&T=4

Globally Unique Identifier (entire table): ba.freestatistics.org/blog/index.php?pk=203968&T=4

As an alternative you can also use a QR Code:  

The GUIDs for individual cells are displayed in the table below:

Multiple Linear Regression - Actuals, Interpolation, and Residuals
Time or IndexActualsInterpolationForecastResidualsPrediction Error
191.770.464214513674721.2357854863253
290.286.71597254564313.4840274543569
38687.9109547538761-1.91095475387605
483.996.5148266531533-12.6148266531533
580.475.48313978825334.9168602117467
676.562.338335497690814.1616645023092
77696.0368337698602-20.0368337698601
875.873.3321718134342.46782818656595
975.648.954534765481826.6454652345182
107542.501630841023932.4983691589761
1174.768.79123942214885.90876057785119
1263.245.130591699136318.0694083008637
1352.951.82249206524091.07750793475909
1448.548.47654188218860.0234581178113746
1539.159.9483710812249-20.8483710812249
1638.449.6715240904216-11.2715240904216
174.331.2687980836341-26.9687980836341
1830.337.2437091247988-6.94370912479883
1930.340.8286557494977-10.5286557494977
2029.634.6147482666863-5.01474826668635
2126.531.2687980836341-4.76879808363407
2213.823.3819155092966-9.58191550929662


Parameters (Session):
par1 = 2 ; par2 = Do not include Seasonal Dummies ; par3 = No Linear Trend ;
Parameters (R input):
par1 = 2 ; par2 = Do not include Seasonal Dummies ; par3 = No Linear Trend ;
R code (references can be found in the software module):
library(lattice)
library(lmtest)
n25 <- 25 #minimum number of obs. for Goldfeld-Quandt test
par1 <- as.numeric(par1)
x <- t(y)
k <- length(x[1,])
n <- length(x[,1])
x1 <- cbind(x[,par1], x[,1:k!=par1])
mycolnames <- c(colnames(x)[par1], colnames(x)[1:k!=par1])
colnames(x1) <- mycolnames #colnames(x)[par1]
x <- x1
if (par3 == 'First Differences'){
x2 <- array(0, dim=c(n-1,k), dimnames=list(1:(n-1), paste('(1-B)',colnames(x),sep='')))
for (i in 1:n-1) {
for (j in 1:k) {
x2[i,j] <- x[i+1,j] - x[i,j]
}
}
x <- x2
}
if (par2 == 'Include Monthly Dummies'){
x2 <- array(0, dim=c(n,11), dimnames=list(1:n, paste('M', seq(1:11), sep ='')))
for (i in 1:11){
x2[seq(i,n,12),i] <- 1
}
x <- cbind(x, x2)
}
if (par2 == 'Include Quarterly Dummies'){
x2 <- array(0, dim=c(n,3), dimnames=list(1:n, paste('Q', seq(1:3), sep ='')))
for (i in 1:3){
x2[seq(i,n,4),i] <- 1
}
x <- cbind(x, x2)
}
k <- length(x[1,])
if (par3 == 'Linear Trend'){
x <- cbind(x, c(1:n))
colnames(x)[k+1] <- 't'
}
x
k <- length(x[1,])
df <- as.data.frame(x)
(mylm <- lm(df))
(mysum <- summary(mylm))
if (n > n25) {
kp3 <- k + 3
nmkm3 <- n - k - 3
gqarr <- array(NA, dim=c(nmkm3-kp3+1,3))
numgqtests <- 0
numsignificant1 <- 0
numsignificant5 <- 0
numsignificant10 <- 0
for (mypoint in kp3:nmkm3) {
j <- 0
numgqtests <- numgqtests + 1
for (myalt in c('greater', 'two.sided', 'less')) {
j <- j + 1
gqarr[mypoint-kp3+1,j] <- gqtest(mylm, point=mypoint, alternative=myalt)$p.value
}
if (gqarr[mypoint-kp3+1,2] < 0.01) numsignificant1 <- numsignificant1 + 1
if (gqarr[mypoint-kp3+1,2] < 0.05) numsignificant5 <- numsignificant5 + 1
if (gqarr[mypoint-kp3+1,2] < 0.10) numsignificant10 <- numsignificant10 + 1
}
gqarr
}
bitmap(file='test0.png')
plot(x[,1], type='l', main='Actuals and Interpolation', ylab='value of Actuals and Interpolation (dots)', xlab='time or index')
points(x[,1]-mysum$resid)
grid()
dev.off()
bitmap(file='test1.png')
plot(mysum$resid, type='b', pch=19, main='Residuals', ylab='value of Residuals', xlab='time or index')
grid()
dev.off()
bitmap(file='test2.png')
hist(mysum$resid, main='Residual Histogram', xlab='values of Residuals')
grid()
dev.off()
bitmap(file='test3.png')
densityplot(~mysum$resid,col='black',main='Residual Density Plot', xlab='values of Residuals')
dev.off()
bitmap(file='test4.png')
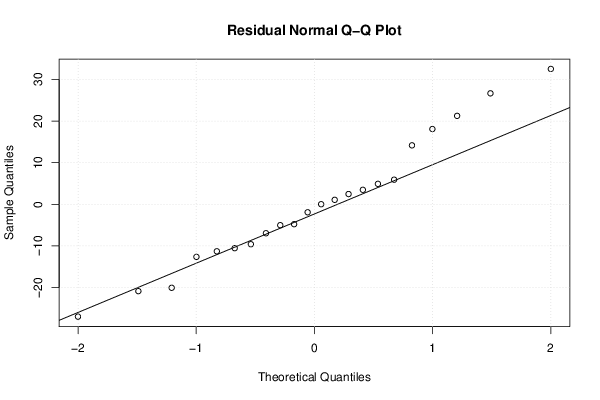
qqnorm(mysum$resid, main='Residual Normal Q-Q Plot')
qqline(mysum$resid)
grid()
dev.off()
(myerror <- as.ts(mysum$resid))
bitmap(file='test5.png')
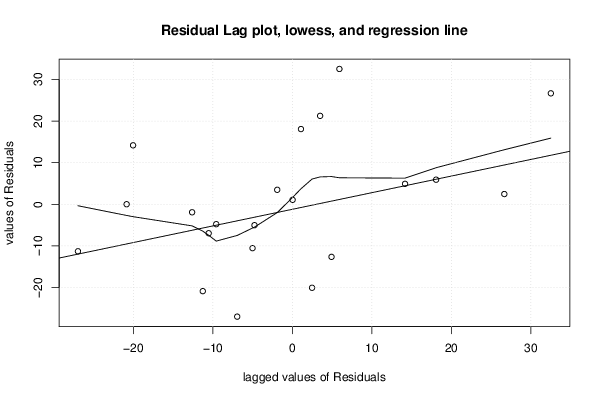
dum <- cbind(lag(myerror,k=1),myerror)
dum
dum1 <- dum[2:length(myerror),]
dum1
z <- as.data.frame(dum1)
z
plot(z,main=paste('Residual Lag plot, lowess, and regression line'), ylab='values of Residuals', xlab='lagged values of Residuals')
lines(lowess(z))
abline(lm(z))
grid()
dev.off()
bitmap(file='test6.png')
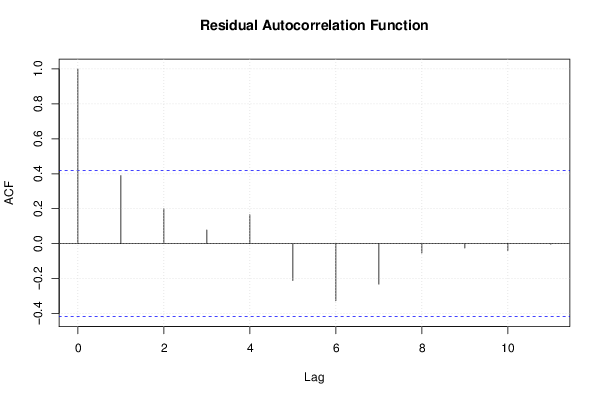
acf(mysum$resid, lag.max=length(mysum$resid)/2, main='Residual Autocorrelation Function')
grid()
dev.off()
bitmap(file='test7.png')
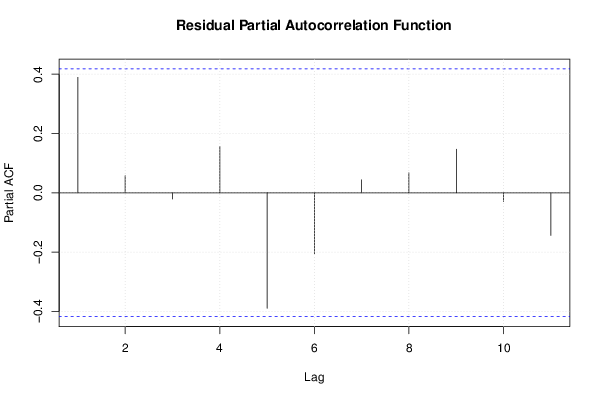
pacf(mysum$resid, lag.max=length(mysum$resid)/2, main='Residual Partial Autocorrelation Function')
grid()
dev.off()
bitmap(file='test8.png')
opar <- par(mfrow = c(2,2), oma = c(0, 0, 1.1, 0))
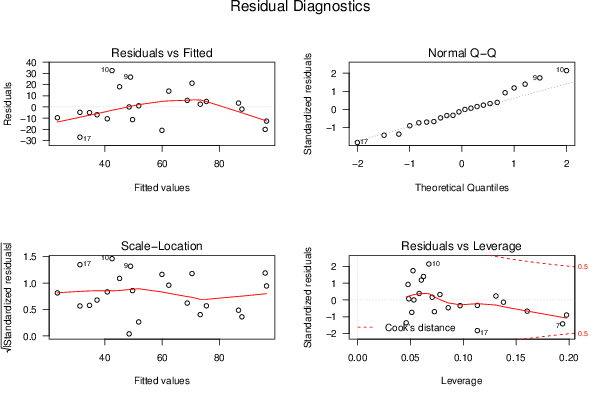
plot(mylm, las = 1, sub='Residual Diagnostics')
par(opar)
dev.off()
if (n > n25) {
bitmap(file='test9.png')
plot(kp3:nmkm3,gqarr[,2], main='Goldfeld-Quandt test',ylab='2-sided p-value',xlab='breakpoint')
grid()
dev.off()
}
load(file='createtable')
a<-table.start()
a<-table.row.start(a)
a<-table.element(a, 'Multiple Linear Regression - Estimated Regression Equation', 1, TRUE)
a<-table.row.end(a)
myeq <- colnames(x)[1]
myeq <- paste(myeq, '[t] = ', sep='')
for (i in 1:k){
if (mysum$coefficients[i,1] > 0) myeq <- paste(myeq, '+', '')
myeq <- paste(myeq, mysum$coefficients[i,1], sep=' ')
if (rownames(mysum$coefficients)[i] != '(Intercept)') {
myeq <- paste(myeq, rownames(mysum$coefficients)[i], sep='')
if (rownames(mysum$coefficients)[i] != 't') myeq <- paste(myeq, '[t]', sep='')
}
}
myeq <- paste(myeq, ' + e[t]')
a<-table.row.start(a)
a<-table.element(a, myeq)
a<-table.row.end(a)
a<-table.end(a)
table.save(a,file='mytable1.tab')
a<-table.start()
a<-table.row.start(a)
a<-table.element(a,hyperlink('ols1.htm','Multiple Linear Regression - Ordinary Least Squares',''), 6, TRUE)
a<-table.row.end(a)
a<-table.row.start(a)
a<-table.element(a,'Variable',header=TRUE)
a<-table.element(a,'Parameter',header=TRUE)
a<-table.element(a,'S.D.',header=TRUE)
a<-table.element(a,'T-STAT
H0: parameter = 0',header=TRUE)
a<-table.element(a,'2-tail p-value',header=TRUE)
a<-table.element(a,'1-tail p-value',header=TRUE)
a<-table.row.end(a)
for (i in 1:k){
a<-table.row.start(a)
a<-table.element(a,rownames(mysum$coefficients)[i],header=TRUE)
a<-table.element(a,mysum$coefficients[i,1])
a<-table.element(a, round(mysum$coefficients[i,2],6))
a<-table.element(a, round(mysum$coefficients[i,3],4))
a<-table.element(a, round(mysum$coefficients[i,4],6))
a<-table.element(a, round(mysum$coefficients[i,4]/2,6))
a<-table.row.end(a)
}
a<-table.end(a)
table.save(a,file='mytable2.tab')
a<-table.start()
a<-table.row.start(a)
a<-table.element(a, 'Multiple Linear Regression - Regression Statistics', 2, TRUE)
a<-table.row.end(a)
a<-table.row.start(a)
a<-table.element(a, 'Multiple R',1,TRUE)
a<-table.element(a, sqrt(mysum$r.squared))
a<-table.row.end(a)
a<-table.row.start(a)
a<-table.element(a, 'R-squared',1,TRUE)
a<-table.element(a, mysum$r.squared)
a<-table.row.end(a)
a<-table.row.start(a)
a<-table.element(a, 'Adjusted R-squared',1,TRUE)
a<-table.element(a, mysum$adj.r.squared)
a<-table.row.end(a)
a<-table.row.start(a)
a<-table.element(a, 'F-TEST (value)',1,TRUE)
a<-table.element(a, mysum$fstatistic[1])
a<-table.row.end(a)
a<-table.row.start(a)
a<-table.element(a, 'F-TEST (DF numerator)',1,TRUE)
a<-table.element(a, mysum$fstatistic[2])
a<-table.row.end(a)
a<-table.row.start(a)
a<-table.element(a, 'F-TEST (DF denominator)',1,TRUE)
a<-table.element(a, mysum$fstatistic[3])
a<-table.row.end(a)
a<-table.row.start(a)
a<-table.element(a, 'p-value',1,TRUE)
a<-table.element(a, 1-pf(mysum$fstatistic[1],mysum$fstatistic[2],mysum$fstatistic[3]))
a<-table.row.end(a)
a<-table.row.start(a)
a<-table.element(a, 'Multiple Linear Regression - Residual Statistics', 2, TRUE)
a<-table.row.end(a)
a<-table.row.start(a)
a<-table.element(a, 'Residual Standard Deviation',1,TRUE)
a<-table.element(a, mysum$sigma)
a<-table.row.end(a)
a<-table.row.start(a)
a<-table.element(a, 'Sum Squared Residuals',1,TRUE)
a<-table.element(a, sum(myerror*myerror))
a<-table.row.end(a)
a<-table.end(a)
table.save(a,file='mytable3.tab')
a<-table.start()
a<-table.row.start(a)
a<-table.element(a, 'Multiple Linear Regression - Actuals, Interpolation, and Residuals', 4, TRUE)
a<-table.row.end(a)
a<-table.row.start(a)
a<-table.element(a, 'Time or Index', 1, TRUE)
a<-table.element(a, 'Actuals', 1, TRUE)
a<-table.element(a, 'Interpolation
Forecast', 1, TRUE)
a<-table.element(a, 'Residuals
Prediction Error', 1, TRUE)
a<-table.row.end(a)
for (i in 1:n) {
a<-table.row.start(a)
a<-table.element(a,i, 1, TRUE)
a<-table.element(a,x[i])
a<-table.element(a,x[i]-mysum$resid[i])
a<-table.element(a,mysum$resid[i])
a<-table.row.end(a)
}
a<-table.end(a)
table.save(a,file='mytable4.tab')
if (n > n25) {
a<-table.start()
a<-table.row.start(a)
a<-table.element(a,'Goldfeld-Quandt test for Heteroskedasticity',4,TRUE)
a<-table.row.end(a)
a<-table.row.start(a)
a<-table.element(a,'p-values',header=TRUE)
a<-table.element(a,'Alternative Hypothesis',3,header=TRUE)
a<-table.row.end(a)
a<-table.row.start(a)
a<-table.element(a,'breakpoint index',header=TRUE)
a<-table.element(a,'greater',header=TRUE)
a<-table.element(a,'2-sided',header=TRUE)
a<-table.element(a,'less',header=TRUE)
a<-table.row.end(a)
for (mypoint in kp3:nmkm3) {
a<-table.row.start(a)
a<-table.element(a,mypoint,header=TRUE)
a<-table.element(a,gqarr[mypoint-kp3+1,1])
a<-table.element(a,gqarr[mypoint-kp3+1,2])
a<-table.element(a,gqarr[mypoint-kp3+1,3])
a<-table.row.end(a)
}
a<-table.end(a)
table.save(a,file='mytable5.tab')
a<-table.start()
a<-table.row.start(a)
a<-table.element(a,'Meta Analysis of Goldfeld-Quandt test for Heteroskedasticity',4,TRUE)
a<-table.row.end(a)
a<-table.row.start(a)
a<-table.element(a,'Description',header=TRUE)
a<-table.element(a,'# significant tests',header=TRUE)
a<-table.element(a,'% significant tests',header=TRUE)
a<-table.element(a,'OK/NOK',header=TRUE)
a<-table.row.end(a)
a<-table.row.start(a)
a<-table.element(a,'1% type I error level',header=TRUE)
a<-table.element(a,numsignificant1)
a<-table.element(a,numsignificant1/numgqtests)
if (numsignificant1/numgqtests < 0.01) dum <- 'OK' else dum <- 'NOK'
a<-table.element(a,dum)
a<-table.row.end(a)
a<-table.row.start(a)
a<-table.element(a,'5% type I error level',header=TRUE)
a<-table.element(a,numsignificant5)
a<-table.element(a,numsignificant5/numgqtests)
if (numsignificant5/numgqtests < 0.05) dum <- 'OK' else dum <- 'NOK'
a<-table.element(a,dum)
a<-table.row.end(a)
a<-table.row.start(a)
a<-table.element(a,'10% type I error level',header=TRUE)
a<-table.element(a,numsignificant10)
a<-table.element(a,numsignificant10/numgqtests)
if (numsignificant10/numgqtests < 0.1) dum <- 'OK' else dum <- 'NOK'
a<-table.element(a,dum)
a<-table.row.end(a)
a<-table.end(a)
table.save(a,file='mytable6.tab')
}