| Tabulation of Results | ||
| T x Used | ||
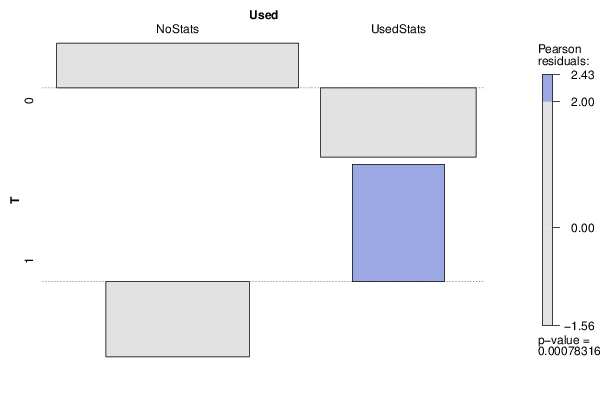
| NoStats | UsedStats | 0 | 89 | 25 | 1 | 20 | 20 |
| Tabulation of Expected Results | ||
| T x Used | ||
| NoStats | UsedStats | 0 | 80.69 | 33.31 | 1 | 28.31 | 11.69 |
| Statistical Results | |
| Pearson's Chi-squared test with Yates' continuity correction | |
| Pearson Chi Square Statistic | 9.96 |
| Degrees of Freedom | 1 |
| P value | 0 |