| Tabulation of Results | ||
| outcome x t20 | ||
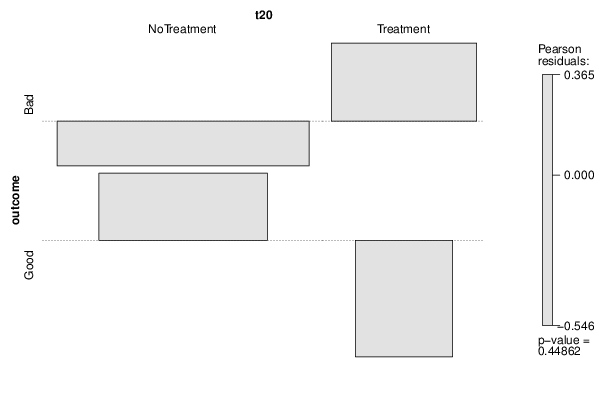
| NoTreatment | Treatment | Bad | 34 | 13 | Good | 17 | 4 |
| Tabulation of Expected Results | ||
| outcome x t20 | ||
| NoTreatment | Treatment | Bad | 35.25 | 11.75 | Good | 15.75 | 5.25 |
| Statistical Results | |
| Pearson's Chi-squared test with Yates' continuity correction | |
| Pearson Chi Square Statistic | 0.21 |
| Degrees of Freedom | 1 |
| P value | 0.65 |