| Tabulation of Results | ||
| outcome x t40 | ||
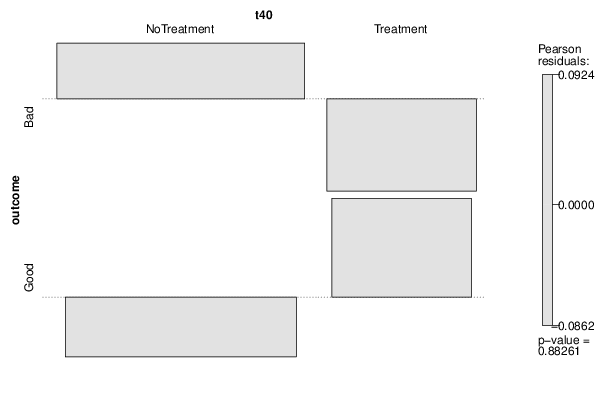
| NoTreatment | Treatment | Bad | 34 | 12 | Good | 29 | 11 |
| Tabulation of Expected Results | ||
| outcome x t40 | ||
| NoTreatment | Treatment | Bad | 33.7 | 12.3 | Good | 29.3 | 10.7 |
| Statistical Results | |
| Pearson's Chi-squared test with Yates' continuity correction | |
| Pearson Chi Square Statistic | 0 |
| Degrees of Freedom | 1 |
| P value | 1 |